Australia's Energy Commodity Resources 2024 Coal
Page last updated:15 July 2024
Coal
Summary statistics for Black Coal, 2022.
|
TDR 1,975,942 PJ ( 3%) | |
|
EDR 1,871,757 PJ ( 4%) |
|
Production 11,216 PJ ( 1%) | |
|
Export Income $113.8 b ( 190%) |
|
Production World Ranking 5 (6%) | |
|
Export World Ranking 2* (26%) |
Summary statistics for Brown Coal, 2022.
|
TDR 3,247,899 PJ (0%) | |
|
EDR 730,660 PJ (0%) |
|
Production 416 PJ ( 3%) | |
|
Export Income $0 b (0%) |
|
Production World Ranking 8 (4%) | |
|
Export World Ranking - (0%) |
Abbreviations:
TDR - Total Demonstrated Resources (the sum of Economic and Subeconomic Demonstrated Resources); EDR - Economic Demonstrated Resources; PJ – petajoules; $b – billion dollars (Australian); na – not available.
Notes:
Production and export income are reported on a financial year basis (2021-22). Percentage increases or decreases are in relation to 2021. World rankings are followed by percentage share in brackets *Australia ranks second behind Indonesia for total (black and brown) coal exports with 26% (8.39 exajoules) of world coal exports (Energy Institute, 2023).
Key messages
Key messages
- Coal is Australia’s largest energy resource. As at December 2022, Australia’s recoverable Total Demonstrated Resources of black coal were estimated at 1,975,942 PJ (78,139 Mt). Recoverable Total Demonstrated Resource of brown coal were estimated at 3,247,899 PJ (331,424 Mt).
- At the end of 2022, Australia’s recoverable Economic Demonstrated Resources were 1,871,757 PJ (72,875 Mt) for black coal and 730,660 PJ (74,039 Mt) for brown coal.
- Australia is ranked fourth, globally, for black coal Economic Demonstrated Resources and second for brown coal Economic Demonstrated Resources.
- Australia is the fifth largest producer, the second largest exporter and has the third largest reserves of coal in the world (Energy Institute, 2023).
- During 2021-22, export earnings from black coal totalled $113.8 billion, up from $39.2 billion in 2021-21 (Department of Industry, Science and Resources, 2023b).
- In 2022, coal exploration expenditure was $241.2 million, an increase of nearly 7% on 2021 ($226.2 million). Coal exploration was approximately 6% of the 2022 total exploration spend (Australian Bureau of Statistics, 2024).

Figure 4.1. Australia’s total recoverable Demonstrated Resources of black and brown coal as at end 2022 (PJ). For physical units (Mt) refer to Table 4.1 and Table 4.2.
Australia’s identified resources
Australia’s identified resources
Australia’s coal resources are expressed as Economic Demonstrated Resources (EDR), Subeconomic Demonstrated Resources (SDR) and Inferred Resources as defined below:
- Economic implies that, at the time of determination, profitable extraction or production under defined investment assumptions has been established, analytically demonstrated, or assumed with reasonable clarity;
- Demonstrated Resources are the sum of Measured and Indicated Resources, including Proved and Probable Reserves as defined by the Australasian Code for Reporting of Exploration Results, Mineral Resources and Ore Reserves also called the 'JORC Code' (Joint Ore Reserves Committee [JORC], 2012);
- Subeconomic refers to those resourcesthat are geologically demonstrated but which do not meet the criteria of economic at the time of determination; and
- Inferred Resources, as defined by the ‘JORC Code’,are the part of a Mineral Resource for which quantity and grade are estimated on limited geological evidence and sampling. Geological evidence is sufficient to imply, but not verify, geological and grade continuity. An Inferred Mineral Resource has a lower level of confidence than an Indicated Resource and must not be converted to an Ore Reserve.
- Coal Resource(s) and Coal Reserve(s),according to the ‘JORC Code’, the terms Mineral Resource and Ore Reserve apply to coal reporting but may be substituted with the terms Coal Resource and Coal Reserve. Coal, whilst a sediment rather than a mineral, is captured by the ‘JORC Code’ because the ‘JORC Code’ applies to solid materials of economic interest, and is “mined”, as opposed to liquid oil or gas resources which “flow” out of the surrounding rock.
At 31 December 2022, Australia had substantial EDR (Figure 4.1) and Inferred Resources (Table 4.2, Figure 4.2) of black and brown coal (Table 4.1 and Table 4.2).
Black coal
Most of Australia’s black coal EDR are located in Queensland and New South Wales, followed by smaller volumes in South Australia, Western Australia and Tasmania. There are two main types of black coal products: metallurgical coal and thermal coal. Metallurgical coal (also called met coal or coking coal) is mostly used for steel making and other industrial processes. Thermal coal (also called steaming coal) is used for electricity generation.
Total in-situ resources of black coal in Australia (EDR plus SDR plus Inferred Resources) are estimated at 192,894 Mt, comprising 85,990 Mt of EDR, 7,104 Mt of SDR and 99,800 Mt of Inferred Resources. Australia’s total recoverable Identified Resources of black coal are estimated to be 156,164 Mt, comprising 72,875 Mt of EDR, 5,264 Mt of SDR and 78,025 Mt of Inferred Resources (Table 4.1).
In 2022, the estimate of Australia’s recoverable EDR of black coal was revised downwards from 75,433 Mt to 72,875 Mt, a decrease of 2,558 Mt, or 3%, from the previous year. The revision included a large decrease due to an updated economic assessment at Mount Arthur (BHP), a thermal coal mine in New South Wales.
Brown coal
Total in situ resources (all categories) of brown coal, are estimated to be 488,664 Mt, of which in situ EDR are 81,234 Mt, SDR are 284,921 Mt and Inferred Resources are 122,509 Mt. Total recoverable Identified resources of brown coal are estimated at 436,652 Mt, of which recoverable EDR are 74,039 Mt, SDR are 257,385 Mt and Inferred Resources are 105,228 Mt (Table 4.4). Nearly all of Australia’s recoverable brown coal EDR is in Victoria, with more than 90% in the Gippsland Basin (Latrobe Valley).
Table 4.1. Australia's remaining black coal resources by basin area to year end 2022 (Mt and PJ).
| Basin | Black Coal | |||||
|---|---|---|---|---|---|---|
| EDR (PJ) | SDR (PJ) | Inferred (PJ) | EDR (Mt) | SDR (Mt) | Inferred (Mt) | |
| Arckaringa Basin | 10,591 | 44,692 | 148,598 | 623 | 2,538 | 8,577 |
| Ashford Basin | 0 | 246 | 361 | 0 | 8 | 13 |
| Bowen Basin | 766,908 | 3,309 | 521,242 | 27,775 | 123 | 18,830 |
| Boyup Basin | 0 | 0 | 1,596 | 0 | 0 | 81 |
| Callide Basin | 8,007 | 0 | 1,299 | 430 | 0 | 70 |
| Canning Basin | 2,732 | 0 | 3,706 | 139 | 0 | 188 |
| Clarence-Moreton Basin | 51,158 | 398 | 12,164 | 1,926 | 15 | 454 |
| Collie Basin | 5,812 | 0 | 1,347 | 295 | 0 | 68 |
| Eromanga Basin | 12,465 | 0 | 100,794 | 594 | 0 | 4,800 |
| Galilee Basin | 251,139 | 3,872 | 475,776 | 11,282 | 176 | 21,227 |
| Gloucester Basin | 6,062 | 0 | 2,949 | 227 | 0 | 111 |
| Gunnedah Basin | 53,895 | 19,287 | 11,641 | 1,996 | 945 | 431 |
| Ipswich Basin | 0 | 8,531 | 0 | 0 | 328 | 0 |
| Laura Basin | 455 | 0 | 1,571 | 15 | 0 | 52 |
| Leigh Creek* | 2,271 | 1,985 | 2,526 | 151 | 131 | 166 |
| Maryborough Basin | 2,141 | 675 | 5,822 | 74 | 23 | 198 |
| Mulgildie Basin | 1,759 | 0 | 6,290 | 65 | 0 | 233 |
| Oaklands Basin | 32,085 | 0 | 13,869 | 1,395 | 0 | 603 |
| Pedirka Basin | 0 | 0 | 0 | 0 | 0 | 0 |
| Perth Basin | 2,313 | 3,214 | 19,073 | 117 | 177 | 991 |
| Polda Basin | 0 | 4204.8 | 0 | 0 | 288 | 0 |
| Styx Basin | 880 | 0 | 4,337 | 31 | 0 | 152 |
| Surat Basin | 202,372 | 0 | 260,171 | 8,145 | 0 | 10,209 |
| Sydney Basin | 421,411 | 13,709 | 266,877 | 15,757 | 509 | 10,211 |
| Tarong Basin | 28,169 | 0 | 2,459 | 1,437 | 0 | 125 |
| Tasmania Basin | 9,133 | 63 | 1573.2 | 401 | 3 | 69 |
| Wilga Basin | 0 | 0 | 3,251 | 0 | 0 | 165 |
| Total | 1,871,757 | 104,185 | 1,869,290 | 72,875 | 5,264 | 78,025 |
Table 4.2. Australia's remaining brown coal resources by basin area to year end 2022 (Mt and PJ).
| Basin | Brown Coal | |||||
|---|---|---|---|---|---|---|
| EDR (PJ) | SDR (PJ) | Inferred (PJ) | EDR (Mt) | SDR (Mt) | Inferred (Mt) | |
| Eucla Basin | 10,106 | 7,198 | 34,396 | 513 | 365 | 1,746 |
| Gippsland Basin | 717,730 | 2,457,566 | 794,474 | 73,238 | 250,772 | 81,069 |
| Kazput* | 0 | 0 | 2,815 | 0 | 0 | 153 |
| Murray Basin | 0 | 25,335 | 149,887 | 0 | 3,478 | 15,295 |
| Otway Basin | 2,824 | 8,282 | 46,464 | 288 | 845 | 6,181 |
| St Vincent Basin | 0 | 18,857 | 7,688 | 0 | 1,924 | 784 |
| Total | 730,660 | 2,517,239 | 1,035,724 | 74,039 | 257,384 | 105,228 |
Abbreviations on tables 4.3 and 4.4
EDR = economic demonstrated resources. SDR = subeconomic demonstrated resources. Mt = million tonnes. PJ = petajoules.
Notes on tables 4.3 and 4.4
Additional coal resources are also present outside of these basin areas, which are included in the totals documented in AECR. The data shown have been rounded. *Kazput and Leigh Creek are deposits. Source: Geoscience Australia OZMIN database, accessed 27 February 2024.
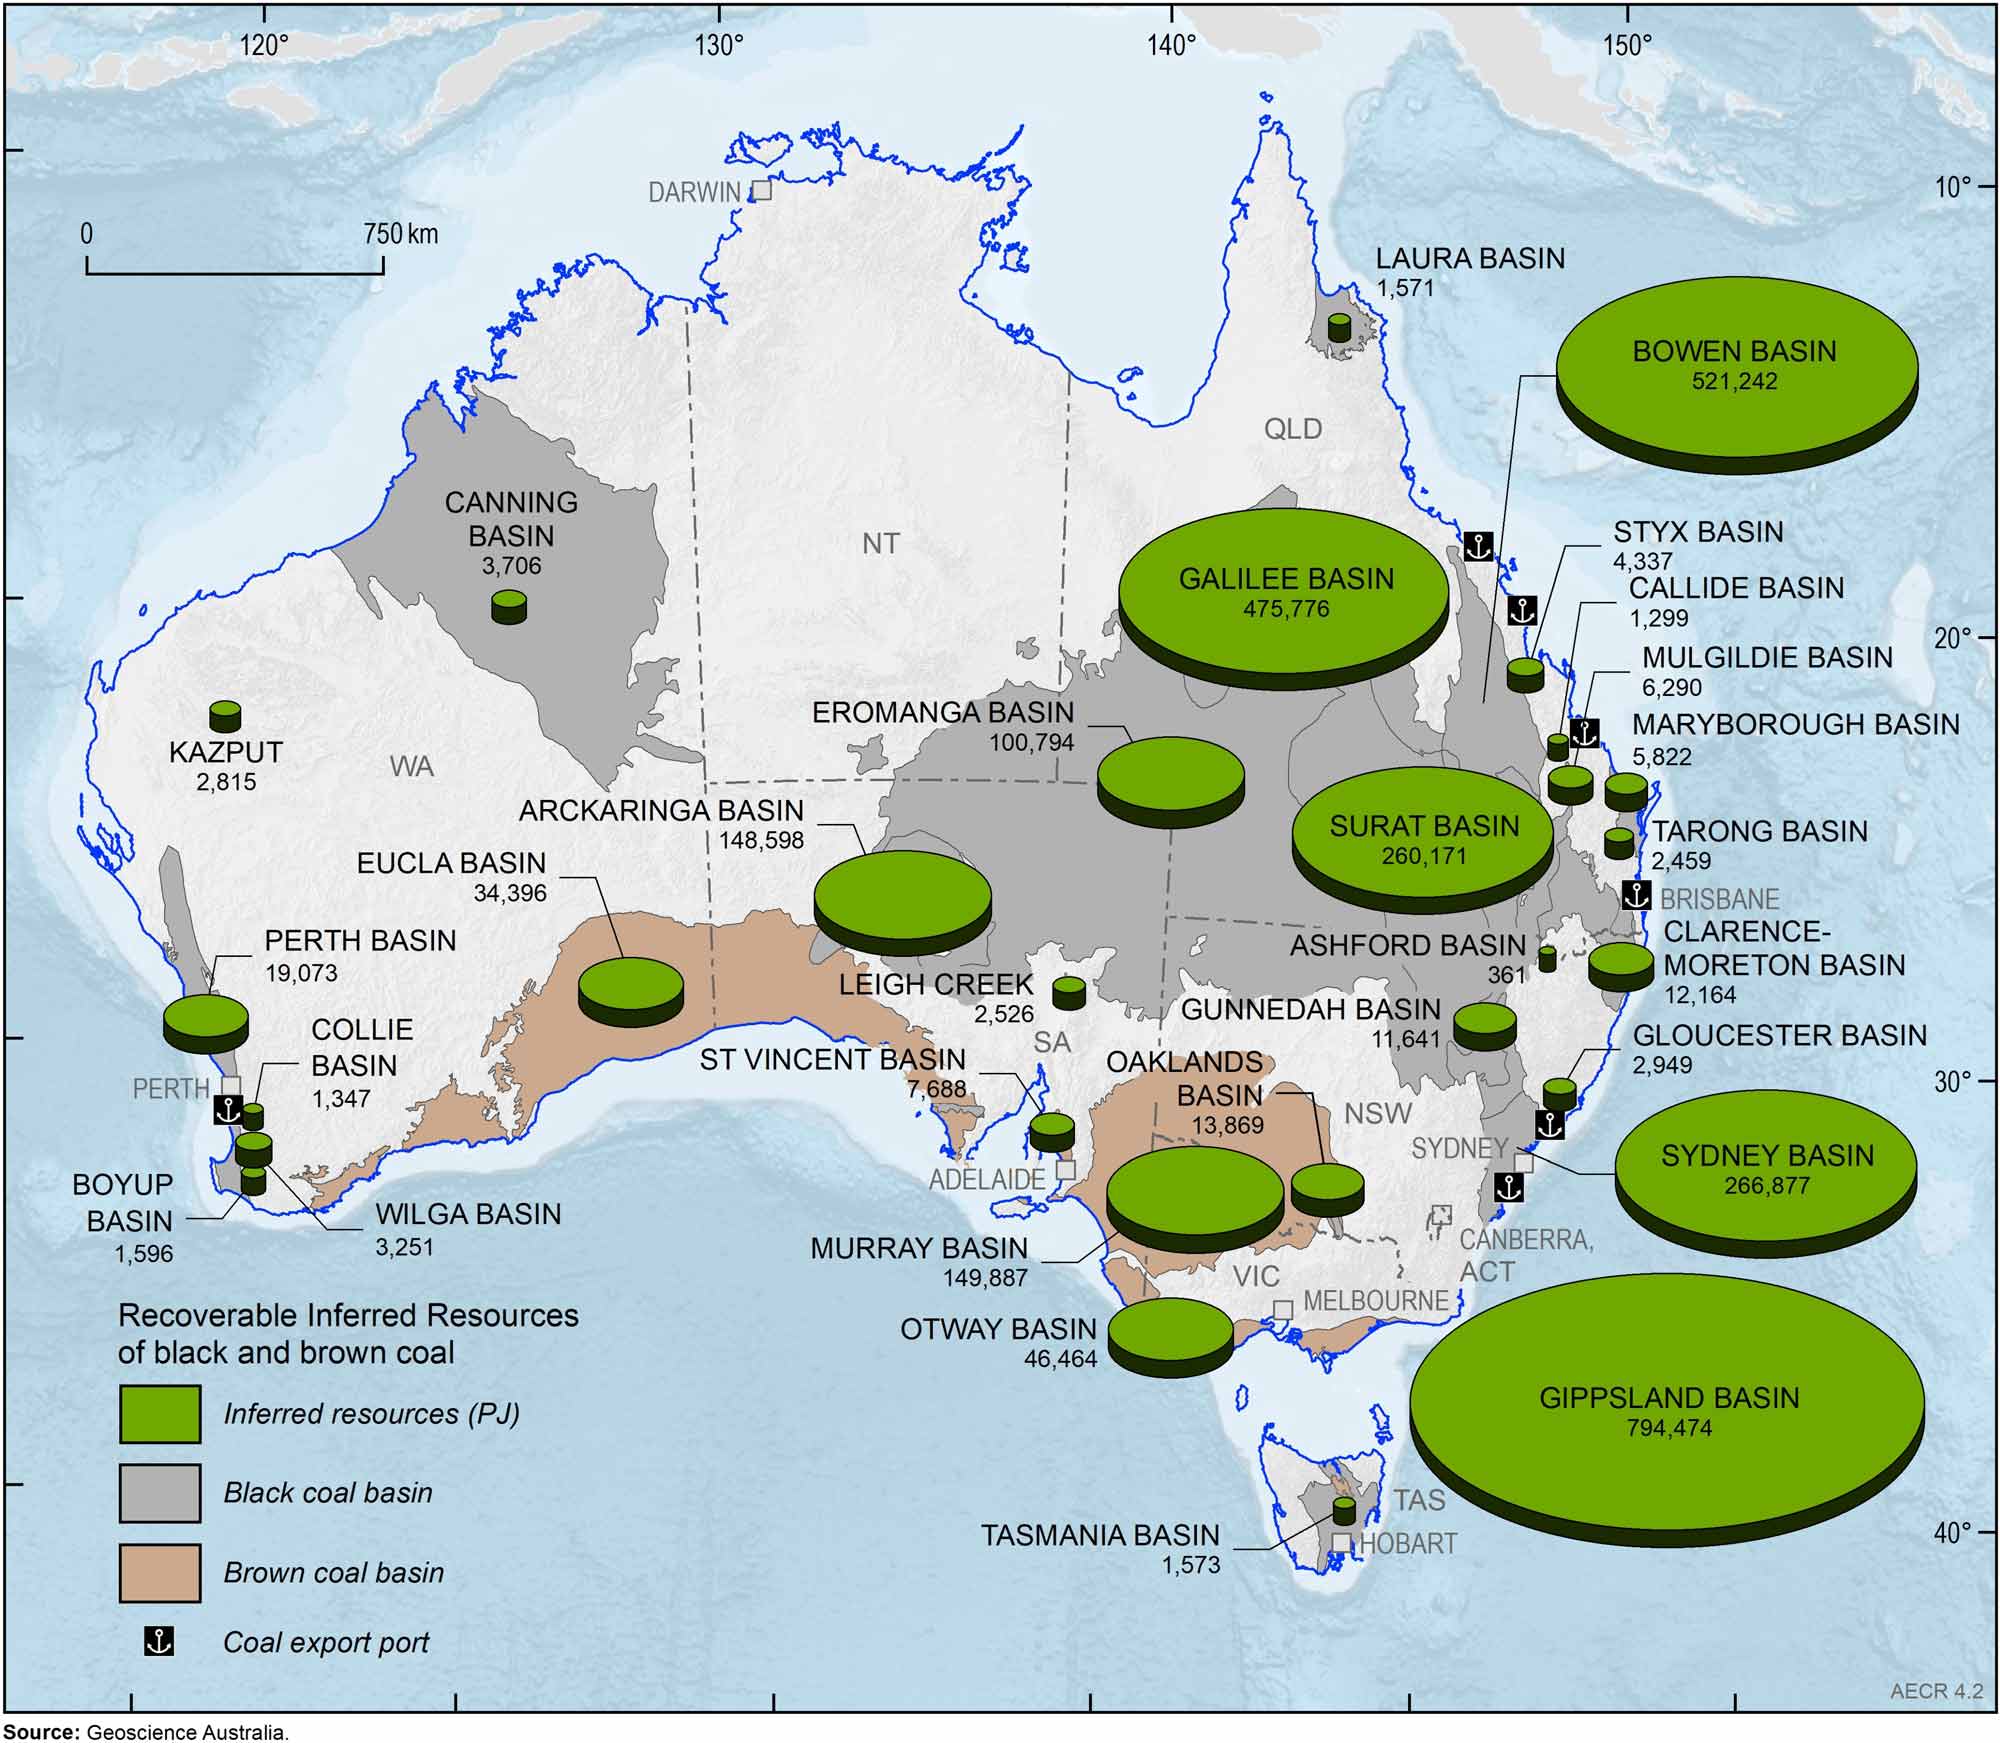
Figure 4.2. Australia’s black and brown coal Inferred Resources as at end 2022 (PJ). For physical units (Mt) refer to Table 4.1 and Table 4.2.
Production
Production
During 2022, Australia had 93 operating black coal mines, 3 operating brown coal mines (Figure 4.3), and more than 200 known coal deposits. Most of Australia’s black coal is produced in Queensland (56%) and New South Wales (43%), the remainder is mined in Western Australia and Tasmania (Figure 4.3). Brown coal produced in Victoria, mainly from the Gippsland Basin, contributed 40.3 Mt and 416 PJ equating to nearly 10% of total coal production and nearly 4% of total coal energy production in 2021–22 (Department of Climate Change, Energy, the Environment and Water 2023c).
In 2021–22, Australia’s production of saleable black and brown coal was 11,631 PJ, which accounted for 55% of total energy production (including uranium production; Department of Climate Change, Energy, the Environment and Water 2023c). Over the past decade, coal production has increased by an average annual rate of 0.9%. This increase was moderated by falls in 2015–16, in 2019–20 due to the impact of COVID-19 on global demand, and in 2020-21 and 2021-22 coal production and export was affected by flooding and Chinese restrictions on Australian coal imports (Figure 4.5). In 2021–22, 90% of Australia’s black coal energy production was exported (Figure 4.6).
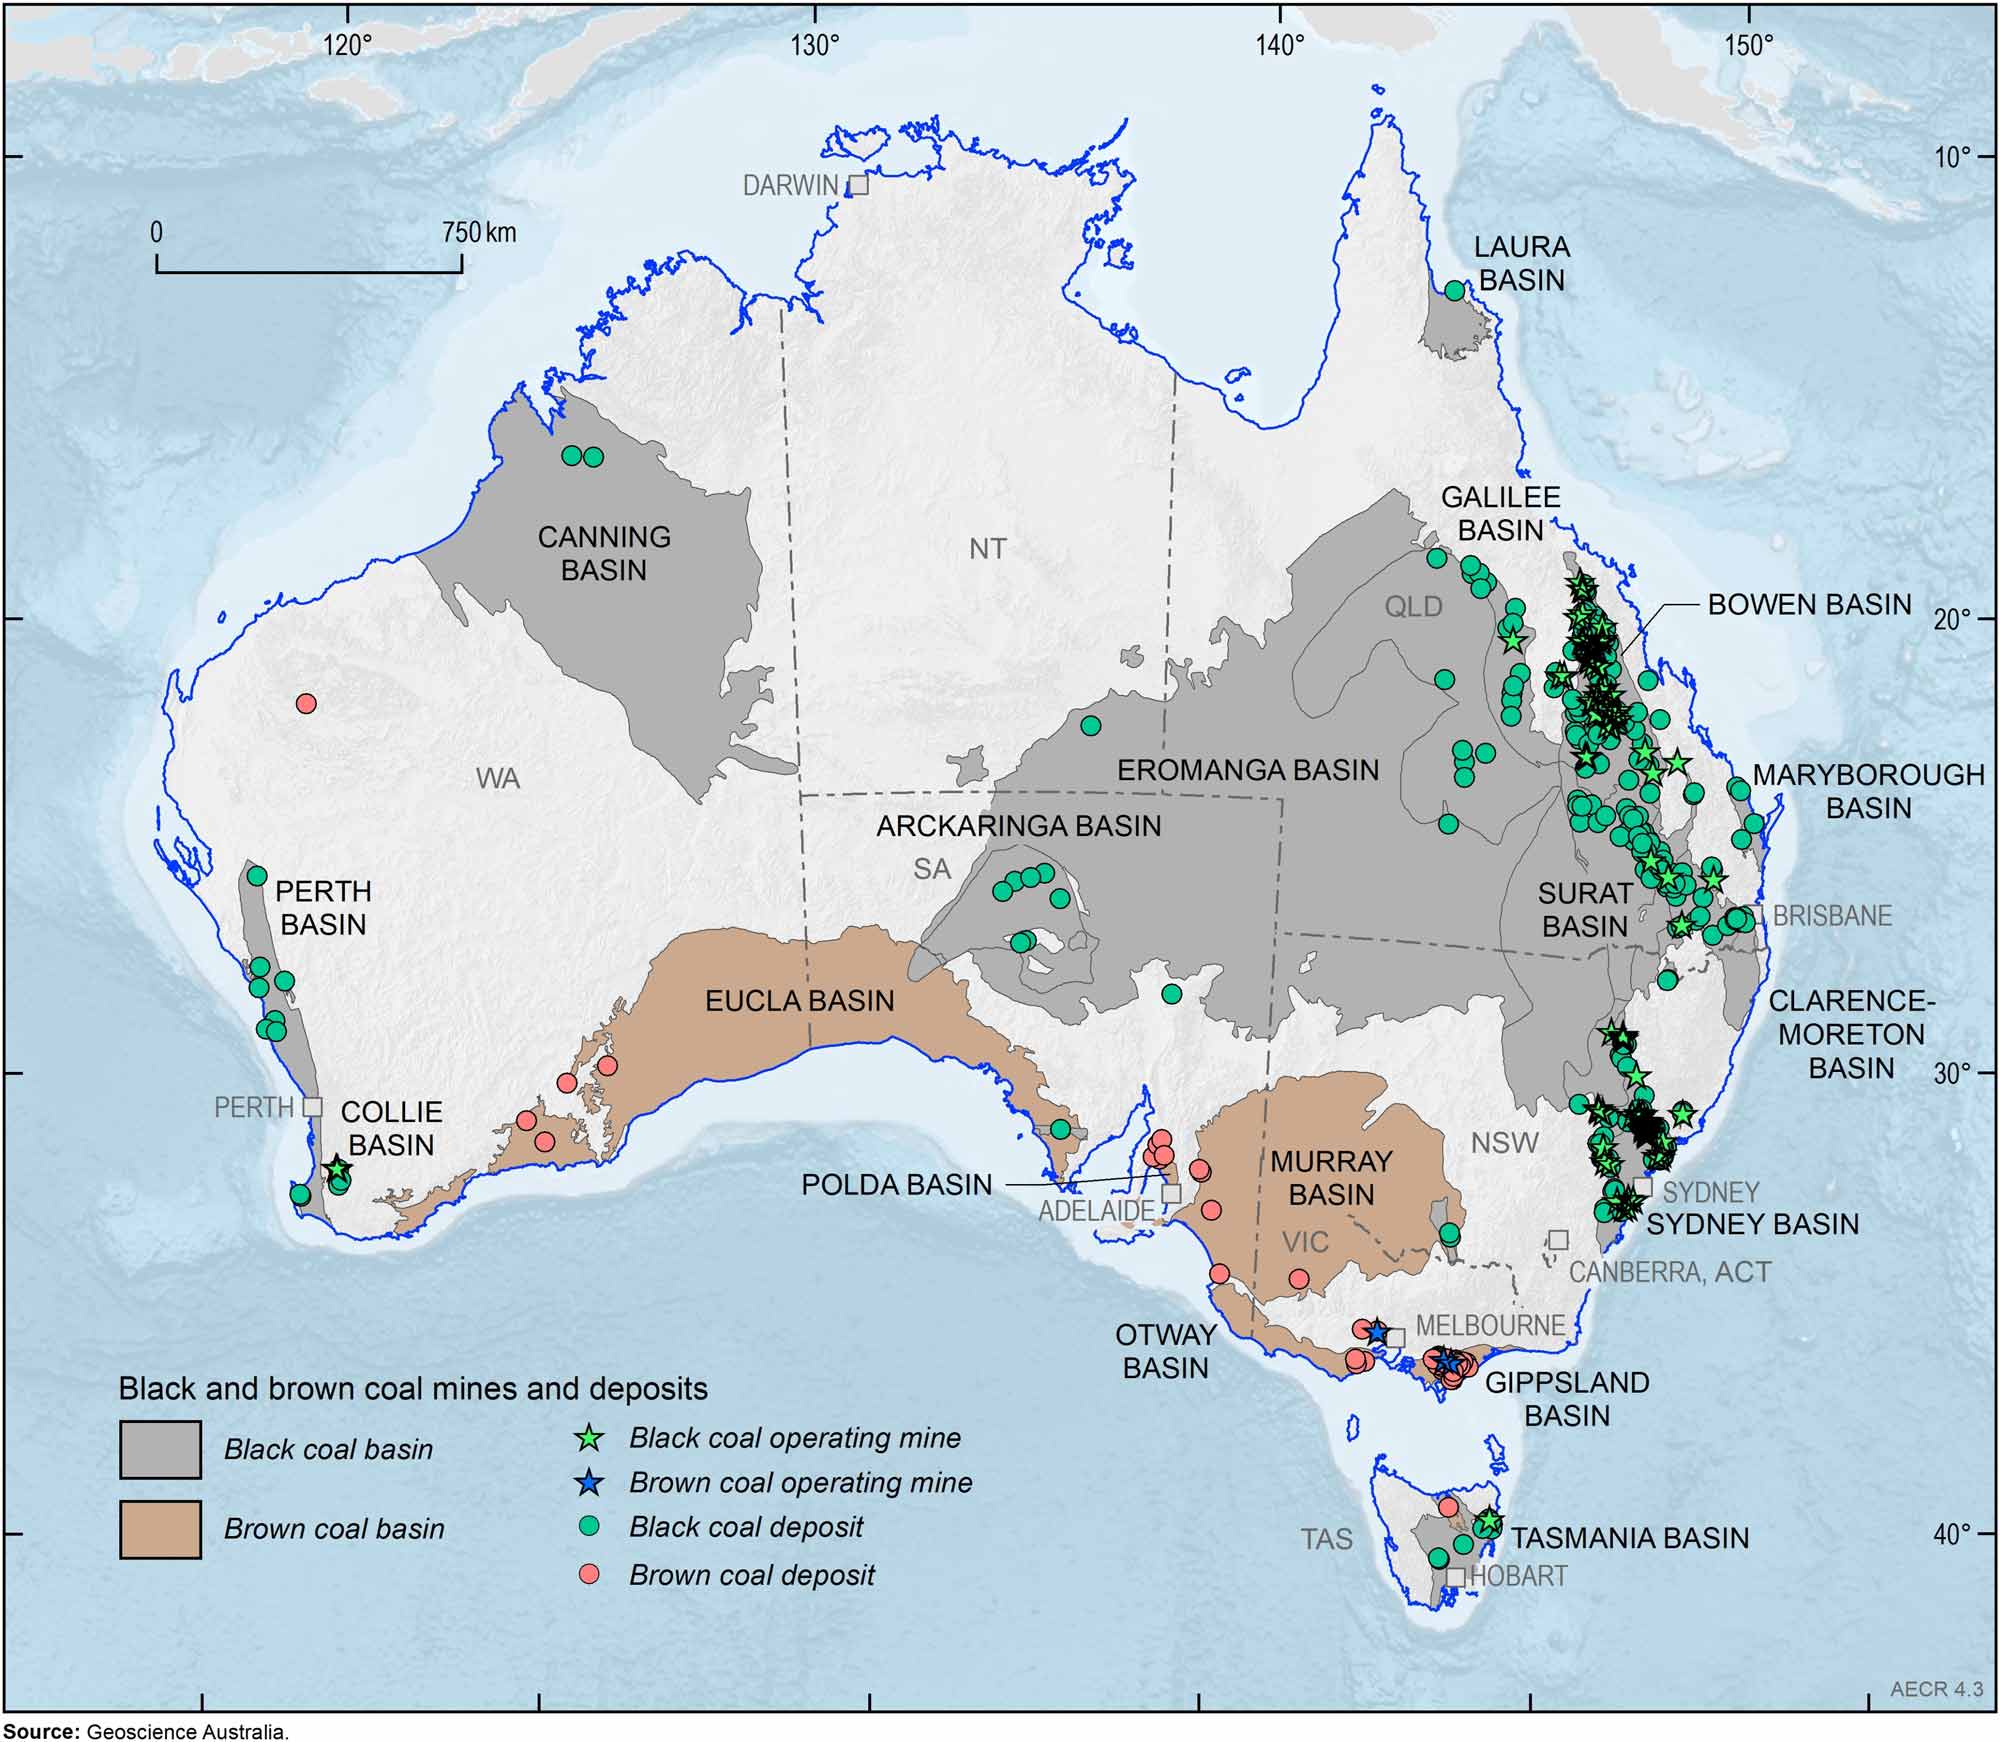
Figure 4.3. Australia's black and brown coal mines and deposits.

Figure 4.4. Historical trends in Australia’s coal production, by state.
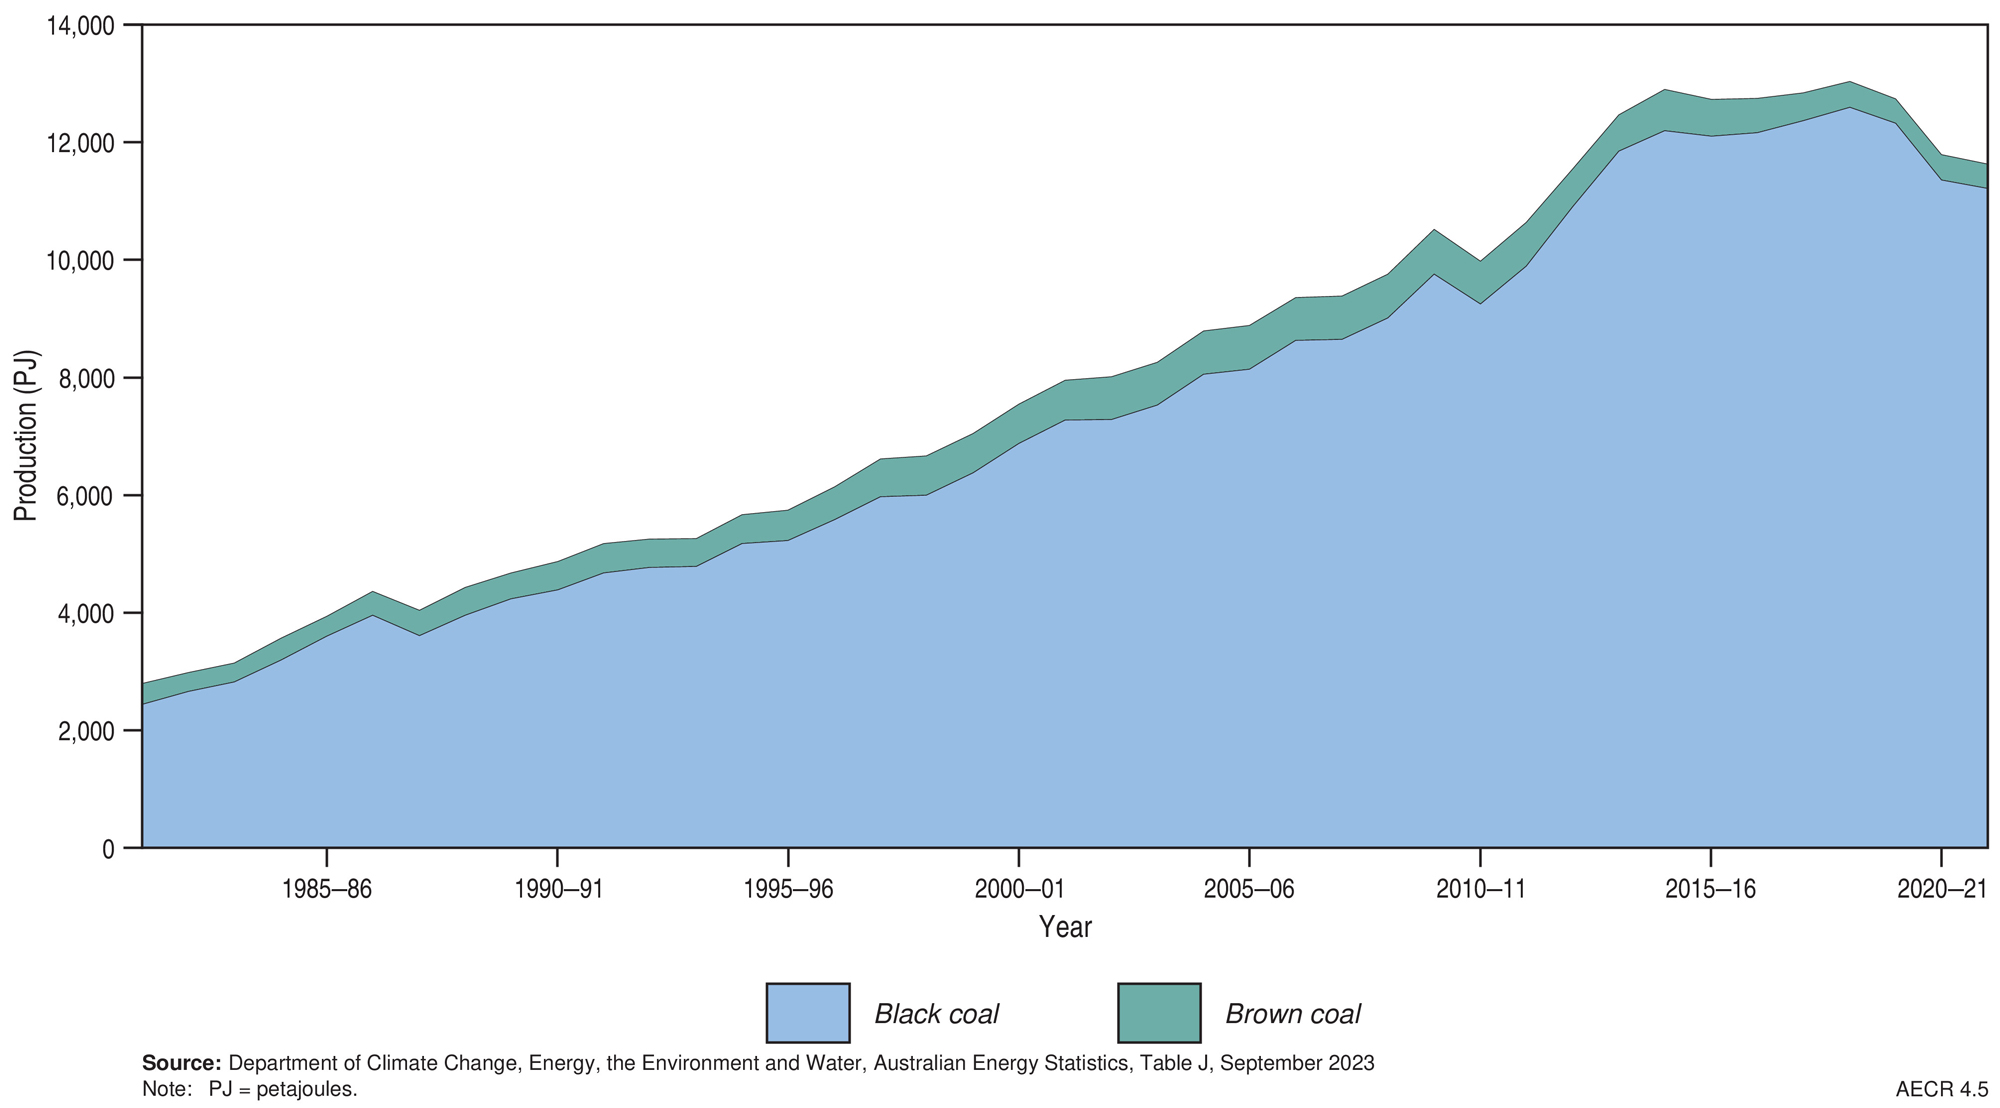
Figure 4.5. Historical trends in Australia’s black coal and brown coal production.
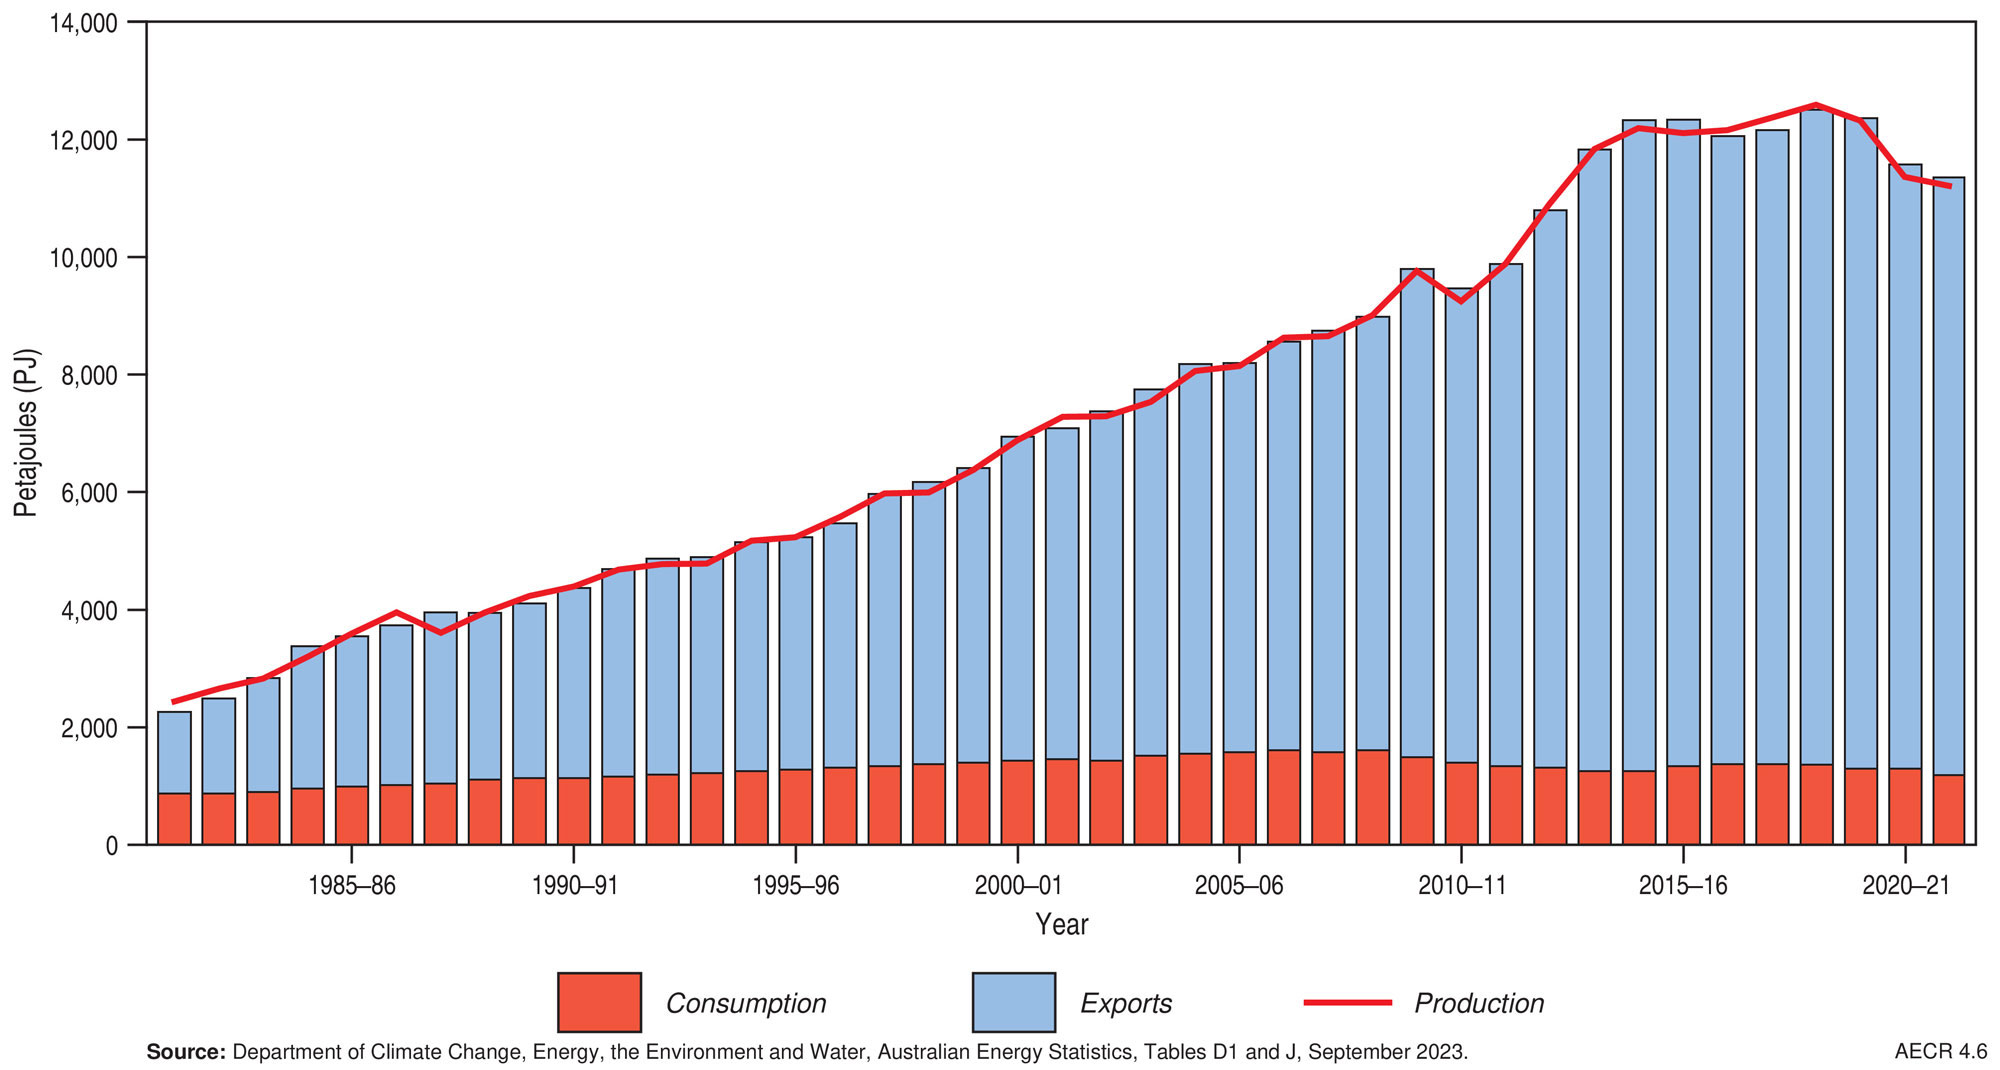
Figure 4.6. Historical trends in Australia’s black coal production, consumption and exports.
Trade
Trade
Australia exports the majority of its coal, capitalising on its abundant coal resources and strong ongoing coal demand from Asia. Australia exported 10,173 PJ of coal and coal products in 2021–22, which was about 57% of Australia’s total energy exports (including uranium exports; Department of Climate Change, Energy, the Environment and Water, 2023d). The total value of coal exports increased by an average rate of 9% per year from $38.6 billion in 2012–13 to $113.8 billion in 2021–22 (Figure 4.7).
Coal exports to China were on hold in 2021–22, exports to Japan, South Korea and Taiwan increased and exports to India and other destinations remained relatively high (Figure 4.8). Coal export volumes have grown at an average annual rate of 1.8% from 302 Mt in 2011–12 to 359 Mt in 2021–22; however, in 2021–22 Australian coal production was constrained, and exports decreased during the year (Department of Industry, Science and Resources, 2023b). However, even though production was constrained, with global disruptions to production and supply chains, the average Newcastle thermal coal spot price increased to US$359/t in 2022, compared to US$135/t in 2021, and the Australian east coast premium hard coking coal spot price averaged US$364/t, compared to US$221/t in 2021 (Department of Industry, Science and Resources, 2023b).
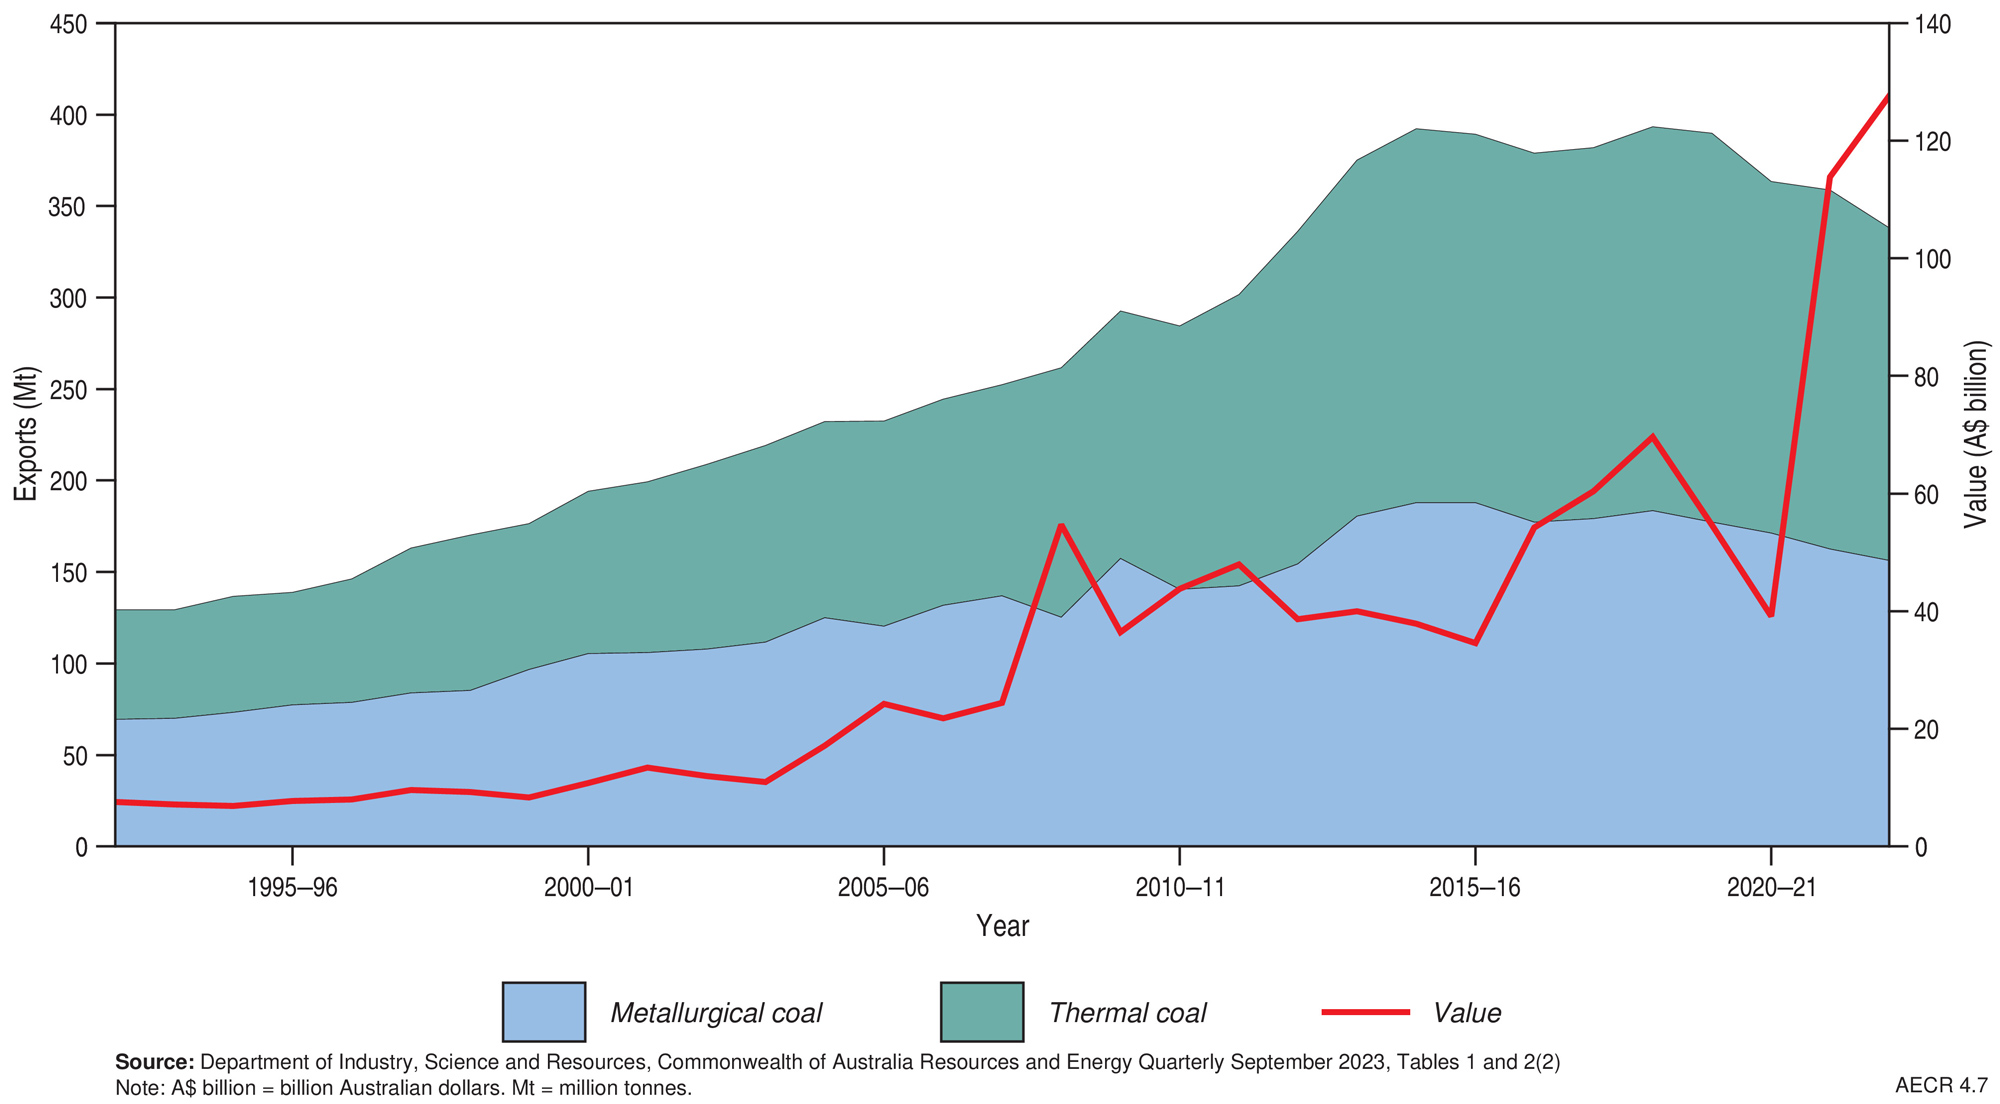
Figure 4.7. Historical trends in the volume and value of Australia’s coal exports.
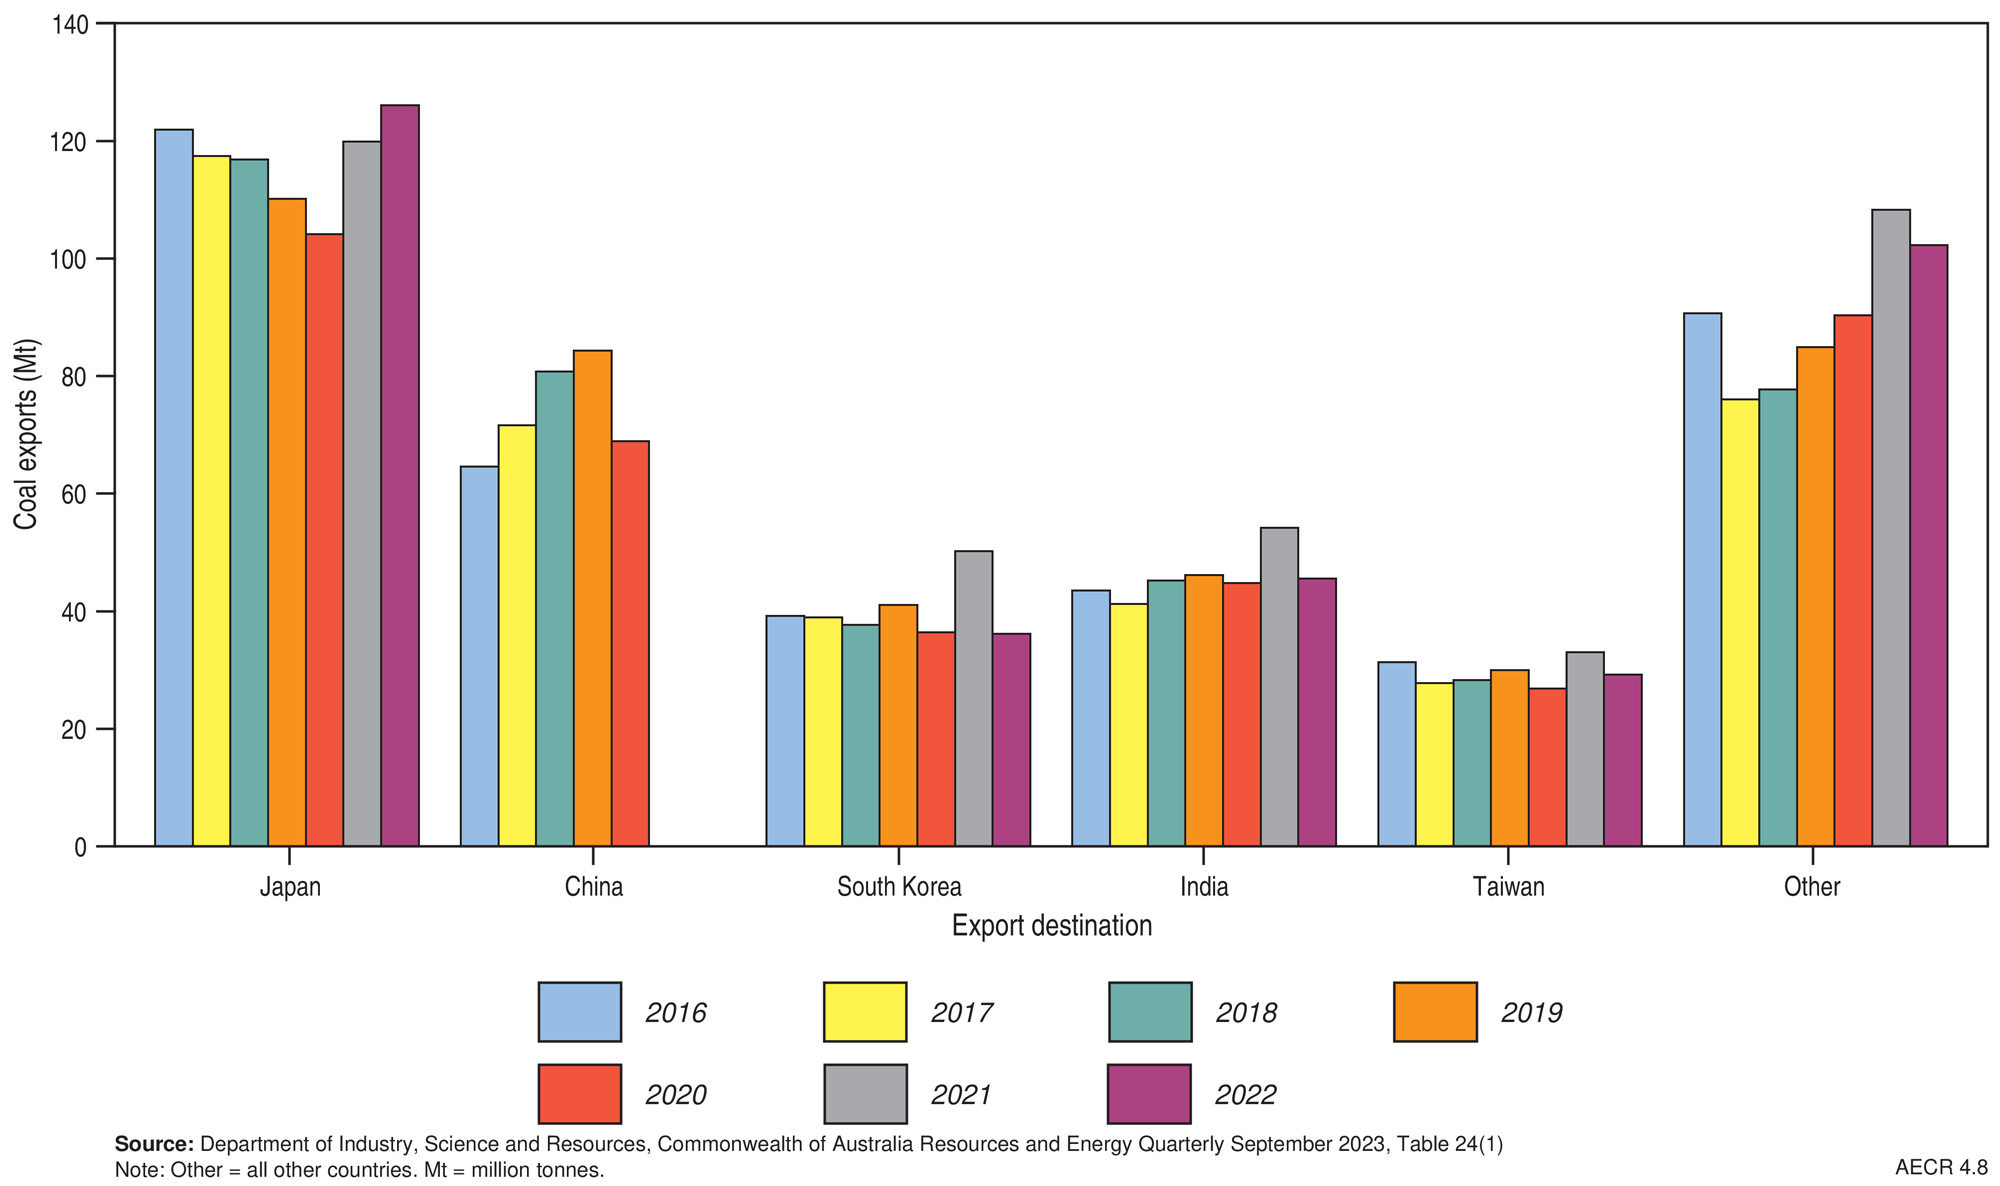
Figure 4.8. Australia’s coal exports, by destination.
World rankings
World rankings
Reserves
In 2020, Australia held 14% of the world’s coal reserves (black and brown), ranking third behind the United States (23%) and Russia (15%) (Energy Institute, 2023; Figure 4.9; Table 4.3).
Regarding black coal, Australia is thought to hold about 10% of world economic resources and ranks fourth behind the United States (29%), China (18%) and India (14%), while for brown coal our share of the world’s economic resources is 23%, ranking Australia second in the world behind Russia (28%) (Federal Institute for Geosciences and Natural Resources, 2022).
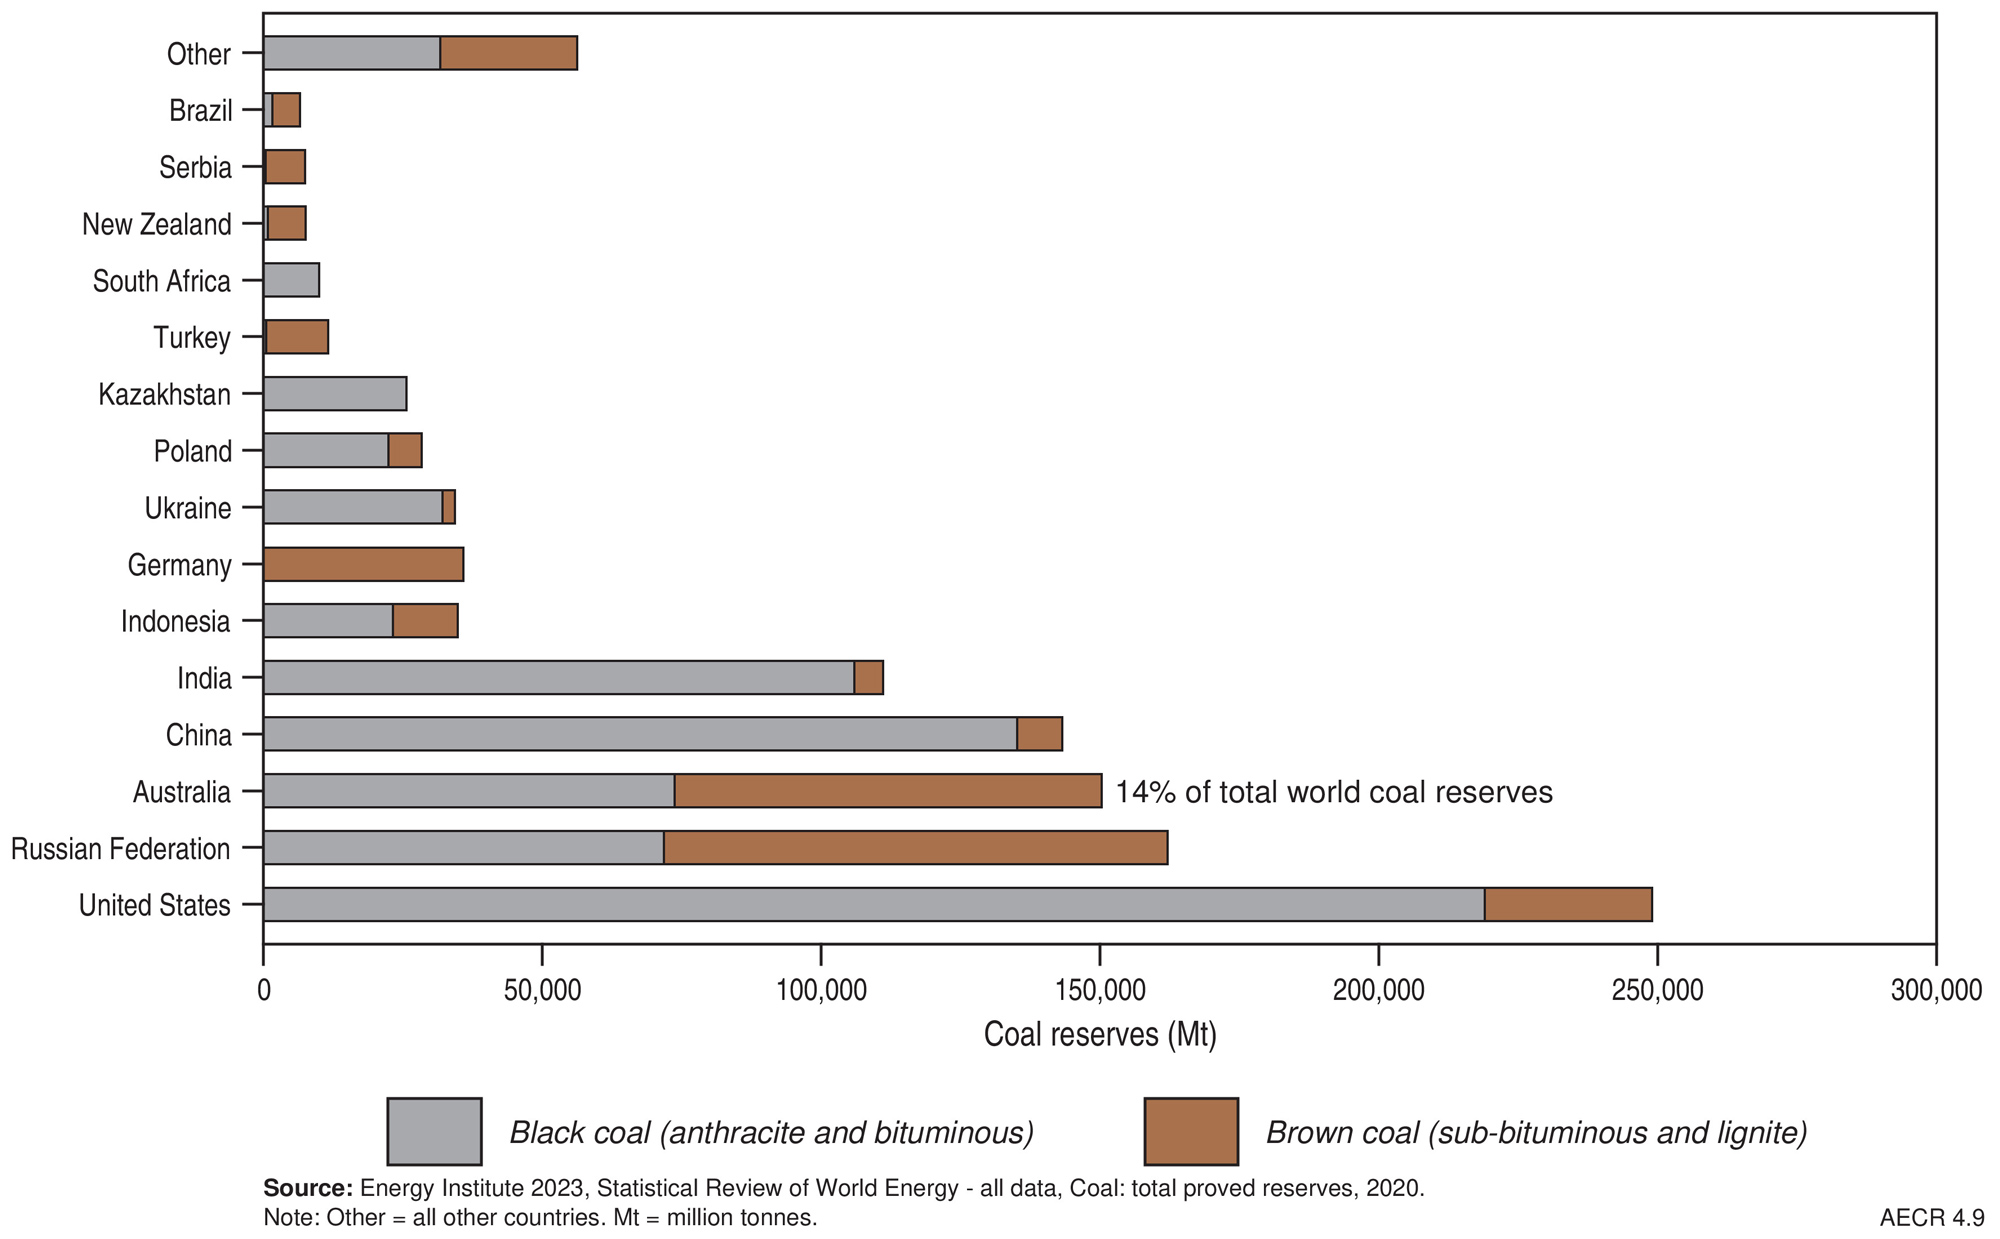
Figure 4.9. World black and brown coal reserves, 2020.
Production
In 2022, Australia accounted for nearly 7% of coal production (black and brown), ranking fifth behind China (53%), India (9%), Indonesia (8%) and the United States (7%) (Energy Institute, 2023; Table 4.3).
Export
In 2021–22 Australia was the world’s largest exporter of metallurgical coal and the second largest exporter of thermal coal (Department of Industry, Science and Resources, 2023a). Australia ranks second behind Indonesia for total (black and brown) coal exports with 26% (8.39 exajoules) of world coal exports (Energy Institute, 2023).
Table 4.3. Key coal statistics.
| Unit | Australia 2022 | World 2022 | |
|---|---|---|---|
| Resources | |||
| Total proved reserves (at end of year) | PJ | 2,602,417a | 22,214,333b |
| Mt | 146,914a | 1,074,108b | |
| Black coal (anthracite and bituminous) proved reserves | PJ | 1,871,757a | 18,840,975b |
| Mt | 72,875a | 753,639b | |
| Brown coal (sub-bituminous1 and lignite) proved reserves | PJ | 730,660a | 3,373,358b |
| Mt | 74,039a | 320,469b | |
| Share of world black coal reserves | % | 10a | 100b |
| Share of world brown coal reserves | % | 23a | 100b |
| World ranking black coal | no. | 4a | na |
| World ranking brown coal | no. | 2a | na |
| Production | |||
| Annual production | PJ | 11,631c | 174,564b |
| Mt | 457c | 8,803b | |
| CAGR from 2011-12 | % (PJ) | 0.9c | 0.7b |
| % (Mt) | 0.5c | 0.8b | |
| Share of world production | % (PJ) | 7b | 100b |
| % (Mt) | 5b | 100b | |
| World ranking | no. | 5b | na |
| Exports | |||
| Total exports 2021-22 | PJ | 10,173c | 32,471b |
| CAGR from 2011-12 | % | 1.8c | 0.6b |
| Total export value | A$b | 113.8d | na |
| Metallurgical coal and coke export value | A$b | 67.6d | na |
| Thermal coal export value | A$b | 46.3d | na |
| World ranking metallurgical coal | no. | 1d | na |
| World ranking thermal coal | no. | 2d | na |
Abbreviations
CAGR = compound annual growth rate. PJ = petajoules. Mt = million tonnes. A$b = billion Australian dollars. na = not available.
Notes
¹Sub-bituminous coal has properties that range from those of brown coal to those of black coal—there is therefore some variation in this terminology across countries. ᵃRecoverable economic demonstrated resource (EDR). ᵇProved reserves of coal as defined by the Energy Institute. Definitions vary between data sourced from the Energy Institute and the Australian Energy Statistics (AES). For example, the international data are reported as net energy content, whereas AES data are reported as gross energy content. World reserve data are current as of 2020, world production and export data are current as of 2022. Australian production and export data are for calendar year 2021-22. Sources: aGeoscience Australia, Australia's Identified Mineral Resources 2023; ᵇEnergy Institute 2023, Statistical Review of World Energy; cAustralian Energy Statistics 2023, Tables J and P, published by Department of Climate Change, Energy, the Environment and Water (2023a); dResources and Energy Quarterly – March 2023, Tables 2 and 24(2), published by Department of Industry, Science and Resources 2023.
References
References
Australian Bureau of Statistics 2024. Mineral and Petroleum Exploration, Australia, Table 5. Released 4 March 2024 (last accessed 22 March 2024).
Federal Institute for Geosciences and Natural Resources (Bundesanstalt für Geowissenschaften und Rohstoffe [BGR]), 2022. BGR Energy Data 2021 – Data and developments concerning German and Global Energy Supplies (last accessed 18 April 2024).
Department of Climate Change, Energy, the Environment and Water 2023a. Australian Energy Update, (last accessed 22 March 2024).
Department of Climate Change, Energy, the Environment and Water 2023b. Australian Energy Statistics, Table I (last accessed 22 March 2024).
Department of Climate Change, Energy, the Environment and Water 2023c. Australian Energy Statistics, Table J (last accessed 22 March 2024).
Department of Climate Change, Energy, the Environment and Water 2023d. Australian Energy Statistics, Table J; Table S (last accessed 22 March 2024).
Department of Industry, Science, Energy and Resources 2023a. Resources and Energy Quarterly: December 2023 (last accessed 22 March 2024).
Department of Industry, Science and Resources 2023b. Resources and Energy Quarterly: March 2023 (last accessed 22 March 2024).
Energy Institute, 2023. Statistical Review of World Energy. (last accessed 22 March 2024).
Hughes, A., Britt, A., Pheeney, J., Morfiadakis, A., Kucka, C., Colclough, H., Munns, C., Senior, A., Cross, Summerfield, D., Hitchman, A., Cheng, Y., Walsh, J., Thorne, J. and Sexton, M., 2024. Australia's Identified Mineral Resources 2023. Geoscience Australia, Canberra (last accessed 22 March 2024).
International Energy Agency, Coal 2023 Analysis and forecast to 2026 (last accessed 22 March 2024).
Joint Ore Reserves Committee 2012. Australasian Code for Reporting of Exploration Results, Mineral Resources and Ore Reserves. The JORC Code (last accessed 25 May 2022).
Data download
Data download
Australia's Energy Commodity Resources Data Tables - 2022 reporting period