Australia's Energy Commodity Resources 2024 Gas
Page last updated:15 July 2024
Gas
Summary statistics for natural gas, 2022.
|
TDR 250,221 PJ ( 3.0%) | |
|
Reserves (2P) 108,920 PJ ( 3.7%) |
|
Production 6,362 PJ ( 3.4%) | |
|
Export Income $90.3 b ( 81.4%) |
|
Production World Ranking 7 (3.8%) | |
|
Export World Ranking 2 (22.7%) |
Abbreviations:
TDR = Total demonstrated resources (2P reserves plus 2C contingent resources); PJ = petajoules. Percentage increases or decreases are in relation to 2021. World rankings are followed by percentage share in brackets.
Key messages
Key messages
- In this report, ‘gas resources’ refers to conventional and unconventional natural gas resources, including coal seam gas (CSG), shale gas, tight gas, basin centred gas and in-situ gasification products.
- Natural gas is formed when accumulations of organic matter are buried and exposed to increasing heat and pressure over geological time. The generated gas consists of a mixture of methane and often other heavier hydrocarbons, as well as other gases including carbon dioxide, nitrogen, hydrogen sulphide and helium.
- Conventional gas and coal seam gas (CSG) remain Australia’s most important gas resources for energy generation and export.
- Australia’s proven and probable (2P) reserves for conventional gas in 2022 are estimated as 78,061 petajoules (PJ; 69.41 Tcf), a decline of 5,246 PJ (6.3%) from 2021, while for coal seam gas, proven and probable reserves are estimated as 30,859 PJ (27.44 Tcf) in 2022, an increase of 1,107 PJ (3.7%) from 2021.
- In 2022, Australia’s identified contingent (2C) conventional gas resources are estimated as 98,649 PJ (87.71 Tcf), a decrease of 5,883 PJ (5.6%) from 2021; while coal seam gas contingent resources are estimated as 25,489 PJ (22.66 Tcf), a decrease of 2,075 PJ (7.5%) from 2021 (Table 2.1 and Table 2.2; Figure 2.1)
- About 93% of conventional gas resources are located on the North West Shelf where gas is produced from the Northern Carnarvon, Browse and Bonaparte basins providing feedstock to seven LNG projects (Gorgon, Wheatstone, North West Shelf, Pluto, Prelude, Ichthys and Darwin).
- In 2022, annual gas production overall increased slightly (3%), reaching 6,362 PJ, as the impact of COVID-19 subsided and production at the Prelude and Gorgon facilities recovered from technical issues and routine maintenance. Based on the 2022 production rate, the identified conventional and unconventional 2P gas reserves, identified for this period may support the equivalent of 17 years of further production.
- About 70% of Australia’s natural gas production was exported in 2022.
- During 2022, Australia was the seventh largest global gas producer and our LNG exports remained at record levels, with 81.4 million tonnes (Mt; 4,427 PJ) of gas exported, making Australia the world’s second largest LNG exporter.
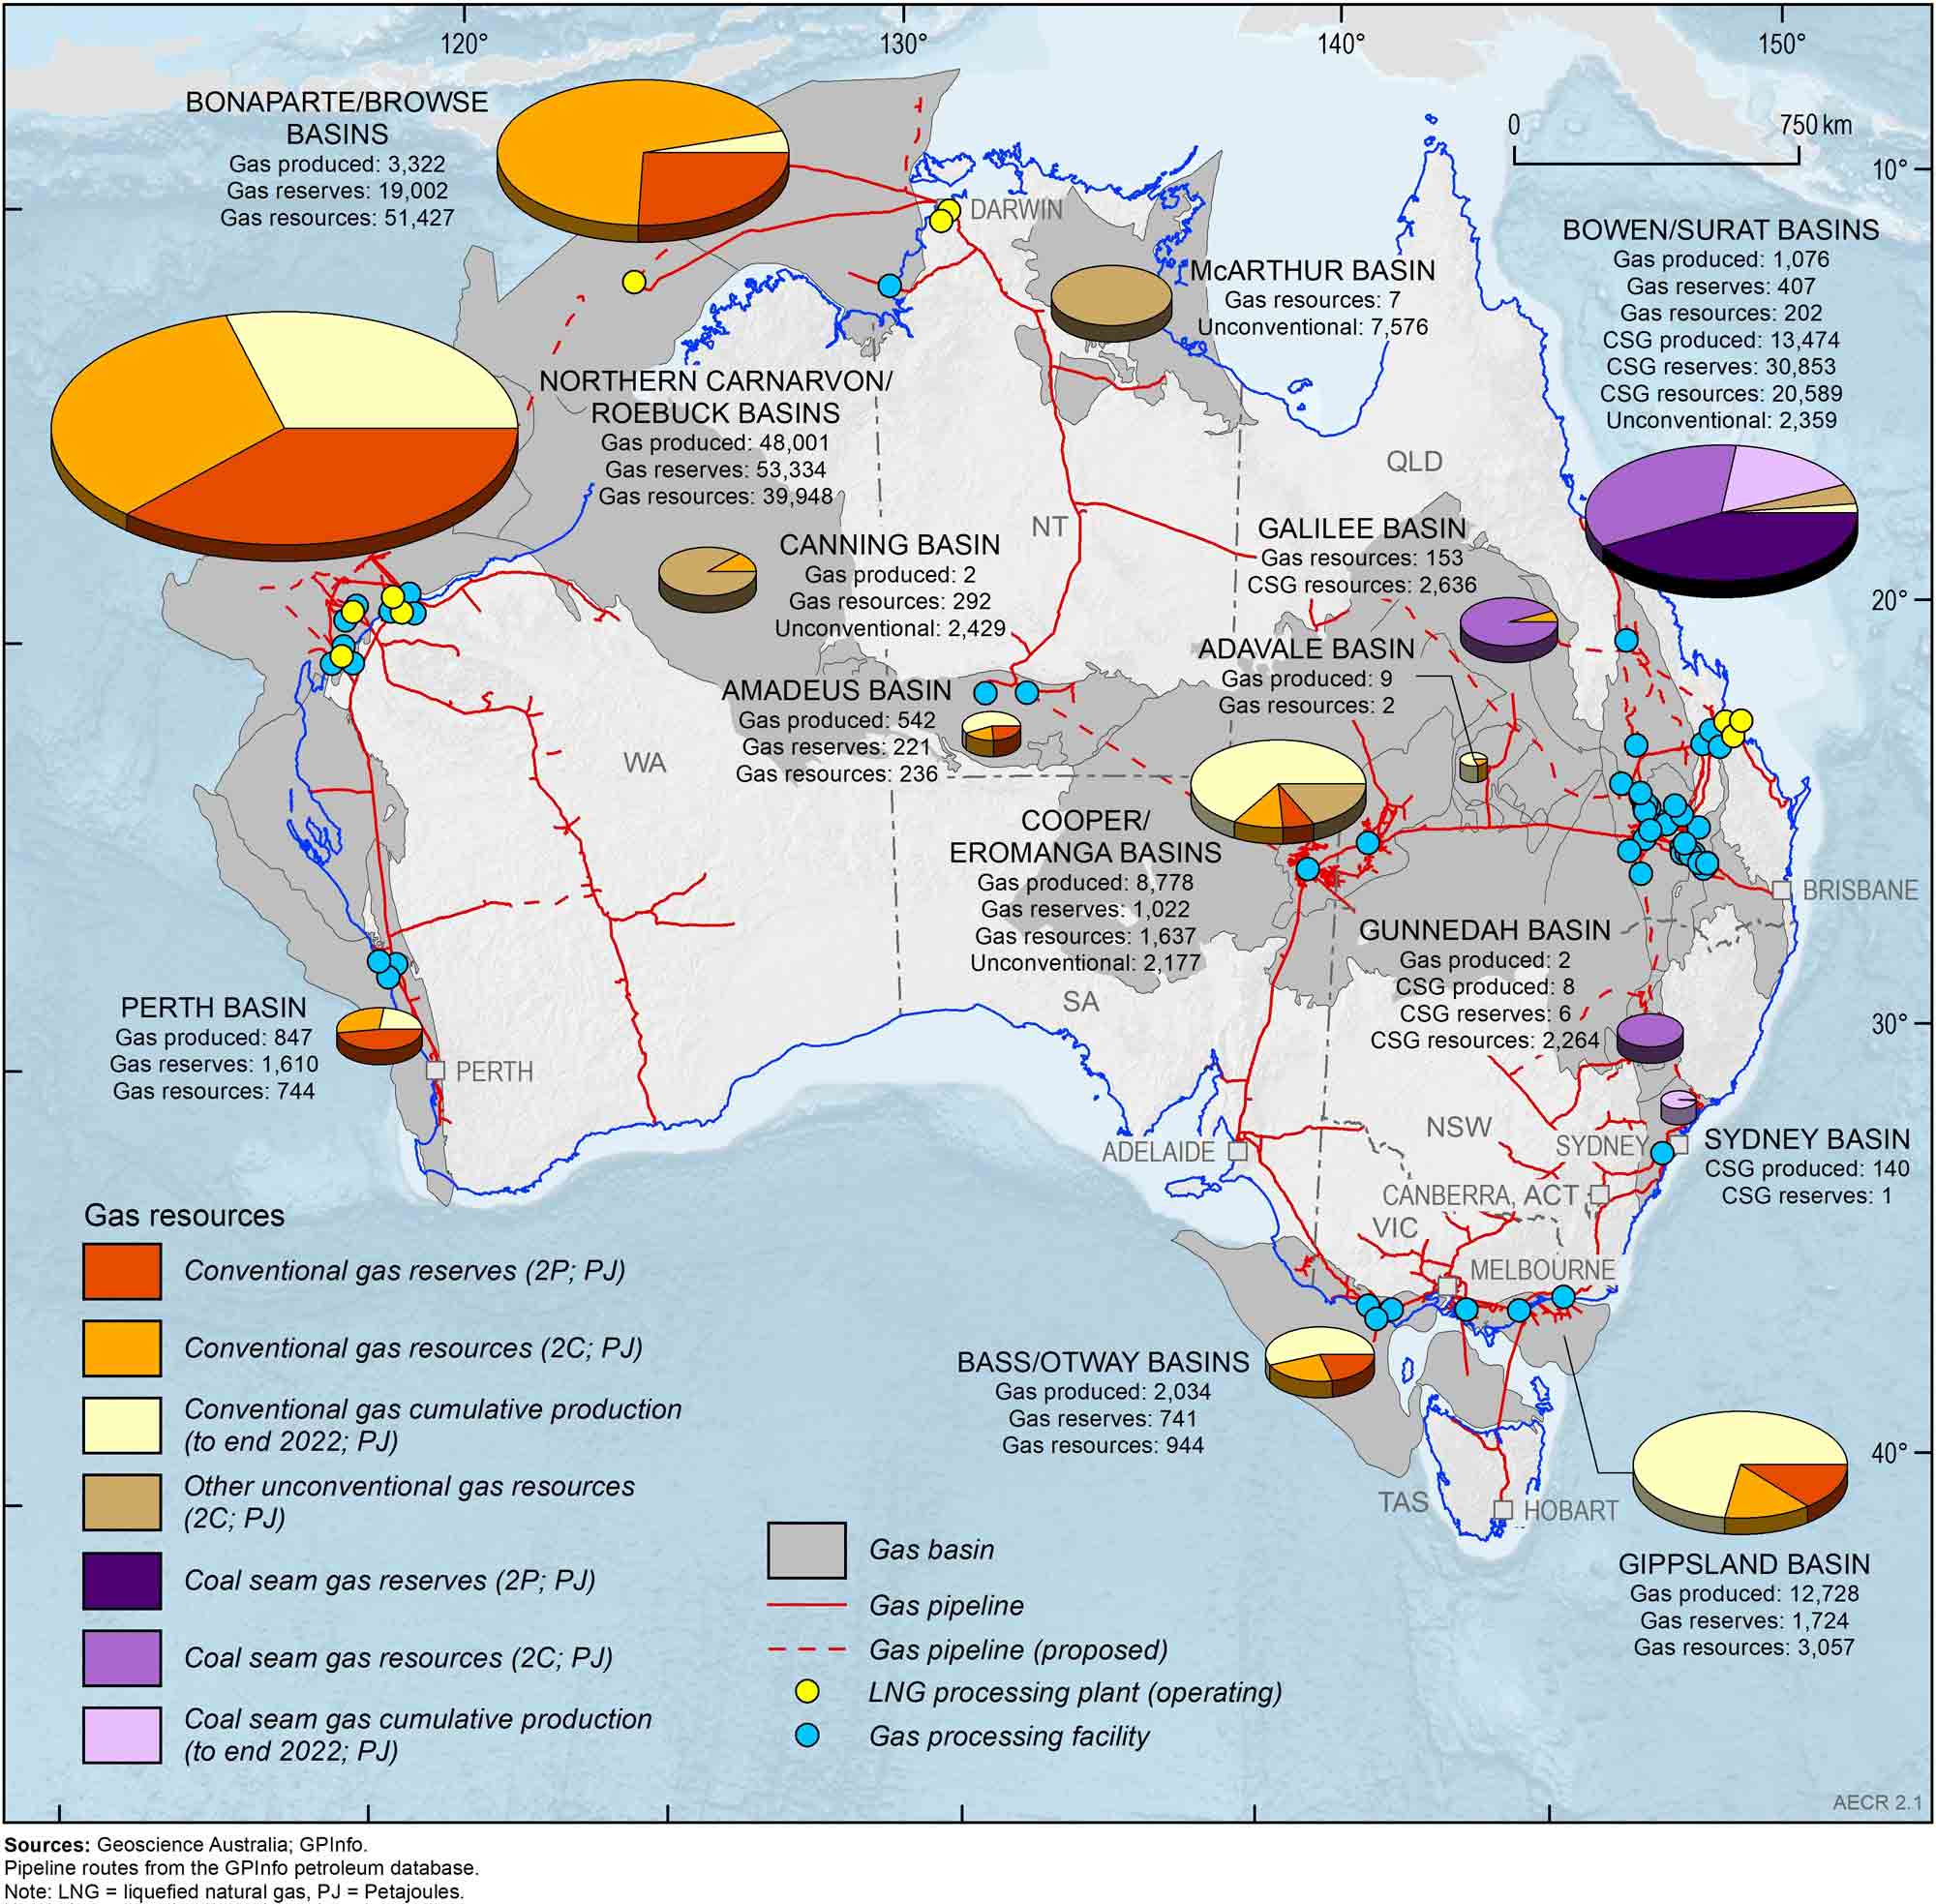
Figure 2.1. Australia’s remaining gas reserves (2P) and contingent resources (2C) during 2022 and cumulative production to end 2022 (PJ). For physical units (Tcf) refer to Table 2.1, Table 2.2 and Table 2.3.
Offshore data provided by NOPTA to year-end 2022; onshore data are sourced from government statistics and company estimates reported at various dates between June 2022 and June 2023.
Australia’s identified gas resources
Australia’s identified gas resources
The majority of the remaining identified conventional gas resources occur in basins on Australia’s North West Shelf, while onshore basins in Queensland hold the greatest quantity of identified remaining coal seam gas resources. Other unconventional gas resources are located in onshore basins in the Northern Territory, Western Australia and Queensland (Figure 2.1, Table 2.1, Table 2.2, Table 2.3, Table 2.4).
Identified resources are those that have been discovered and their locations, quantity and quality are known from measurements or direct geological evidence, such as samples and data collected through drilling. Identified gas resources, for the purposes of this report, are the equivalent of discovered 2P reserves and 2C contingent resources in the SPE-Petroleum Resources Management System. Prospective Resources are estimates of potentially recoverable quantities of hydrocarbons from undiscovered accumulations, referred to as prospects, assuming that a discovery will be made and the resource developed. Due to their nature, it is not possible to provide an accurate aggregation of all Australia’s prospective gas resources (refer to Appendix A.5 for further details of published prospective resource estimates accessed by Geoscience Australia). Further information on energy resource estimates and terminology is available in Box 1.1 in the Overview and Appendix A.3 Resource classification.
The 2022 resource estimates compiled for this report are based on publicly available onshore data aggregated with confidential offshore data submitted under the Offshore Petroleum and Greenhouse Gas Storage Act (OPGGSA) 2006 to the National Offshore Petroleum Titles Administrator (NOPTA). Offshore data are reported for calendar year 2022, while onshore data are based on government statistics and company estimates reported at various dates between June 2022 and June 2023. Where necessary, the data has been aggregated for composite basin regions to de-identify commercial-in-confidence offshore field data in the custody of NOPTA. A bibliography of all open file data sources for onshore reserves, resources and production data is available at the end of the chapter.
Australia’s estimated conventional gas resources in 2022 include 78,061 PJ (69.41 Tcf) of 2P reserves, accounting for nearly three-quarters of Australia’s total remaining 2P gas reserves, and 98,649 PJ (87.71Tcf) of 2C contingent resources. Aggregating Australia’s 2P reserves and 2C contingent resources provides a total of 176,710 PJ (157.12 Tcf) of identified conventional gas resources—a decrease of 5,246 PJ (4.66 Tcf; 6.3%) from 2021. The decrease can be attributed to the rate of reserve replacement being lower than the rate of production, and the write-down of reserves in particular basins (Perth, Bass/Otway and Northern Carnarvon/Roebuck basins). About 93% of identified conventional gas resources are located offshore along the North West Shelf of Australia. Based on 2022 production rates of 4,800 PJ (4.27 Tcf), the estimated life for Australia’s reported conventional gas reserves is 16 years.
Table 2.1. Australia's remaining conventional gas reserves (2P), contingent resources (2C) and annual production during 2022, and cumulative production to end 2022.
| Basin | Conventional gas | |||||||
|---|---|---|---|---|---|---|---|---|
| Annual Production | Cumulative Production | Reserves (2P) | Resources (2C) | |||||
| PJ | Tcf | PJ | Tcf | PJ | Tcf | PJ | Tcf | |
| Amadeus | 15 | 0.01 | 542 | 0.48 | 221 | 0.20 | 236 | 0.21 |
| Bass/Otway | 58 | 0.05 | 2,034 | 1.81 | 741 | 0.66 | 944 | 0.84 |
| Bonaparte/Browse | 676 | 0.60 | 3,322 | 2.95 | 19,002 | 16.90 | 51,427 | 45.73 |
| Bowen/Surat | 12 | 0.01 | 1,076 | 0.95 | 407 | 0.36 | 202 | 0.18 |
| Canning | 0 | 0 | 2 | <0.001 | 0 | 0 | 292 | 0.26 |
|
Northern Carnarvon/ Roebuck | 3,546 | 3.15 | 48,001 | 42.68 | 53,334 | 47.42 | 39,948 | 35.52 |
| Cooper/Eromanga | 92 | 0.08 | 8,778 | 7.81 | 1,022 | 0.91 | 1,637 | 1.46 |
| Galilee | 0 | 0 | 0 | 0 | 0 | 0 | 153 | 0.14 |
| Gippsland | 384 | 0.34 | 12,728 | 11.32 | 1,724 | 1.53 | 3,057 | 2.72 |
| Gunnedah | 0 | 0 | 2 | 0.001 | 0 | 0 | 0 | 0 |
| McArthur | 0 | 0 | 0 | 0 | 0 | 0 | 7 | 0.01 |
| Perth | 17 | 0 | 847 | 0.75 | 1,610 | 1.43 | 744 | 0.66 |
| Total | 4,800 | 4.27 | 77,341 | 68.75 | 78,061 | 69.41 | 98,649 | 87.71 |
Abbreviations
PJ= Petajoules. Tcf=Trillion cubic feet.
Notes
Data from the former Joint Petroleum Development Area (JPDA) have been omitted from Bonaparte Basin totals. Data Sources: Offshore data provided by NOPTA to year-end 2022; onshore data are sourced from government statistics and company estimates reported at various dates between June 2022 and June 2023.
Coal seam gas is expected to remain Australia’s most important unconventional gas resource in the near term, making up around three-quarters of identified unconventional gas resources. CSG is already a major source for domestic gas and LNG exports in eastern Australia. Almost all reported CSG reserves and contingent resources are located in Queensland; the remainder are in New South Wales (Figure 2.1; Table 2.2).
In 2022, Australia’s estimated proven and probable (2P) reserves for CSG total 30,859 PJ (27.44 Tcf), and 25,489 PJ (22.66 Tcf) of 2C contingent CSG resources. Coal seam gas reserves (2P) increased by 1,107 PJ (0.98 Tcf; 3.7%) during 2022, following upgrades in the Bowen and Surat basins, and now account for over one-quarter of the Australia’s remaining reserves. Aggregating Australia’s 2P reserves and 2C contingent resources provides a total estimate of 56,348 PJ (50.1 Tcf) of CSG identified resources. Based on 2022 production rates (1,562 PJ; 1.39 Tcf), Australia’s CSG reserves have an estimated life of 20 years, while identified resources are estimated to support potentially 36 years of production assuming all conditions, or contingencies, relating to their development can be satisfied.
Table 2.2. Australia's remaining coal seam gas reserves (2P), contingent resources (2C) and annual production during 2022, and cumulative production to end 2022.
| Basin | Coal seam gas | |||||||
|---|---|---|---|---|---|---|---|---|
| Annual Production | Cumulative Production | Reserves (2P) | Resources (2C) | |||||
| PJ | Tcf | PJ | Tcf | PJ | Tcf | PJ | Tcf | |
| Bowen/Surat | 1,558 | 1.39 | 13,474 | 11.98 | 30,853 | 27.43 | 20,589 | 18.31 |
| Galilee | 0 | 0 | 0 | 0 | 0 | 0 | 2,636 | 2.34 |
| Gunnedah | 1 | 0.001 | 8 | 0.01 | 6 | 0.01 | 2,264 | 2.01 |
| Sydney | 3 | 0.002 | 140 | 0.13 | 1 | <0.001 | 0 | 0 |
| Total | 1,562 | 1.39 | 13,622 | 12.12 | 30,859 | 27.44 | 25,489 | 22.66 |
Abbreviations
PJ= Petajoules. Tcf = Trillion cubic feet.
Notes
Sources: Data are sourced from government statistics and company estimates reported at various dates between June 2022 and June 2023, with additional data for the Sydney and Gunnedah basins sourced from EnergyQuest (2023).
The observation of declining reserves is consistent with record levels of gas production paired with declining exploration activity in recent years. The decline in exploration is driven by a range of factors (DISR, 2024) and evidenced by dwindling investment in petroleum exploration—expenditure down 75% in the last decade (ABS, 2024)—including decreased exploration and appraisal drilling (Craig, 2024). This reduction in exploration activity has resulted in a sharp fall in the discovery of new resources this decade (Gibb et al., 2024). Noting this context, and the forecast gas supply gaps as discussed in the Australian Government’s 2024 Future Gas Strategy, appraisal of existing gas resources and further exploration in known gas provinces in the near term could play a key role in alleviating supply pressures (DISR, 2024).
Other unconventional gas resources in Australia include tight gas, shale gas, basin-centred gas and in-situ coal gasification resources. Tight gas and shale gas occur in reservoirs with low or no permeability, which require hydraulic stimulation for gas production. Basin-centred gas occurs in abnormally pressured, gas-saturated, low-permeability stacked reservoirs within thick sedimentary successions. In-situ coal gasification refers to gas being extracted from coal seams by in-situ heating to produce synthesis (syn) gas.
Unconventional contingent gas reserves for Australia, other than coal seam gas, are reported from an in-situ coal gasification demonstration plant at Leigh Creek in South Australia (NeuRizer Ltd, 2023). The total 2P reported reserves of syngas for the Leigh Creek Energy Project in the Telford Basin are 1,153 PJ (1.03 Tcf; Table 2.4). This project has been submitted to obtain regulatory approvals under the Environment Protection and Biodiversity Conservation Act, 1999. Currently, there are no published reserves data for shale, tight or basin centred gas, reflecting the early stage of unconventional gas exploration and development in Australia.
During 2022, unconventional 2C contingent gas resources for Australia, other than coal seam gas and coal gasification, totalled 14,541 PJ (12.93 Tcf; Table 2.3). More than half (7,576 PJ; 6.74 Tcf) are represented by shale gas resources in the Beetaloo Sub-basin of the greater McArthur Basin, which are being appraised through drilling campaigns by Tamboran Resources, Empire Energy and Santos. Significant unconventional 2C contingent gas resources have also been identified in the Cooper Basin (2,177 PJ; 1.94 Tcf; Table 2.3), Canning Basin (2,429 PJ; 2.16 Tcf; Table 2.3), Bowen-Surat Basin (2,359 PJ; 2.10 Tcf; Table 3.3) and Telford Basin (1,469 PJ; 1.31 Tcf; Table 2.4).
Table 2.3. Australia's other unconventional gas reserves (2P) and contingent resources (2C) during 2022.
| Basin | Type | Unconventional Gas | Data Source | |||
|---|---|---|---|---|---|---|
| Reserves (2P) | Resources (2C) | |||||
| PJ | Tcf | PJ | Tcf | |||
| Beetaloo (Sub-basin) | Shale gas | 0 | 0 | 7,576 | 6.74 |
Empire Energy (2023); Tamboran Resources (2023) |
| Bowen/Surat |
Basin centred gas; Tight gas | 0 | 0 | 2,359 | 2.10 |
Elixir Energy Limited (2022,2023); Omega Oil & Gas Limited (2023) |
| Canning |
Basin centred gas; Tight gas | 0 | 0 | 2,429 | 2.16 |
Buru Energy (2018); Black Mountain Energy Ltd (2022) |
| Cooper/Eromanga |
Basin centred gas; Tight gas | 0 | 0 | 2,177 | 1.94 |
Pure Hydrogen (2023); Icon Energy (2022); Beach Energy (2023) |
| Total | 0 | 0 | 14,541 | 12.93 | ||
Abbreviations
PJ = petajoules; Tcf = trillion cubic feet.
Table 2.4. Australia's syngas gas reserves (2P) and contingent resources (2C) during 2022.
| Basin | Type | Unconventional Gas | Data Source | |||
|---|---|---|---|---|---|---|
| Reserves (2P) | Resources 2C) | |||||
| PJ | Tcf | PJ | Tcf | |||
| Telford* | Syngas | 1,153 | 1.03 | 1,469 | 1.31 | NeuRizer Ltd (2023) |
| Total | 1,153 | 1.03 | 1,469 | 1.31 | ||
Abbreviations
PJ = petajoules; Tcf = trillion cubic feet.
Notes
*Syngas reserves and resources in the Telford Basin are associated with the Leigh Creek Energy Project. This project is subject to approvals under the Environment Protection and Biodiversity Conservation Act, 1999, and is currently under assessment.
Production
Production
During 2022, gas production in Australia remained relatively steady at 6,362 PJ (5.7 Tcf), increasing by 3.4% (209 PJ) from 2021. Approximately three-quarters of the total gas volume was produced from conventional sources, dominantly hosted by basins of the North West Shelf (Northern Carnarvon, Browse and Bonaparte basins) which accounted for 88% (4,222 PJ; 3.75 Tcf) of conventional production to the end of 2022 (Table 2.1; Figure 2.1). The remainder of gas production was from CSG sources, totalling 1,562 PJ (1.39 Tcf) in 2022, with the Bowen and Surat basins in Queensland accounting for nearly all of this amount (Table 2.2; Figure 2.1).
Recent trends in gas production are captured by the Australian Government’s Australian Energy Statistics on a financial year basis (DCCEEW, 2023). Australian natural gas production grew by 6% to 6,076 PJ in the 2021–22 financial year (Figure 2.2) as it recovered from COVID-related reduced demand for LNG exports and production outages at the Gorgon and Prelude LNG facilities. Over the last decade, Australian natural gas production increased by an average of 10.9% per year (DCCEEW, 2023).
In 2021-22, conventional gas contributed 75% of Australian natural gas production on an energy content basis (Figure 2.3; DCCEEW, 2023). The remaining 25% of Australia’s gas was produced from CSG accumulations (Figure 2.3), representing more than 70% (1,507 PJ) of gas production in the east-coast region (DCCEEW, 2023).
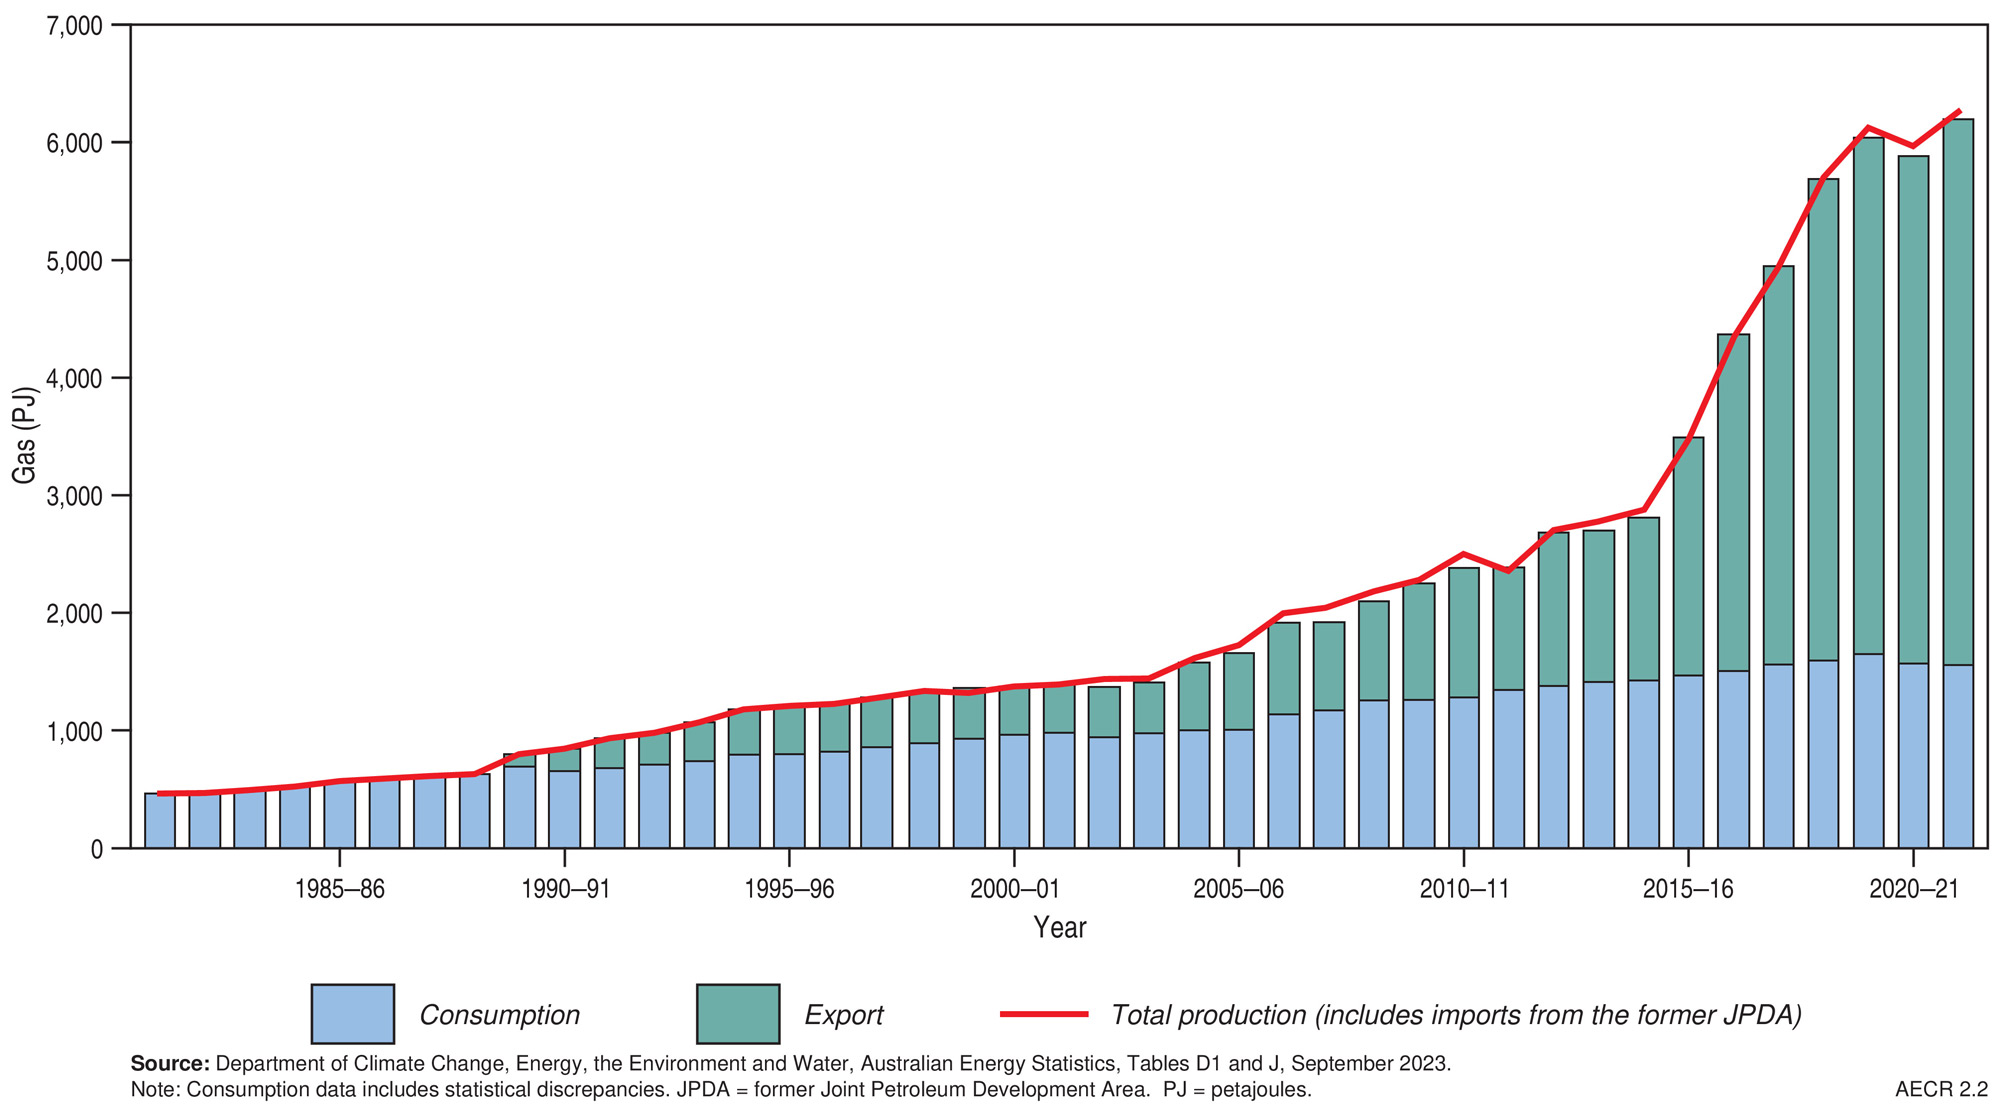
Figure 2.2. Historical trends in Australia’s gas production, consumption, and LNG exports.
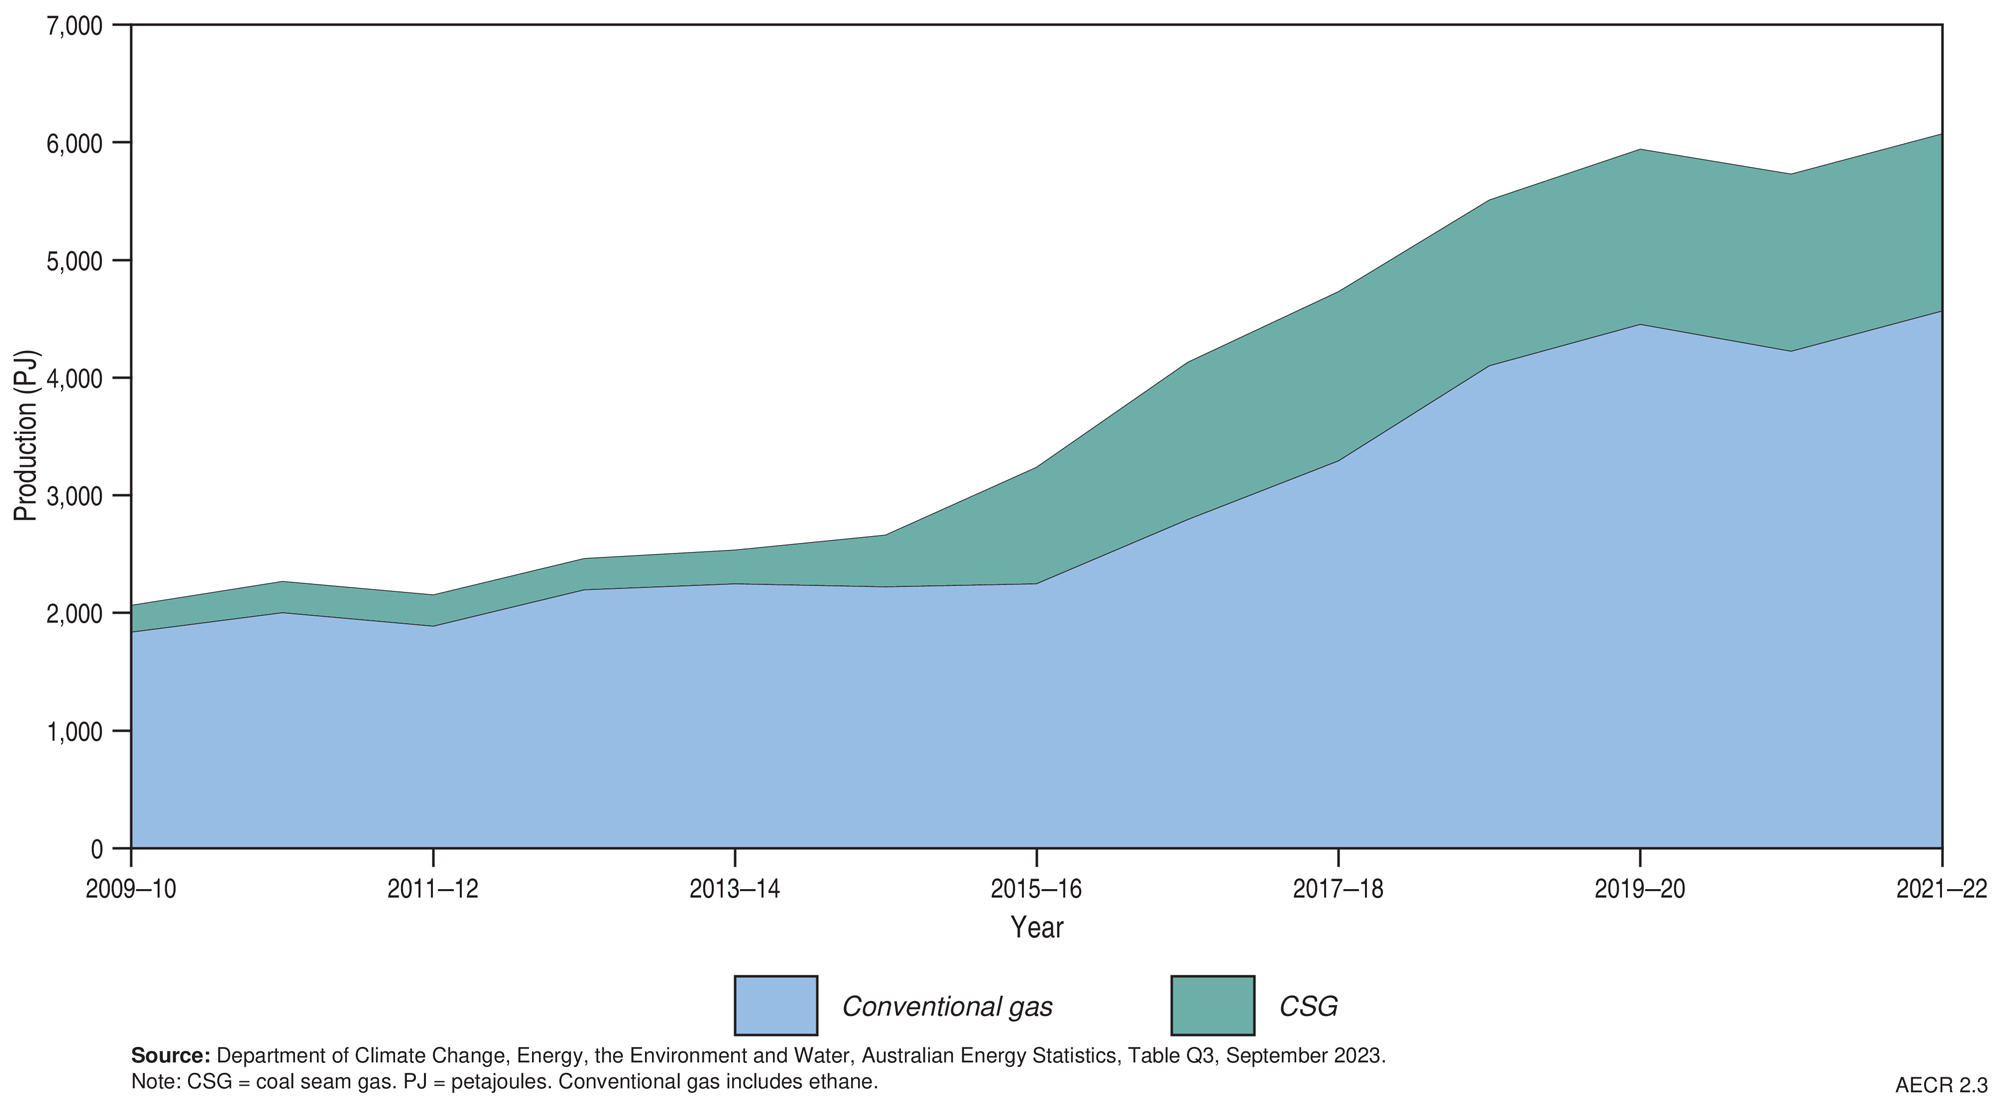
Figure 2.3. Historical trends in Australia’s gas production by type.
Trade
Trade
Australia is a substantial net exporter of natural gas, exporting about 70% of produced volumes as LNG in 2022 (Table 2.5). Over the past decade, LNG exports from Australia have increased by an average of 14% a year (Figure 2.4), with several new facilities commencing production during this period (DISR, 2024).
After peaking in 2021-22 at 4637 PJ (83.2 Mt), Australia’s LNG exports remained at record levels in 2022 with 4,427 PJ (81.4 million tonnes, Mt) exported, slightly above the 4,418 PJ (81.2 Mt) exported in 2021. This was slightly behind exports from Qatar, placing Australia as the world’s second largest LNG exporter. During this period, Australian LNG exports played a crucial role in providing supply to the tight global market, while high prices incentivised many LNG facilities to operate at or above nameplate capacity (DISR, 2022). In 2022, Australia’s LNG export earnings reached $90 billion, up 81% from 2021 (DISR, 2023).
Nearly all of Australia’s LNG exports were delivered to Asian markets in 2022-23 (Figure 2.5), with Japan accounting for 36% (equivalent to 29.0 Mt), followed by China (28%, equivalent to 22.5 Mt), the Republic of Korea (14%, equivalent to 11.6 Mt), and Taiwan (10%, equivalent to 8.5 Mt; DISR, 2023).
In 2021-22, Australia imported 152 PJ of gas from Timor Leste that was produced in the former Joint Petroleum Development Area; this gas is liquefied in Darwin and exported (DCCEEW, 2023).
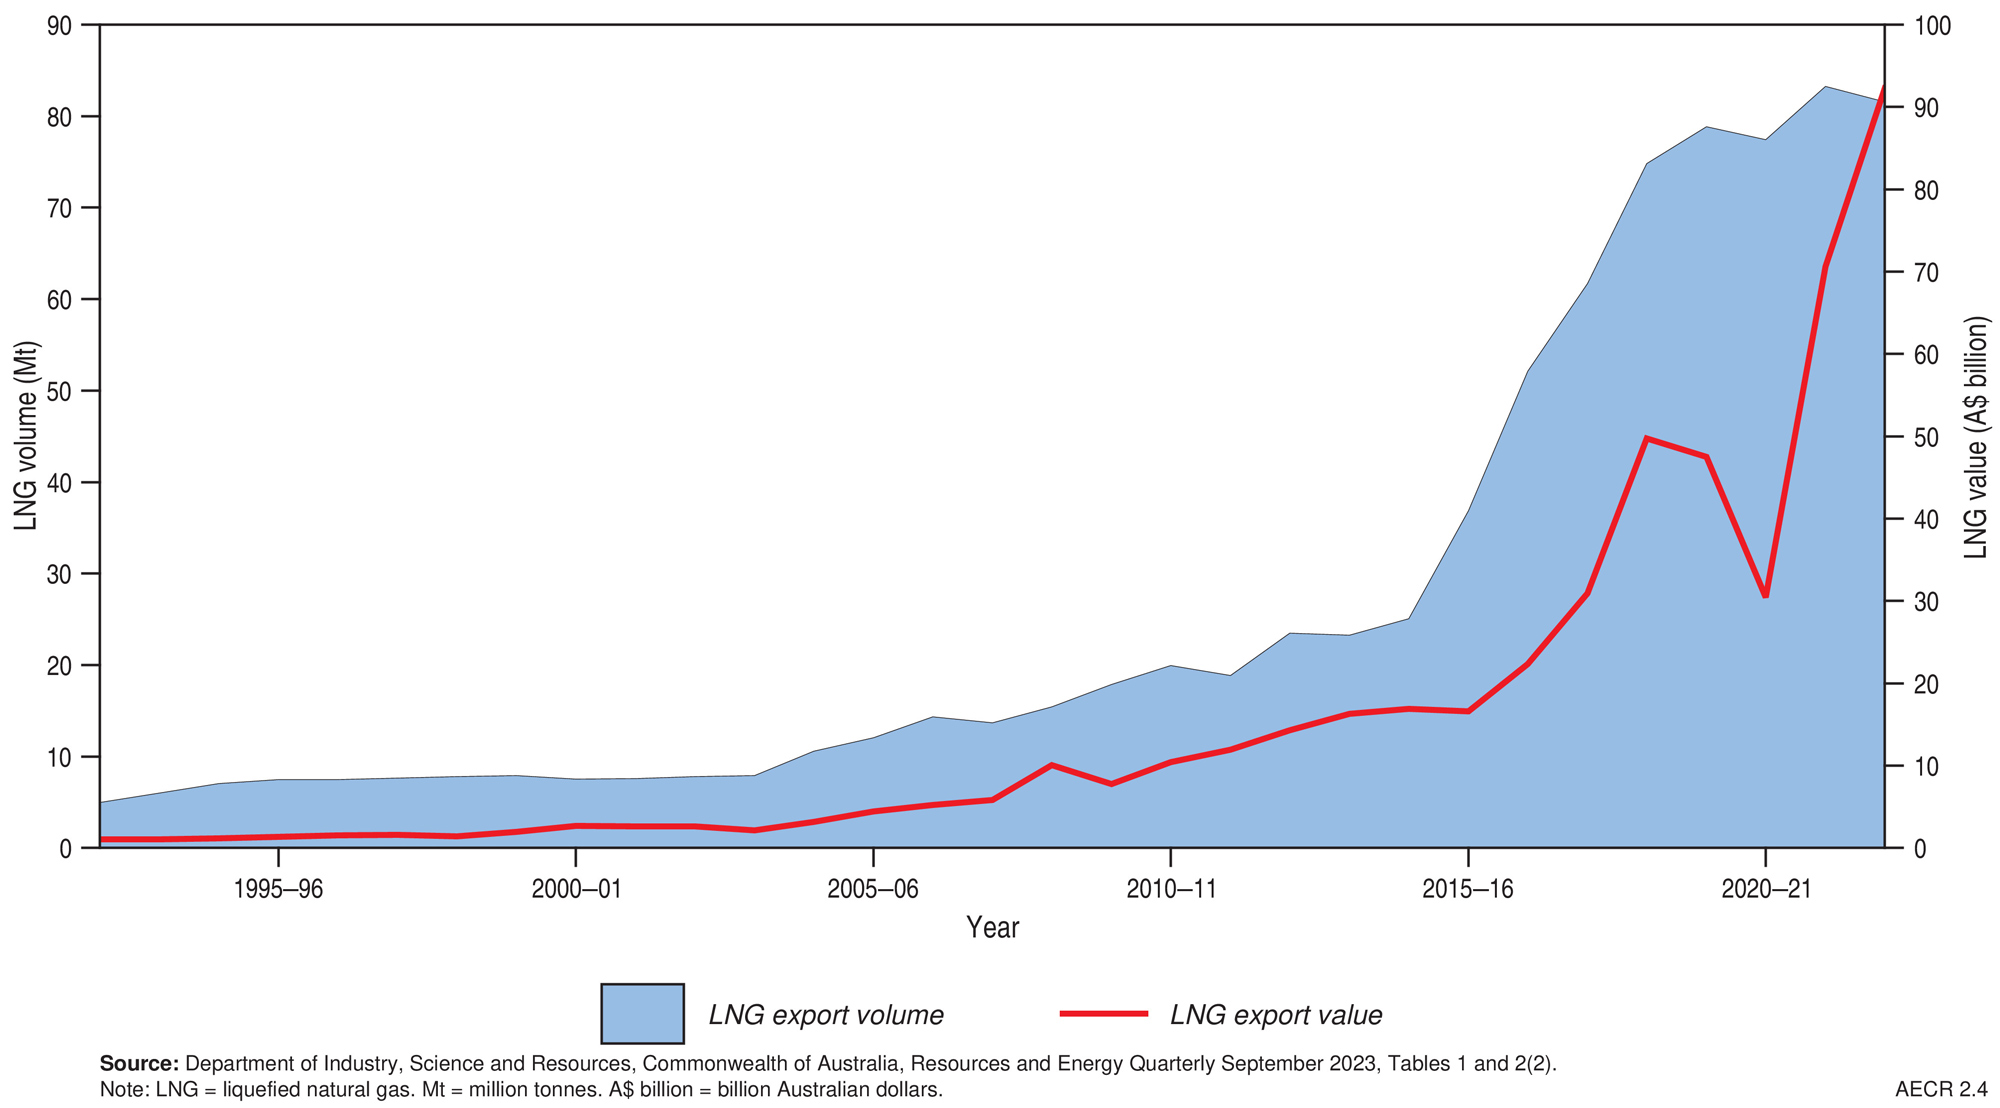
Figure 2.4. Historical trends in Australia’s LNG export volumes and values.
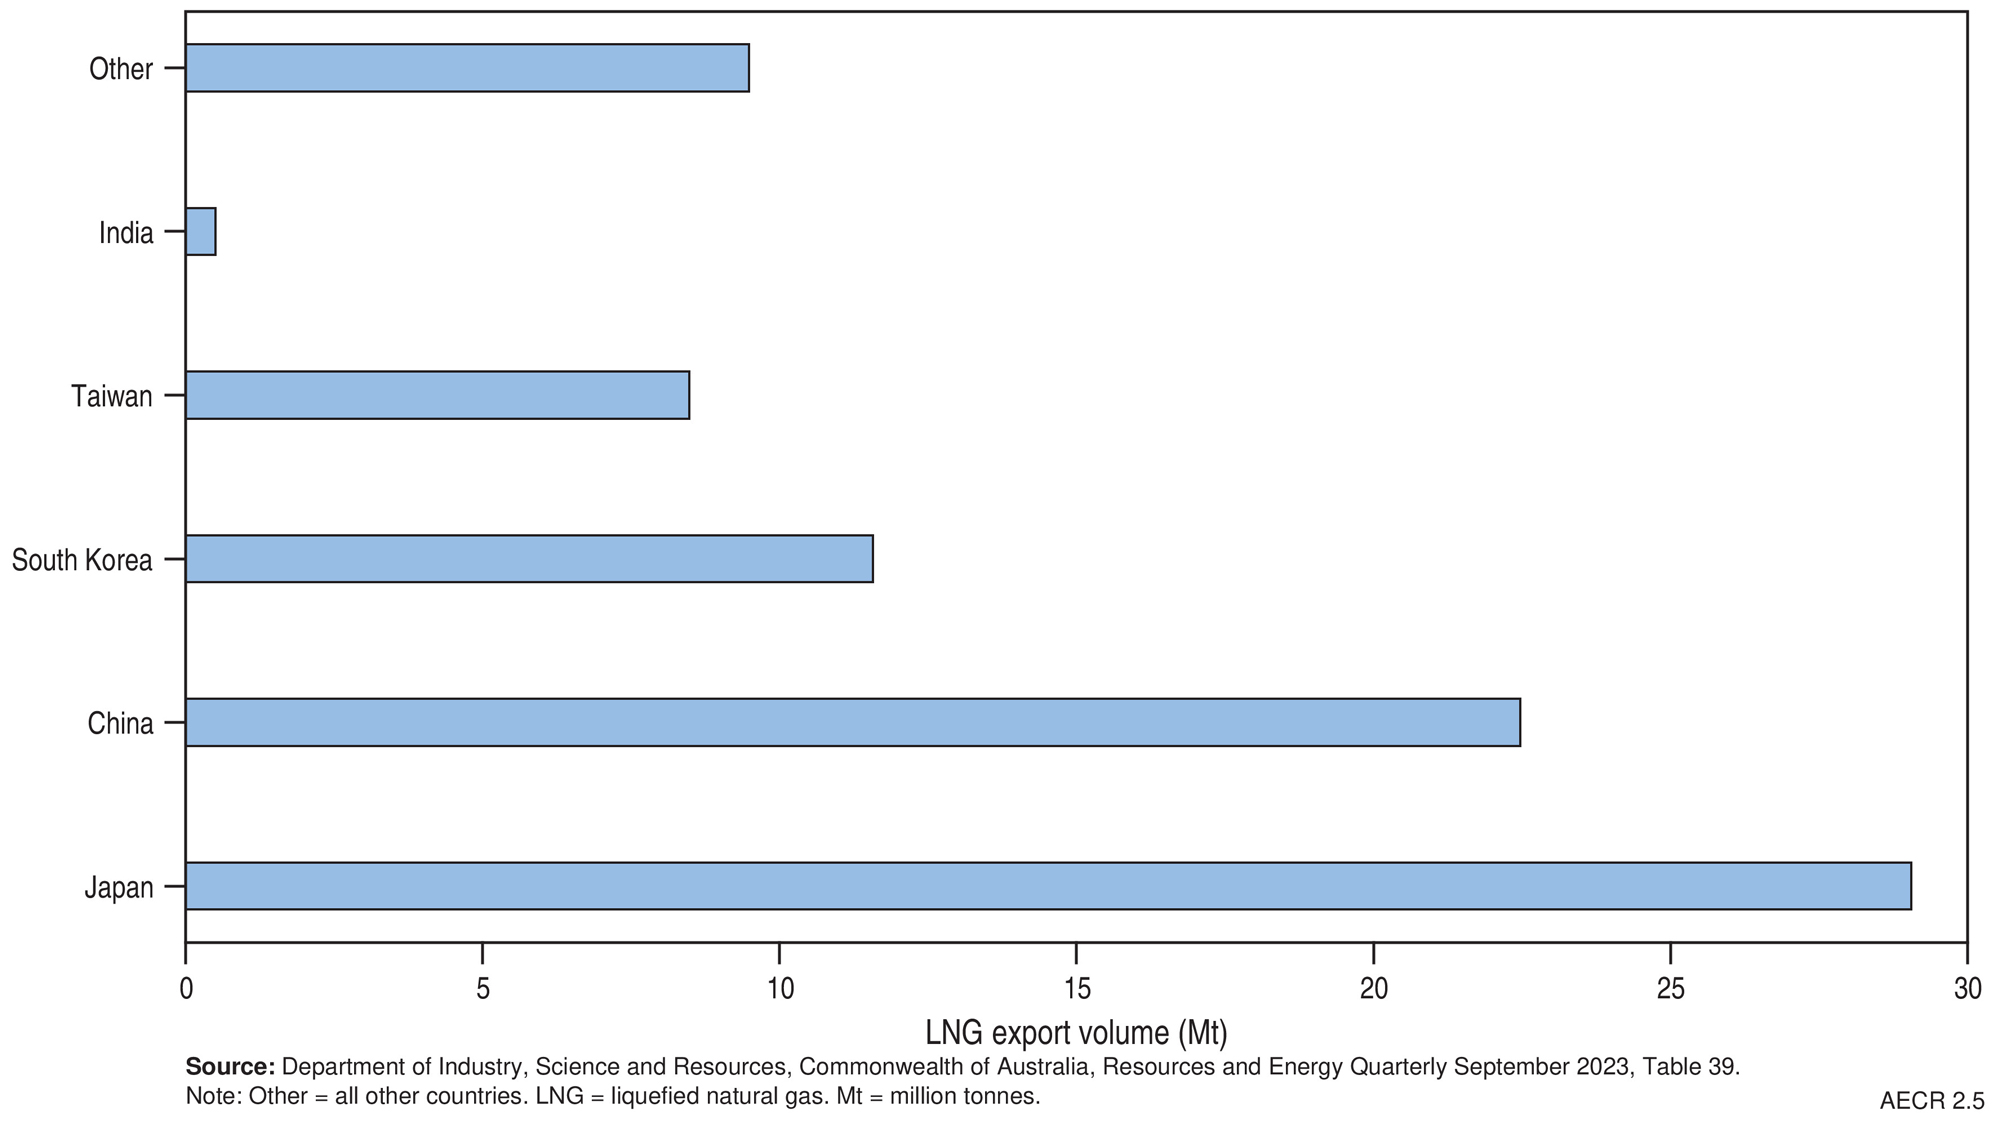
Figure 2.5. Australian LNG export volume, by key destinations, in 2022-23.
World gas resources
World gas resources
The most recent estimates of worldwide gas reserves are for 2020 (Energy Institute, 2023; Table 2.5). In 2020, Russia, Iran, and Qatar held the largest share of global reserves, accounting for approximately half of worldwide reserves. Australia’s current global ranking for gas reserves is difficult to determine due to a lack of reported proved (1P) reserves since 2014, when Australia was ranked thirteenth, holding 1.9% of the world’s gas reserves (Geoscience Australia, 2018).
World gas production was steady in 2022, totalling 145,557 PJ (143 Tcf; Energy Institute, 2023), of which about 39% came from the US and Russia (Figure 2.6). Australia ranked seventh in the world, accounting for 3.8% of total gas production during this period (Table 2.5).
Global trade of natural gas decreased by 5.1% (1.83 Tcf; ~1,861 PJ), driven by a 15.5% (2.77 Tcf; 2,823 PJ) decline in pipeline trade. In 2022, Russian pipeline supply to Europe was 3,075 PJ (3 Tcf), a decrease of 49%, while total exports were 5,959 PJ (5.85 Tcf), a decrease of 31%. Global LNG exports reached 19,526 PJ (19.15Tcf) in 2022, representing a 5.2% increase from 2021, in line with the 10-year average growth rate of 5.3%; most of this growth in LNG exports came from the US, Qatar, Malaysia, Australia and Norway (Energy Institute, 2023).
Table 2.5. Key gas statistics in 2022.
| Unit | Australia 2022 | World 2022 | |
|---|---|---|---|
| Resources | |||
| Proved Reserves (at end of year) | PJ | na | 6,767,972b |
| Tcf | na | 6,641.78b | |
|
Proved plus Probable Reserves (at end of year) | PJ | 108,920a | na |
| Tcf | 96.84a | na | |
| CAGR from 2010 | % | 10.9a | 0.4b |
| Production | |||
| Annual production | PJ | 6,362a | 145,577b |
| Tcf | 5.66a | 142.81b | |
| CAGR from 2012 | % | 10.1b | 2.0b |
| Share of world gas production | % | 3.8b | 100b |
| World ranking | no. | 7b | na |
| Exports | |||
| LNG export volume | PJ | 4,427c | 19,526b |
| Tcf | 3.94c | 19.15b | |
| CAGR from 2012 | % | 14.1c | 5.3b |
| Share of world LNG exports | % | 22.7b,c | 100b |
| World ranking | no. | 2b | na |
| LNG export value | A$b | 90.3c | na |
Abbreviations
PJ = petajoules. Tcf = trillion cubic feet. LNG = liquefied natural gas. CAGR = compound annual growth rate. A$b = billion Australian dollars. Na = not available.
Notes
Energy Institute gas reserves data are Proved Reserves while Geoscience Australia data are Proved plus Probable (2P) Reserves. World reserve data in Table 2.5 are current as of 2020, whilst world production data are current as of 2022. Sources: aGeoscience Australia; bEnergy Institute (2023) Statistical Review of World Energy; cDepartment of Industry, Science, and Resources (2024) Resources and Energy Quarterly, March 2024 (Tables 16 and 17).
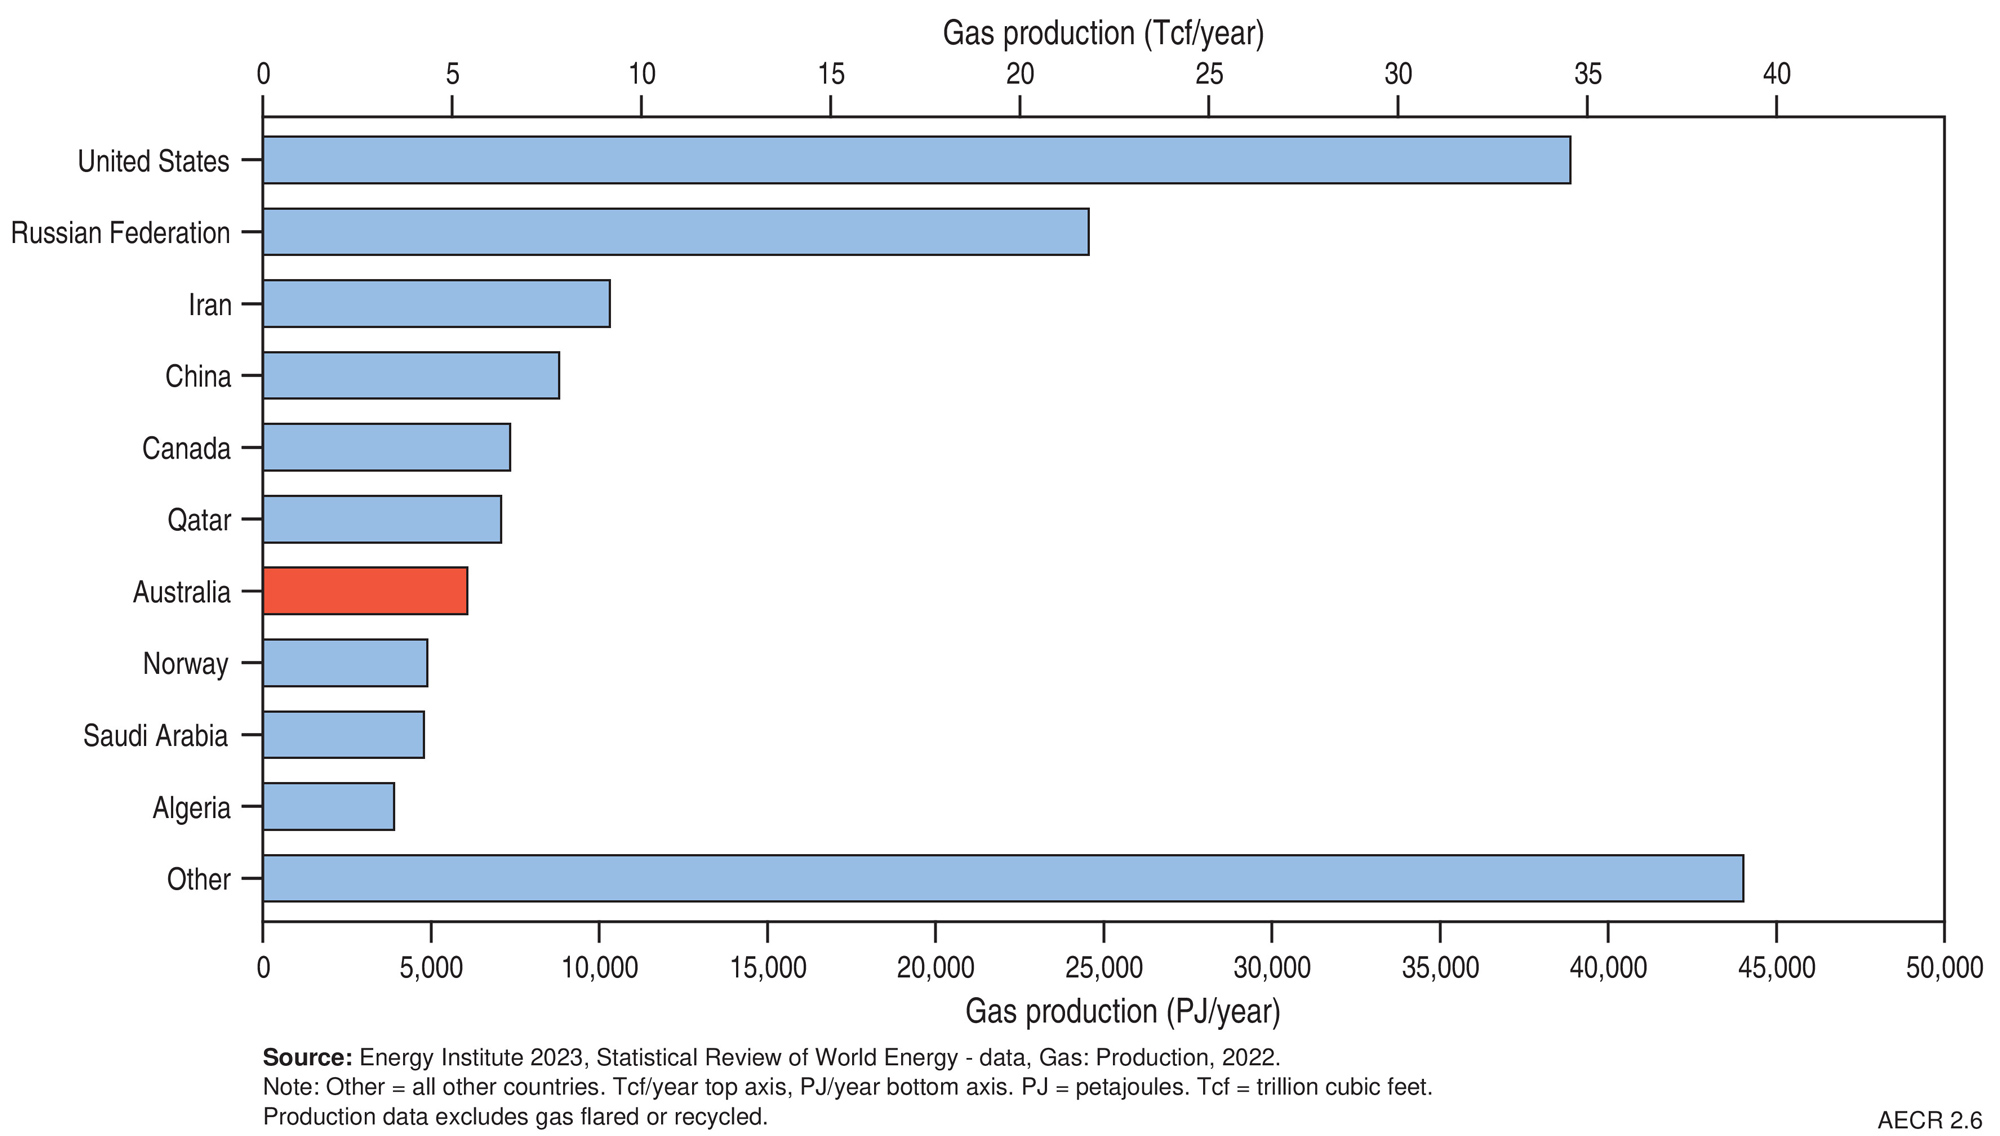
Figure 2.6. World gas production in 2022.
References
References
ABS (Australian Bureau of Statistics), 2024. Mineral and Petroleum Exploration, Australia. Quarterly statistics on mineral and petroleum expenditure by private organisations in Australia. Australian Bureau of Statistics December 2023.
Craig A., 2024. 2023 Exploration and appraisal year in review. Australian Energy Producers Journal 64(S1), S1–S13.
DCCEEW (Department of Climate Change, Energy, the Environment and Water), 2023. Australian Energy Update, 2023. (last accessed 22 March 2024).
DCCEEW (Department of Climate Change, Energy, the Environment and Water), 2023. Australian Energy Statistics, 2023. Tables A2, D1, F, J and Q3, September 2023 (last accessed 22 March 2024).
DISR (Department of Industry, Science and Resources), 2023a. Resources and Energy Quarterly: September 2023 (last accessed 22 March 2024).
DISR (Department of Industry, Science and Resources), 2024. Future Gas Strategy, Analytical Report. Commonwealth of Australia
Energy Institute, 2023. Statistical Review of World Energy. (last accessed 22 March 2024).
Gibb J., Rodger A., and Cullen C., 2024. Australia’s gas markets: similar problems…similar solutions? Australian Energy Producers Journal 64(S1), S556–S559.
References for onshore reserves, contingent resources and production data
Advent Energy, Limited, 2023. Bonaparte Basin (RL1), Weaber Field. (Last accessed 17 April 2024)
Armour Energy, Limited, 2023. Annual Report For the year ended 30 June 2023 (Last accessed 17 April 2024)
Bass Oil Limited, 2023. Annual Report 2023. (Last accessed 17 April 2024)
Bass Oil Limited, 2023. Reserves and Contingent Resources at 31 December 2022. (Last accessed 17 April 2024)
Beach Energy Limited, 2022. Quarterly Report for the period ended 30 June 2022. (Last accessed 17 April 2024)
Beach Energy Limited, 2023. FY23 Second Quarter Activities Report (Last accessed 17 April 2024)
Beach Energy Limited, 2023. Annual Report 2023 (Last accessed 17 April 2024)
Bengal Energy Limited, 2022. Bengal Energy Announces Independent Oil and Natural Gas Resource Report (Last accessed 17 April 2024)
Bengal Energy Limited, 2023. Annual Information Form 2023. (Last accessed 17 April 2024)
Bengal Energy Limited, 2023. Annual Report 2023. (Last accessed 17 April 2024)
Black Mountain Energy, 2021. Prospectus (Last accessed 17 April 2024)
Blue Energy Limited, 2023. 2023 Annual Report (Last accessed 17 April 2024)
Blue Energy Limited, 2023. Oct 2023 Reserves & Resource Upgrade (Last accessed 04 June 2024)
Buru Energy Limited, 2018. Independent Assessment of Resources at the Yulleroo Field 18 January 2018 (Last accessed 17 April 2024)
Buru Energy Limited, 2023. Annual Report 2022. (Last accessed 17 April 2024)
Buru Energy Limited, 2022. Rafael resources report confirms major gas potential (Last accessed 17 April 2024)
Central Petroleum Limited, 2023. 2023 Annual Report. (Last accessed 17 April 2024)
Central Petroleum Limited, 2023. Resource Estimates for Three Sub-salt Exploration Wells. (Last accessed 17 April 2024)
Comet Ridge Limited, 2022. Mahalo East Contingent Resource Certification (Last accessed 04 June 2024)
Comet Ridge Limited, 2022. Mahalo North Initial Reserves Certification (Last accessed 04 June 2024)
Comet Ridge Limited, 2023. Annual Report 2023. (Last accessed 17 April 2024)
Cooper Energy Limited, 2023. Annual Report 2023 .(Last accessed 17 April 2024)
Cooper Energy Limited, 2023. Reserves and Contingent Resources at 30 June 2023. (Last accessed 17 April 2024)
Cooper Energy Limited, 2022. Quarterly report for the three months ended 30 June 2022. (Last accessed 17 April 2024)
Cooper Energy Limited, 2023. Quarterly report for the three months ended 31 December 2022. (Last accessed 17 April 2024)
Denison Gas Limited, 2024. Reserves and resources (Last accessed 30 January 2024)
Department of Climate Change, Energy, the Environment and Water, 2023. Australian Petroleum Statistics 2022. (Last accessed 04 June 2024)
Eastern Star Gas, 2010. Annual Report 2010. (Last accessed 17 April 2024)
Elixir Energy Limited, 2022. Initial Contingent Resource Booked in Queensland. (Last accessed 17 April 2024)
Elixir Energy Limited, 2023. Good Oil Presentation, 5 September 2023. (Last accessed 17 April 2024)
Empire Energy Group Limited, 2023. Major EP187 Contingent Resources Upgrade. (Last accessed 17 April 2024)
EnergyQuest, 2023. EnergyQuarterly March 2023. EnergyQuest.
Galilee Energy Limited, 2023. Annual Report 2023. (Last accessed 17 April 2024)
GB Energy, 2020. Annual Report 2020. (Last accessed 17 April 2024)
Geoscience Australia, 2012. Oil and Gas Resources of Australia, 2010. (Last accessed 17 April 2024)
Icon Energy Limited, 2015. Quarterly Activities Report 31-Jul-2015 (Last accessed 17 April 2024)
Icon Energy Limited, 2022. 2022 Annual Report (Last accessed 17 April 2024)
Lakes Blue Energy NL, 2023. Annual Report for the year ended 30 June 2023. (Last accessed 17 April 2024)
Metgasco Ltd, 2023. 2023 Annual Report (Last accessed 03 June 2023)
NeuRizer Ltd (formerly Leigh Creek Energy Limited), 2023. Annual Report 2023 (Last accessed 17 April 2024)
New Hope Corporation, 2022. Bridgeport Energy Limited - 2022 Petroleum Reserves and Contingent Resources statement (Last accessed 17 April 2024)
New Hope Corporation, 2023. Bridgeport Energy Limited - 2023 Petroleum Reserves and Contingent Resources statement (Last accessed 17 April 2024)
Northern Territory Department of Industry, Tourism and Trade, 2023. NT onshore oil and gas production data (Last accessed 17 April 2024)
Northern Territory Geological Survey (NTGS), 2023. NT Resourcing The Territory Shale Gas and Liquids Factsheet April 2023 (Last accessed 17 April 2024)
Northern Territory Geological Survey (NTGS), 2023. NT Resourcing The Territory Conventional Oil and Gas Factsheet April 2023 (Last accessed 17 April 2024)
Omega Oil & Gas Limited, 2022. Prospectus. (Last accessed 17 April 2024)
Omega Oil & Gas Limited, 2023. Maiden Gross Contingent Gas Resource of 1.73 TCF across
ATPs 2037 and 2038. (Last accessed 17 April 2024)
Origin Energy Limited, 2023. 2023 Annual Report. (Last accessed 05 June 2024)
Pilot Energy, 2023. Annual Report 2023. (Last accessed 17 April 2024)
Pure Hydrogen Corporation Limited, 2023. Annual Report 2023. (Last accessed 17 April 2024)
Queensland Government, Department of Resources, 2024. Petroleum and gas production and reserve statistics. (Last accessed 17 April 2024)
Red Sky Energy Limited, 2022. Killanoola Project Initial Oil in Place Report (Last accessed 17 April 2024)
Red Sky Energy Limited, 2023. Presentation to Good Oil Conference (Last accessed 17 April 2024)
Santos Limited, 2023. 2022 Fourth Quarter Report Data Tables (Last accessed 17 April 2024)
Santos Limited, 2023. Annual Report 2022 (Last accessed 17 April 2024)
State Gas Limited 2023, Annual Report 2023 (Last accessed 05 June 2023)
Strike Energy Limited, 2022. Independent certification of Ocean Hill gas resource (Last accessed 17 April 2024)
Strike Energy Limited, 2022. Independent certification of Walyering reserves (Last accessed 17 April 2024)
Strike Energy Limited, 2022. Independent certification of South Erregulla Kingia gas discovery (last accessed 17 April 2024)
Strike Energy Limited, 2022. Independent certification of South Erregulla Wagina gas discovery (last accessed 17 April 2024)
Tamboran Resources Limited, 2023. 2023 Annual Report (Last accessed 17 April 2024)
Tamboran Resources Limited, 2023. Tamboran increase Beetaloo Basin 2C gas resources to 2.1 TCF (Last accessed 17 April 2024)
Victoria Department of Energy, Environment and Climate Action, 2023. Earth Resources Regulator Annual Statistical Report FY2022-23 (Last accessed 17 April 2024)
Vintage Energy Ltd, 2023. Annual Report 2023 (Last accessed 17 April 2024)
Woodside Energy Group Ltd, 2023. Annual Report 2022 (Last accessed 05 June 2024)
Data download
Data download
Australia's Energy Commodity Resources Data Tables - 2022 reporting period