Australia's Energy Commodity Resources 2024 Oil
Page last updated:15 July 2024
Oil
Summary statistics for oil, 2022.
|
TDR 100,174 PJ ( 5.6%) | |
|
Reserves (2P) 8,045 PJ ( 6.1%) |
|
Production 687 PJ ( 7.0%) | |
|
Export Income $14.9 b ( 40.7%) |
|
Production World Ranking 30 (0.4%) | |
|
Export World Ranking 26 (0.5%) |
Abbreviations:
TDR = Total demonstrated resources (reserves and contingent resources); PJ = petajoules. Percentage increases or decreases are in relation to 2021. World rankings are followed by percentage share in brackets.
Key messages
Key messages
- In this report ‘Oil’ refers to any hydrocarbon liquids, including conventional crude oil, condensate and liquefied petroleum gas (LPG), and unconventional resources including shale oil, oil shales, coal oil, tight oil and the natural gas liquid component of basin centred gas resources.
- Australia has limited identified conventional oil resources which are being depleted at a faster rate than they are being replaced by new discoveries.
- In 2022, Australia imported about 83% of its oil requirements.
- In 2021-22 Australia produced 891 petajoules (PJ; 152 million barrels, MMbbl) of crude oil, condensate, and LPG, of which over 85% was exported. Australia’s domestic crude oil production continues to decline rapidly, and without new commercial discoveries, production is projected to cease within the next 6 years.
- In 2022, around 80% of all oil production was from offshore fields on Australia’s North West Shelf (Northern Carnarvon and Browse/Bonaparte basins). This included condensate produced from a few large gas fields on the North West Shelf.
- In 2022, Australia’s conventional oil resources are estimated as 8,045 PJ (1,408 MMbbl) of proven and probable (2P) reserves and 12,826 PJ (2,229 MMbbl) of contingent (2C) resources. At 2022 production rates, this is equivalent to less than 12 years of remaining conventional oil reserves.
- Australia has significant undiscovered unconventional oil resources potential, including shale oil, tight oil, oil shale and basin centred natural gas liquids. Oil shale is the only unconventional oil resource that has been exploited to date. Currently, there is no commercial production of oil shale resources in Australia.
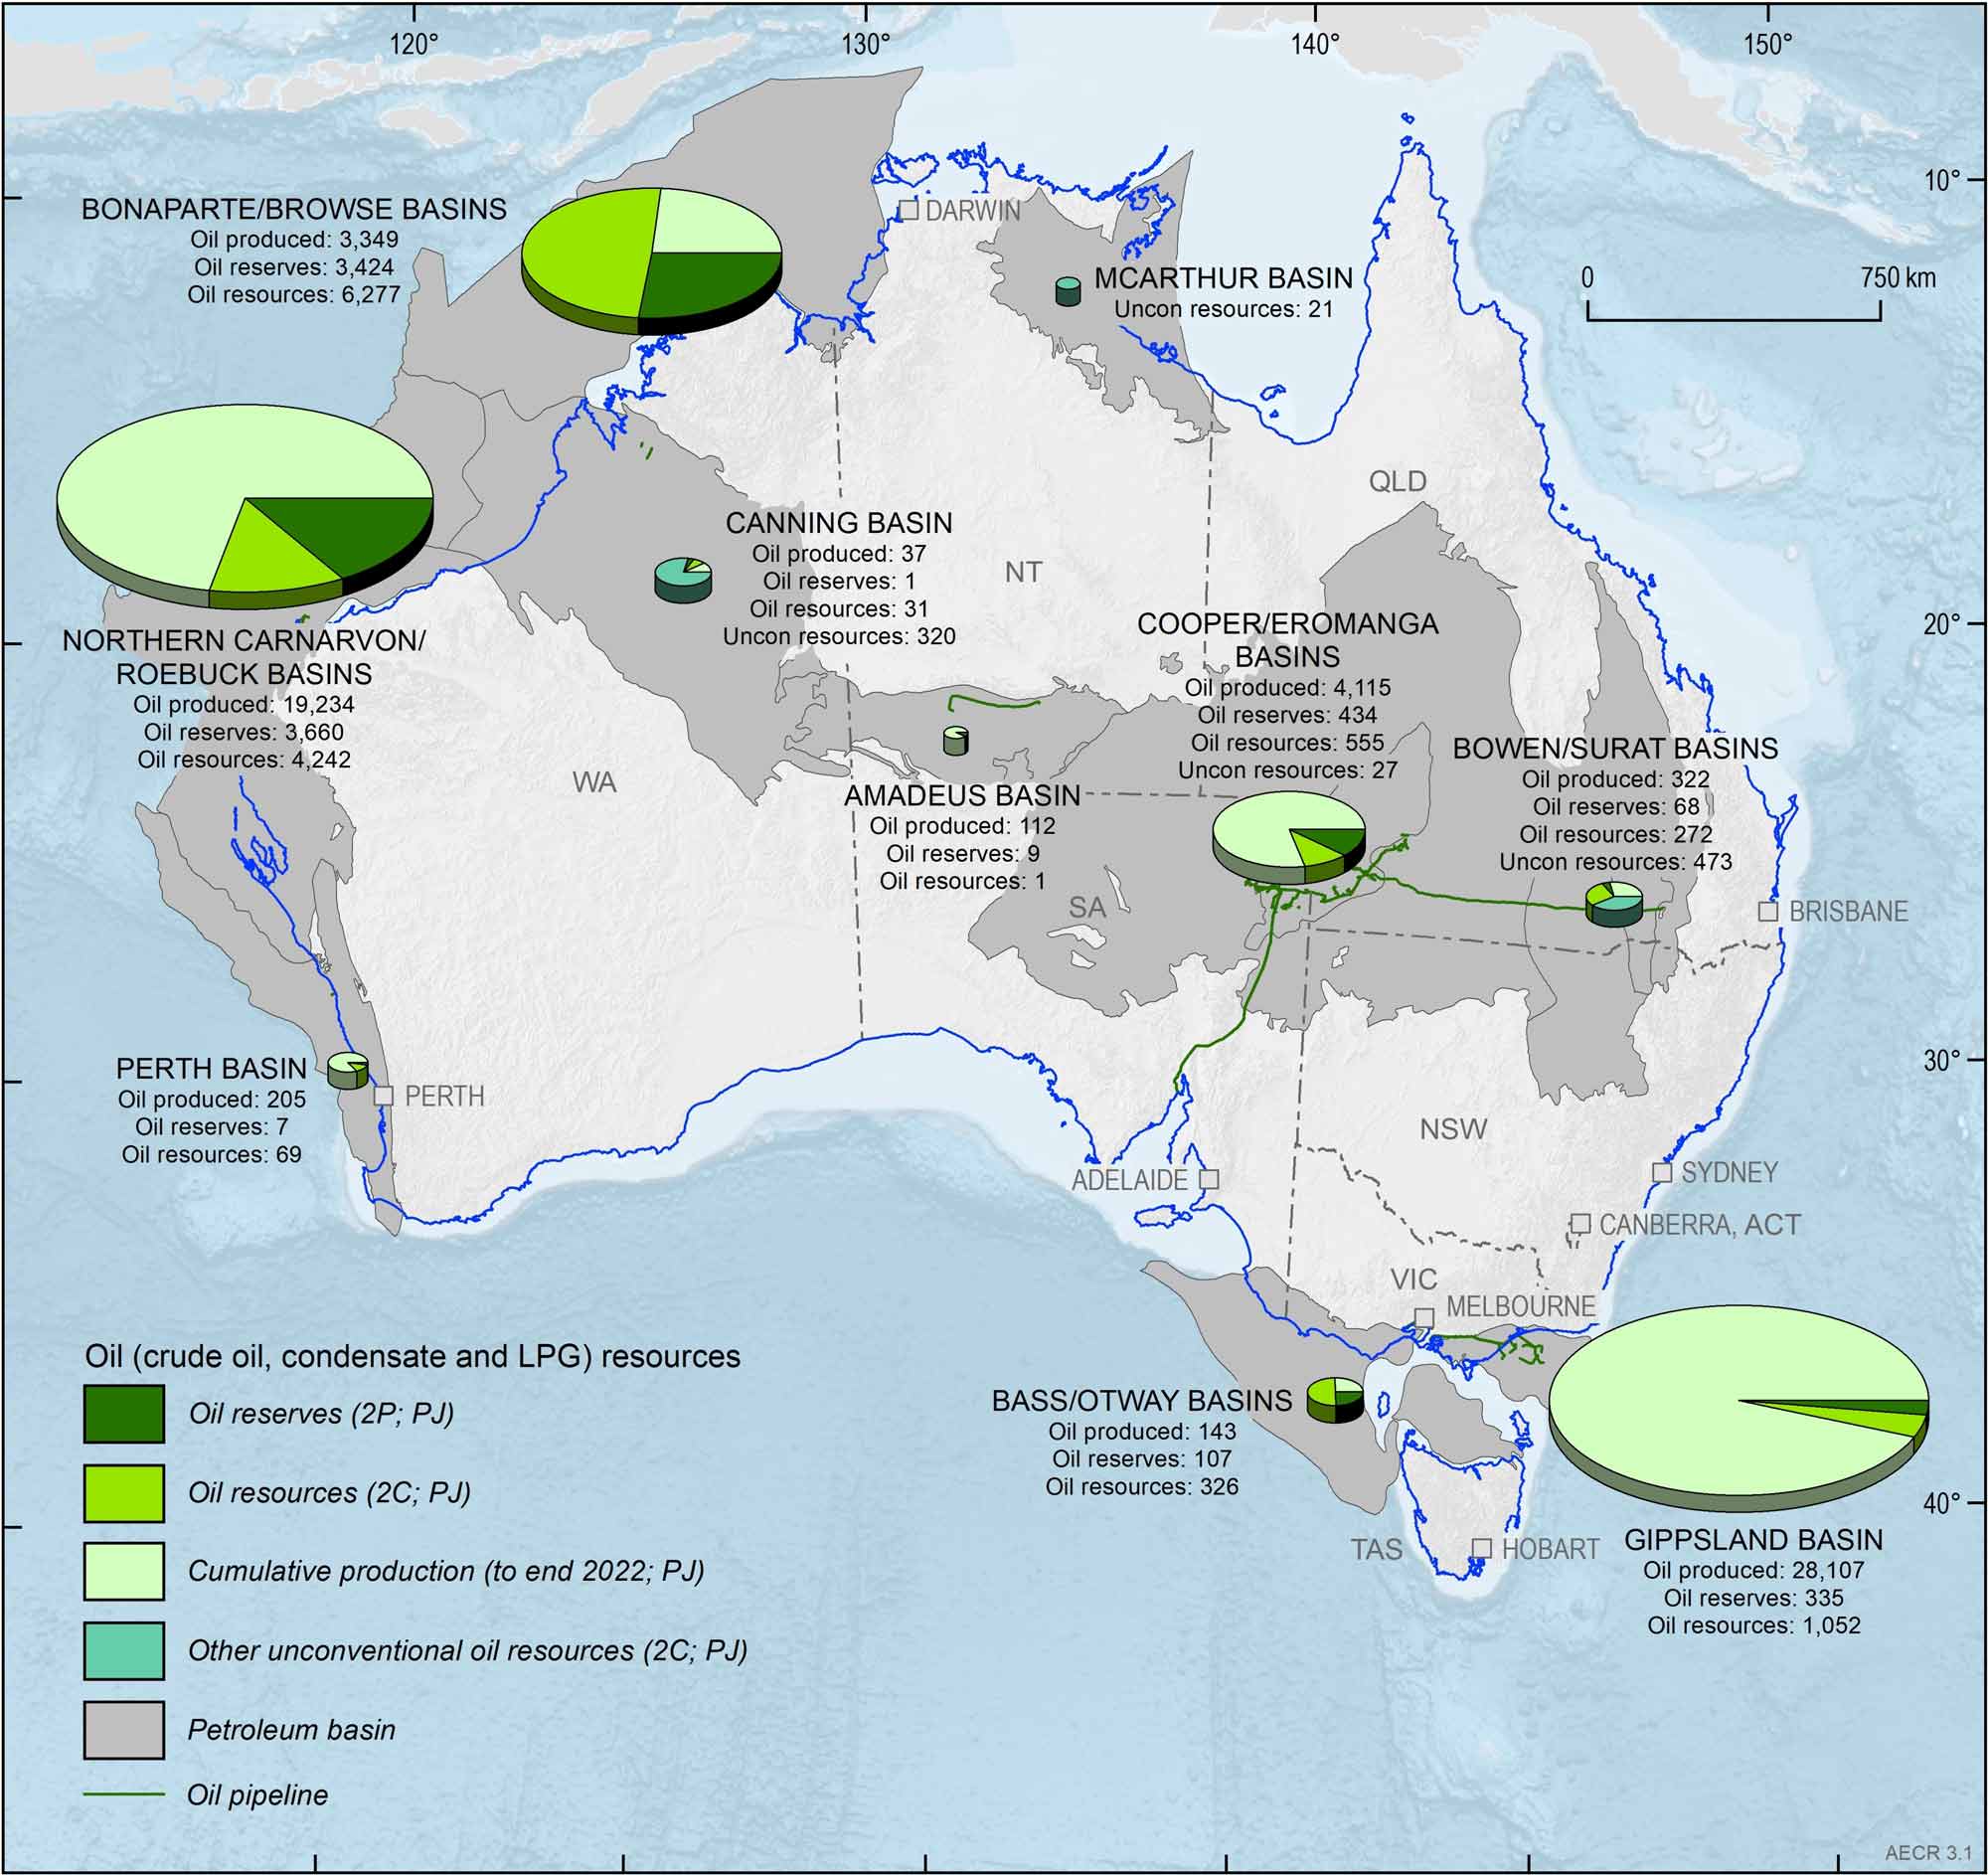
Figure 3.1. Australia’s remaining oil reserves (2P) and contingent resources (2C) during 2022 and cumulative production to end 2022 (PJ). For physical units (MMbbl) refer to Table 3.1, Table 3.2, Table 3.3 and Table 3.4. Offshore data provided by NOPTA to year-end 2022, except Browse-Bonaparte and Perth Basins which are sourced from company reports; onshore data are sourced from government statistics and company estimates reported at various dates between June 2022 and June 2023. Additional data for the Northern Carnarvon/Roebuck basin sourced from EnergyQuest (2023).
Australia’s identified oil resources
Australia’s identified oil resources
The majority of Australia’s remaining identified offshore oil resources occur in basins located in the continent’s north‑west and south‑east, with the Northern Carnarvon and Browse/Bonaparte basins holding the majority of these resources. Onshore, the Cooper–Eromanga basin in South Australia and Queensland holds the greatest quantity of identified remaining conventional oil resources (Figure 3.1; Table 3.1, Table 3.2 and Table 3.3).
Identified resources are those that have been discovered and their locations, quantity and quality are known from measurements or direct geological evidence. Identified oil resources, for the purposes of this report, are the equivalent of discovered 2P reserves and 2C contingent resources in the SPE-Petroleum Resources Management System. Prospective Resources are estimates of potentially recoverable quantities of hydrocarbons from undiscovered accumulations, referred to as prospects, assuming that a discovery is made and developed. Due to their nature, it is not possible to provide an accurate aggregation of all Australia’s prospective oil resources, (refer to Appendix A.5 for further discussion a bibliography details of published prospective resource estimates accessed by Geoscience Australia). Further information on energy resource estimates and terminology is available in Box 1.1 in the Overview and Appendix A.3 Resource classification.
The 2022 resource estimates compiled for this report are based on publicly available data for onshore areas aggregated with confidential offshore data submitted to the National Offshore Petroleum Titles Administrator (NOPTA). Offshore data are reported for the 2022 calendar year, while onshore data are based on government statistics and company estimates reported at various dates between June 2022 and June 2023. Data are aggregated for composite basin regions where necessary to de-identify confidential offshore field data in the custody of NOPTA.
Crude oil
Australia’s domestic supply of crude oil is limited, with estimated remaining 2P reserves of 1,475 PJ (251 MMbbl), and 3,316 PJ (564 MMbbl) of 2C contingent resources in 2022 (Table 3.1; Figure 3.1). This represents a 5% (244 PJ) increase in Australia’s identified crude oil resources from 2021, with reserves up 4% (58 PJ) and contingent resources up 6% (186 PJ) due to increases in the Northern Carnarvon/Roebuck basin and the Gippsland and Bowen/Surat basins, respectively. Nearly 70% (3,316 PJ) of Australia’s remaining identified crude oil resources are located in the Northern Carnarvon, Roebuck, Bonaparte and Browse basins. About 13% of Australia’s crude oil resources (632 PJ) are in the Cooper Basin, while approximately 10% (474 PJ) of remaining resources are in the Gippsland Basin. Based on 2022 production rates of 232 PJ (40 MMbbl), the remaining 2P reserves can only support 6 years of crude oil production.
Table 3.1. Australia's remaining crude oil reserves (2P), contingent resources (2C) and annual production during 2022, and cumulative production to end 2022.
| Basin | Crude oil | |||||||
|---|---|---|---|---|---|---|---|---|
| Annual Production | Cumulative Production | Reserves (2P) | Resources (2C) | |||||
| PJ | MMbbl | PJ | MMbbl | PJ | MMbbl | PJ | MMbbl | |
| Amadeus | 1 | 0 | 112 | 19 | 9 | 2 | 1 | 0 |
| Bass/Otway | 0 | 0 | 0 | 0 | 0 | 0 | 40 | 7 |
| Bonaparte/Browse | 9 | 2 | 2,709 | 461 | 109 | 19 | 350 | 59 |
| Bowen/Surat | 0 | 0 | 200 | 34 | 19 | 3 | 234 | 40 |
| Canning | 1 | 0 | 37 | 6 | 1 | 0 | 0 | 0 |
|
Northern Carnarvon/ Roebuck | 162 | 27 | 12,214 | 2,077 | 1,022 | 174 | 1,836 | 312 |
| Cooper/Eromanga | 39 | 7 | 2,455 | 418 | 296 | 50 | 336 | 57 |
| Gippsland | 19 | 3 | 22,703 | 3,861 | 15 | 3 | 459 | 78 |
| Perth | 1 | 0 | 198 | 34 | 4 | 1 | 61 | 10 |
| Total | 232 | 40 | 40,627 | 6,910 | 1,475 | 251 | 3,316 | 564 |
Abbreviations
PJ= Petajoules. Values in brackets are MMbbl, MMbbl=million barrels.
Notes
Data from the former Joint Petroleum Development Area (JPDA) have been omitted from Bonaparte Basin totals. Sources: Offshore data provided by NOPTA to year-end 2022, except Browse-Bonaparte and Perth basins sourced from company reports; onshore data are sourced from government statistics and company estimates reported at various dates between June 2022 and June 2023. Additional data for the Northern Carnarvon/Roebuck basin sourced from EnergyQuest (2023).
Condensate
Australia has significant remaining condensate resources, including 5,982 PJ (1,017 MMbbl) of 2P reserves and 8,804 PJ (1,497 MMbbl) of 2C contingent resources in 2022 (Table 3.2; Figure 3.1). The majority of identified condensate resources are in supergiant (>10 trillion cubic feet ‘Tcf’) and giant (>3 Tcf) gas fields located on the North West Shelf. Based on the 2022 annual production rate of 405 PJ (69 MMbbl), Australia’s identified condensate reserves have a life of 15 years.
Table 3.2. Australia's remaining condensate reserves (2P), contingent resources (2C) and annual production during 2022, and cumulative production to end 2022.
| Basin | Condensate | |||||||
|---|---|---|---|---|---|---|---|---|
| Annual Production | Cumulative Production | Reserves (2P) | Resources (2C) | |||||
| PJ | MMbbl | PJ | MMbbl | PJ | MMbbl | PJ | MMbbl | |
| Amadeus | 0 | 0 | 0 | 0 | 0 | 0 | 0 | 0 |
| Bass/Otway | 4 | 1 | 104 | 18 | 53 | 9 | 211 | 36 |
| Bonaparte/Browse | 148 | 25 | 640 | 109 | 3,180 | 541 | 5,773 | 982 |
| Bowen/Surat | 2 | 0 | 53 | 9 | 18 | 3 | 22 | 4 |
| Canning | 0 | 0 | 0 | 0 | 0 | 0 | 31 | 5 |
|
Northern Carnarvon/ Roebuck | 227 | 39 | 7,020 | 1,194 | 2,508 | 427 | 2,364 | 402 |
| Cooper/Eromanga | 9 | 2 | 736 | 125 | 68 | 12 | 118 | 20 |
| Gippsland | 15 | 3 | 1,700 | 289 | 152 | 26 | 277 | 47 |
| Perth | 0 | 0 | 6 | 1 | 3 | 1 | 8 | 1 |
| Total | 405 | 69 | 10,259 | 1,745 | 5,982 | 1,017 | 8,804 | 1,497 |
Abbreviations
PJ= Petajoules. Values in brackets are MMbbl, MMbbl=million barrels.
Notes
Data from the former Joint Petroleum Development Area (JPDA) have been omitted from Bonaparte Basin totals. Sources: Offshore data provided by NOPTA to year-end 2022; onshore data are sourced from government statistics and company estimates reported at various dates between June 2022 and June 2023.
LPG
Australia’s LPG resources in 2022 are estimated to include 588 PJ (140 MMbbl) of 2P reserves and 706 PJ (168 MMbbl) of 2C contingent resources (Table 3.3). Based on 2022 production rates of 49 PJ (12 MMbbl), Australia’s identified LPG reserves have a life of 12 years. However, these LPG production estimates do not include production for the Northern Carnarvon/Roebuck and Bonaparte/Browse basin areas as these are not captured in the offshore NOPTA data.
Table 3.3. Australia's remaining LPG reserves (2P), contingent resources (2C) and annual production during 2022, and cumulative production to end 2022.
| Basin | LPG | |||||||
|---|---|---|---|---|---|---|---|---|
| Annual Production | Cumulative Production | Reserves (2P) | Resources (2C) | |||||
| PJ | MMbbl | PJ | MMbbl | PJ | MMbbl | PJ | MMbbl | |
| Amadeus | 0 | 0 | 0 | 0 | 0 | 0 | 0 | 0 |
| Bass/Otway | 2 | 0 | 39 | 9 | 55 | 13 | 75 | 18 |
| Bonaparte/Browse1,2 | na | na | na | na | 135 | 32 | 154 | 37 |
| Bowen/Surat | 0 | 0 | 69 | 12 | 31 | 7 | 16 | 4 |
| Canning | 0 | 0 | 0 | 0 | 0 | 0 | 0 | 0 |
| Northern Carnarvon/Roebuck1 | na | na | na | na | 130 | 31 | 43 | 10 |
| Cooper/Eromanga | 10 | 2 | 924 | 186 | 70 | 17 | 101 | 24 |
| Gippsland | 37 | 9 | 3,705 | 880 | 167 | 40 | 316 | 75 |
| Perth | 0 | 0 | 0 | 0 | 0 | 0 | 0 | 0 |
| Total | 49 | 12 | 4,737 | 1,087 | 588 | 140 | 706 | 168 |
Abbreviations
PJ= Petajoules, MMbbl=million barrels, na = not available.
Notes
1LPG production data for the Bonaparte/Browse and Northern Carnarvon/Roebuck basin areas not available as these are not reported in the offshore NOPTA data for these basins. 2Data from the former Joint Petroleum Development Area (JPDA) have been omitted from Bonaparte/Browse basin totals. Data sources: Offshore data provided by NOPTA to year-end 2022; onshore data are sourced from government statistics and company estimates reported at various dates between June 2022 and June 2023.
Unconventional petroleum
Australia has significant potential for unconventional liquid petroleum resources hosted in oil shales, and shale oil and tight oil accumulations. Oil shale contains immature kerogen and requires mining and retorting to produce oil. Oil shale exploration has a long history, with sporadic small-scale production dating back to the 19th century (Dyni, 2006). Large volumes of contingent resources are contained in unconventional oil shale accumulations, estimated at 78,830 PJ (13,407 MMbbl; Table 3.5). Oil shale is the only unconventional oil resource that has been exploited to date. Currently, there is no commercial production of oil shale resources in Australia.
Other contingent unconventional oil resources are currently limited to a small quantity (841 PJ, 146 MMbbl) of condensate and LPG associated with basin centred gas and tight gas accumulations in the Bowen/Surat, Canning Cooper/Eromanga basins, as well as shale gas in the Beetaloo Sub-basin (Table 3.4).
Shale oil is liquid oil that can be extracted from shales using drilling and hydraulic fracturing. Coal oil is oil or condensate that is generated within coalbeds and then retained as a self-sourced reservoir system (USGS, 2016). Tight oil is hosted in low porosity and/or permeability reservoirs and also requires hydraulic stimulation for production. There are currently no identified contingent shale oil, coal oil or tight oil resources in Australia.
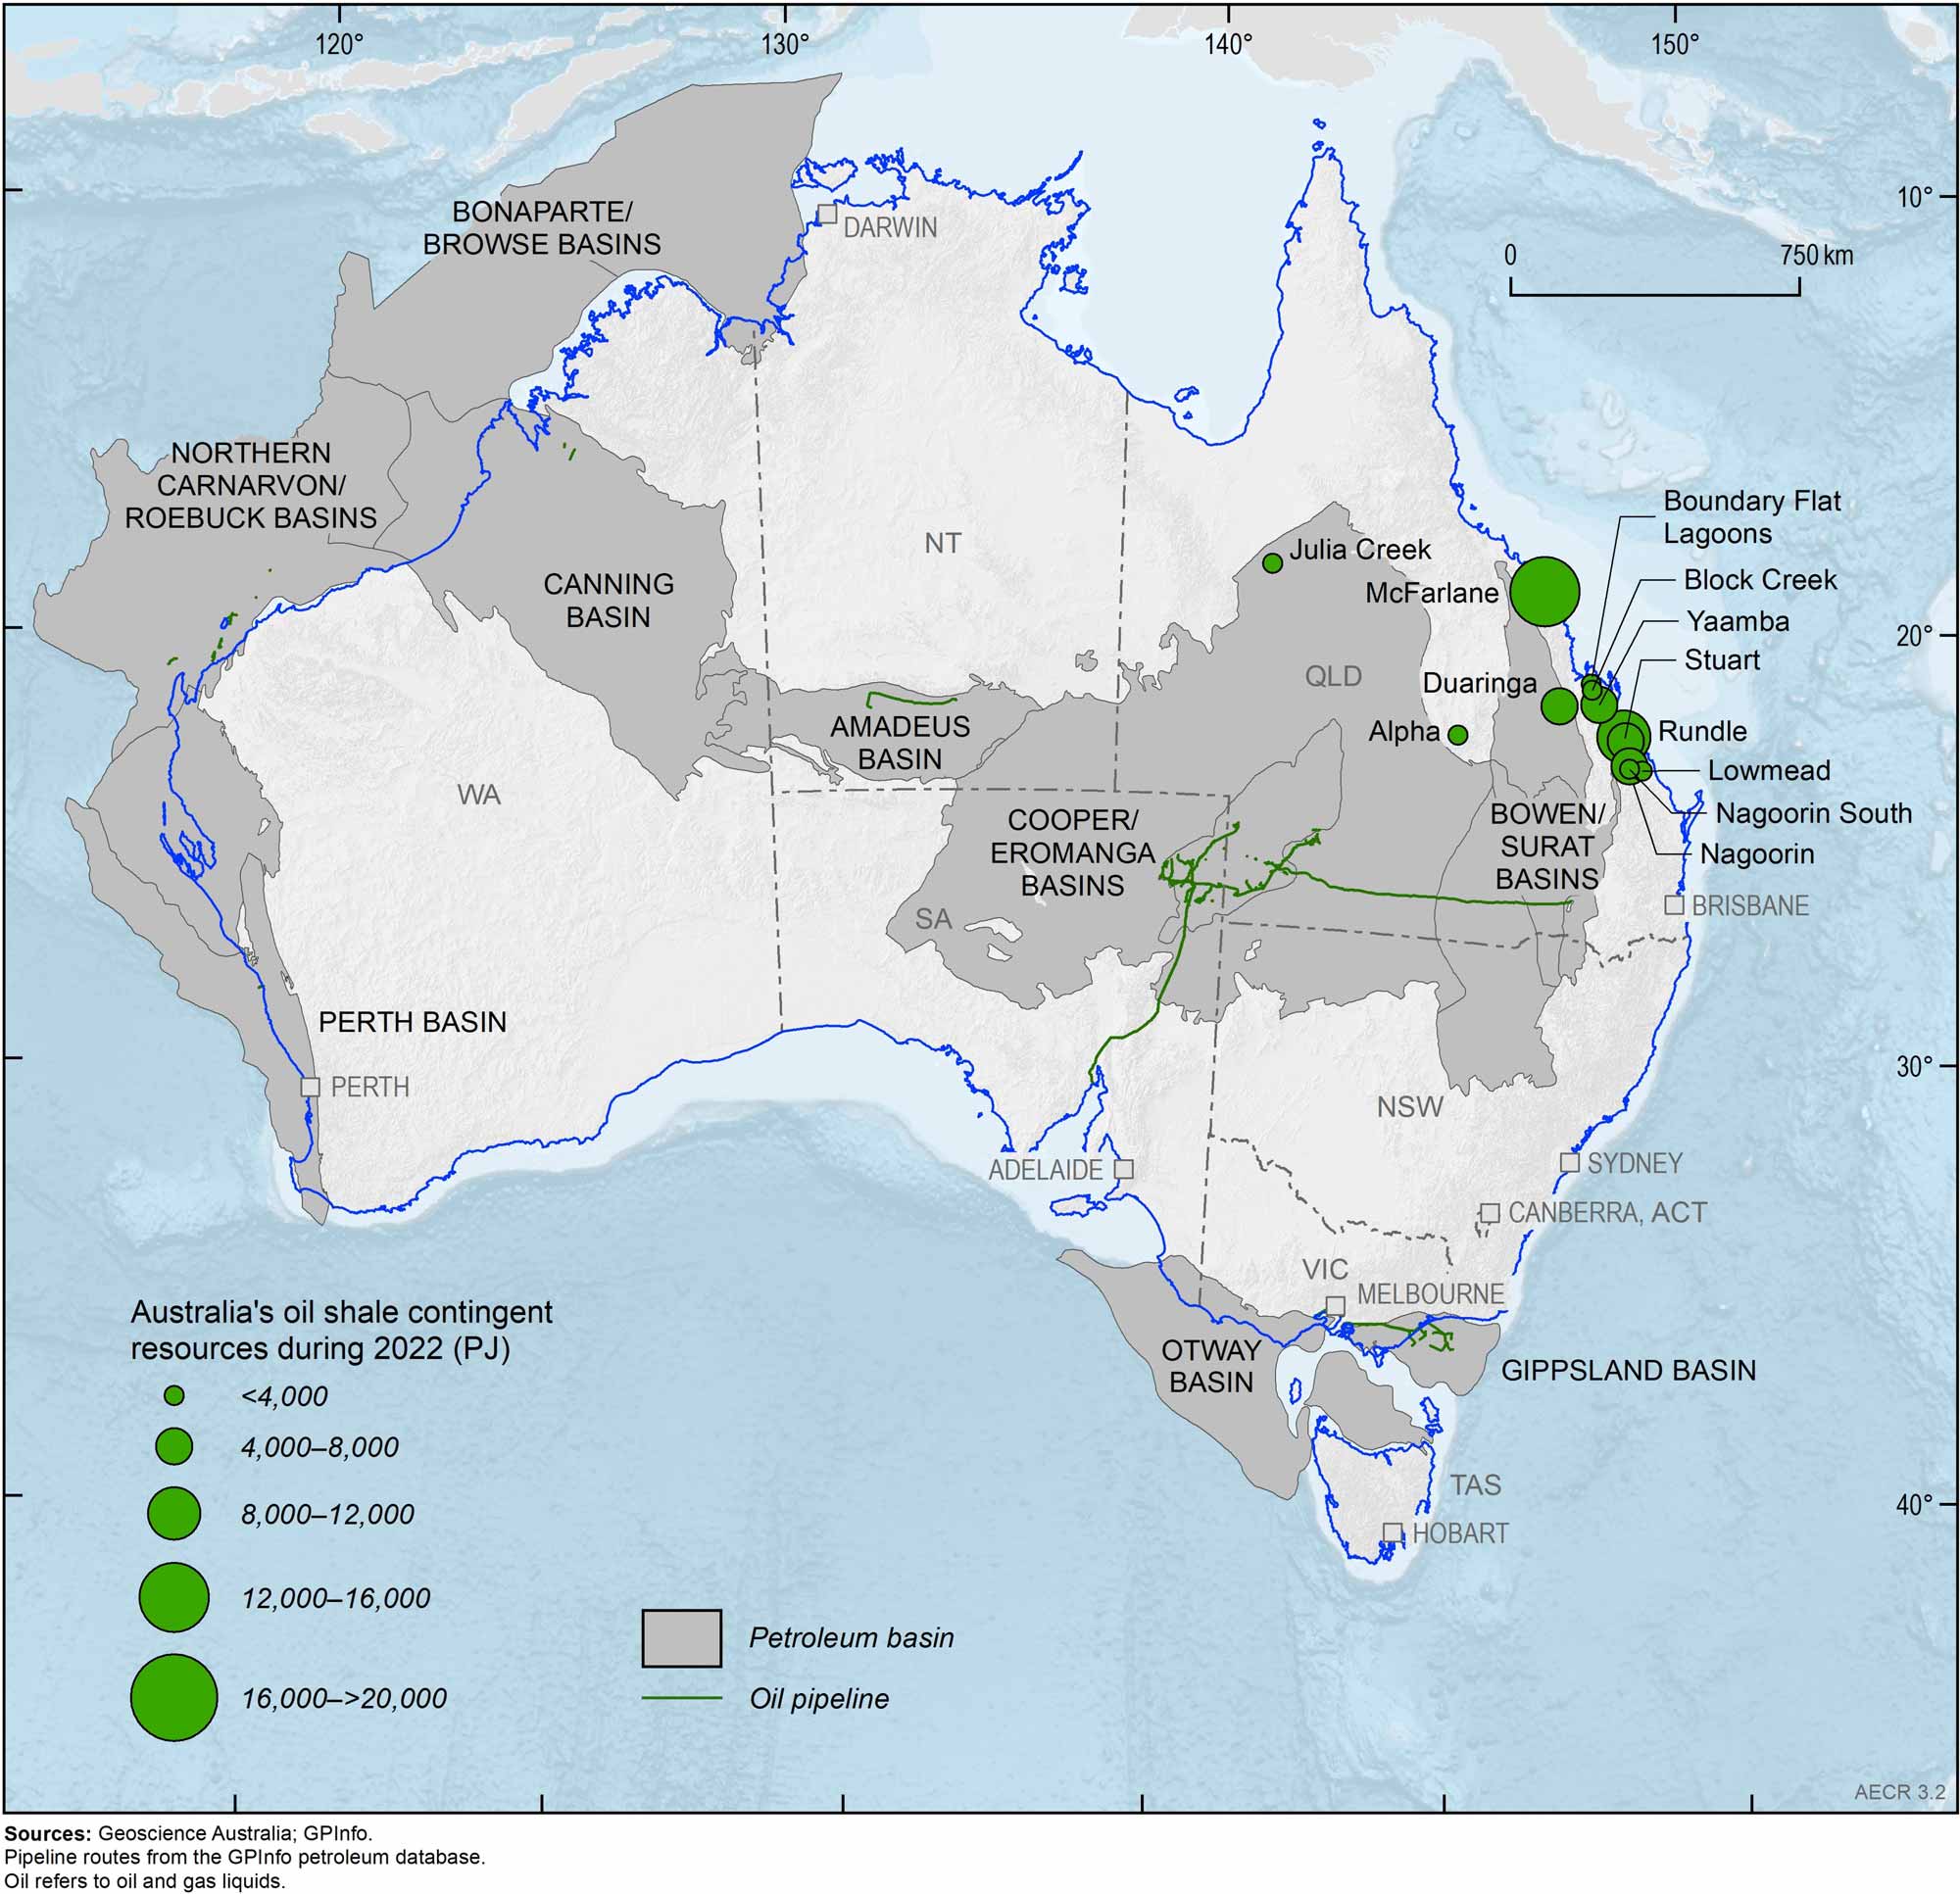
Figure 3.2. Australia’s oil shale contingent resources (2C) during 2022 (PJ). For physical units (MMbbl) refer to Table 3.5.
Table 3.4. Australia's unconventional oil contingent resources (2C) during 2022.
| Basin | Type | Unconventional Oil | Data Source | |||||
|---|---|---|---|---|---|---|---|---|
| Resources (2C) | ||||||||
| Oil | Condensate | LPG | ||||||
| PJ | MMbbl | PJ | MMbbl | PJ | MMbbl | |||
| Beetaloo Sub-basin | Shale gas | 0 | 0 | 21 | 4 | 0 | 0 | Empire Energy (2023) |
| Bowen/Surat |
Basin centred gas; Tight gas | 0 | 0 | 442 | 75 | 30 | 7 | Elixir Energy Limited (2022, 2023), Omega Oil & Gas Limited (2023), Qld Govt Dept of Resources (2024) |
| Canning |
Basin centred gas; tight gas | 0 | 0 | 320 | 55 | 0 | 0 |
Buru Energy (2018); Black Mountain (2022) |
| Cooper/Eromanga | Undifferentiated | 0 | 0 | 18 | 3 | 10 | 2 | Beach Energy (2023) |
| Total | 0 | 0 | 801 | 136 | 40 | 10 | ||
Notes
PJ = Petajoules; MMbbl = Million barrels.
Table 3.5. Australia's oil shale contingent resources (2C) during 2022.
| Basin / deposit | Type | Oil | Data Source | |
|---|---|---|---|---|
| Resources (2C) | ||||
| PJ | MMbbl | |||
| Alpha deposit | Oil Shale | 58 | 10 | Geoscience Australia (2018) |
| Block Creek deposit | Oil Shale | 1,355 | 230 | Geoscience Australia (2018) |
| Boundary Flat Lagoons deposit | Oil Shale | 1,535 | 261 | Geoscience Australia (2018) |
| Duaringa deposit | Oil Shale | 8,485 | 1,443 | Geoscience Australia (2018) |
| Julia Creek deposits (aggregated) | Oil Shale | 417 | 71 | QEM Limited (2022) |
| Lowmead deposit | Oil Shale | 1,253 | 213 | Geoscience Australia (2018) |
| McFarlane deposit | Oil Shale | 28,745 | 4,889 | Geoscience Australia (2018) |
| Nagoorin deposit | Oil Shale | 6,305 | 1,072 | Geoscience Australia (2018) |
| Nagoorin South deposit | Oil Shale | 415 | 71 | Geoscience Australia (2018) |
| Rundle deposit | Oil Shale | 15,533 | 2,642 | Geoscience Australia (2018) |
| Stuart deposit | Oil Shale | 7,711 | 1,311 | Geoscience Australia (2018) |
| Yaamba deposit | Oil Shale | 7,018 | 1,194 | Geoscience Australia (2018) |
| Total | 78,830 | 13,407 | ||
Abbreviations
PJ = Petajoules; MMbbl = Million barrels.
Notes
Queensland has a moratorium on the McFarlane oil shale development; in other cases, the Queensland Government will consider the development of oil shale deposits subject to the merits of the proposal. With the exception of the Julia Creek deposits, these resources were reported as recoverable shale oil resources under the subeconomic “Paramarginal” and “Submarginal” categories of the JORC Code for reporting of Mineral Resources and Ore Reserves.
Production
Production
Australia’s oil production in 2022 totalled 687 PJ (120 MMbbl; Table 3.6). Two-thirds of Australia’s extracted oil in 2022 was condensate and LPG resources associated with producing gas fields.
Trends in oil production are captured by the Australian Government’s energy production statistics in the Australian Energy Update (Department of Climate Change, Energy, the Environment and Water [DCCEEW], 2023a, 2023b). Between 2008–09 and 2017–18, the combined production of crude oil and condensate in Australia showed a trend of long-term decline (Figure 3.3), falling by more than 40% from the production levels seen in 2008-9. This decline reversed in 2018–19 and 2019–20 following the start-up of the Greater Enfield, Ichthys and Prelude projects on the North West Shelf. In 2021–22, crude oil and condensate production increased marginally to 723 PJ, though this increase was not enough to fully recover from the 10% decline recorded in 2020–21.
The 2020–21 decline was primarily due to production facility outages at the Prelude and Gorgon LNG plants, reducing condensate and LPG output, with concurrent reductions in crude oil output attributed to the natural decline in production from ageing oil fields (DCCEEW, 2022). LPG production increased to 168 PJ in 2021–22, up 15%, as the output of condensate from the Prelude and Gorgon LNG projects recovered from the disruptions during 2020-21.
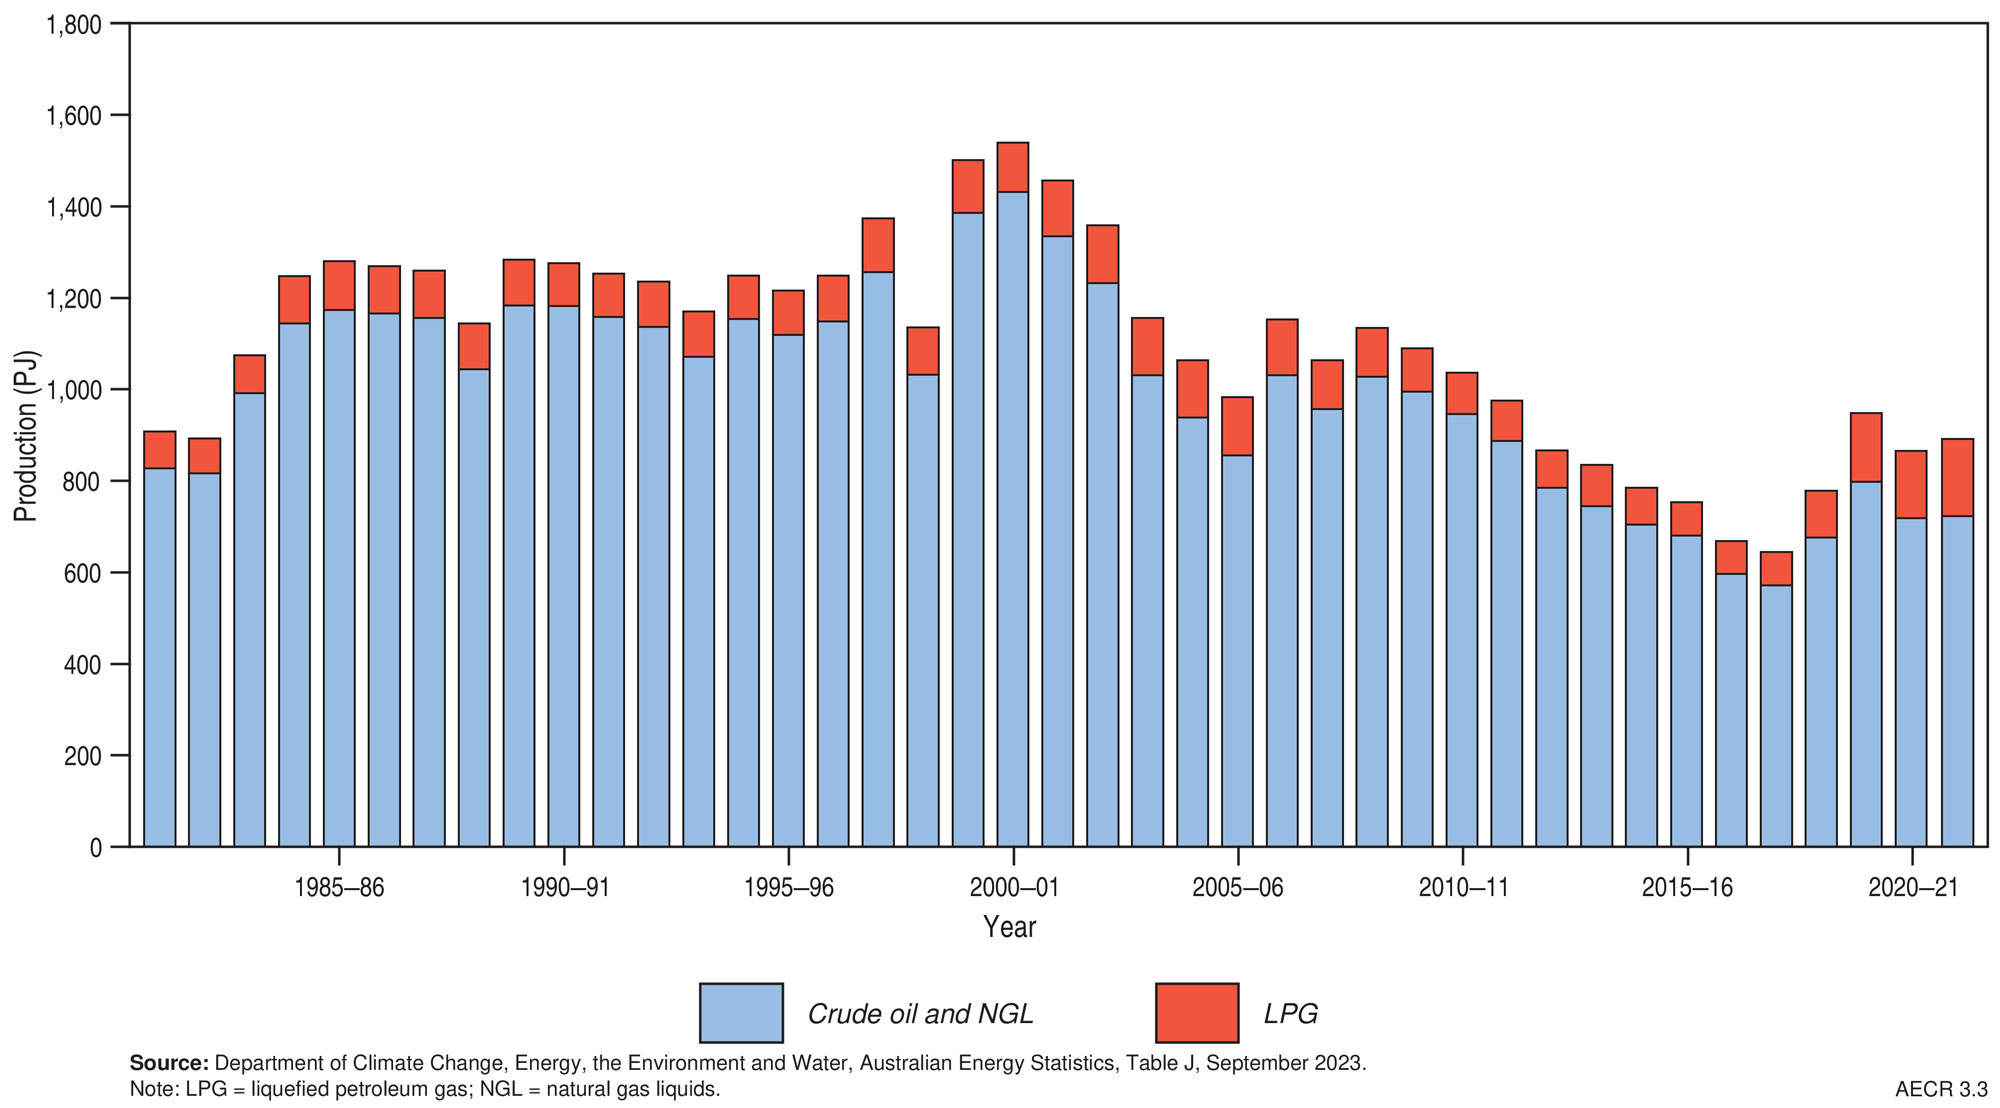
Figure 3.3. Historical trends in Australia’s primary oil production.
Table 3.6. Key statistics for crude oil, condensate and LPG, 2022.
| Unit | Australia 2022 | World 2022 | |
|---|---|---|---|
| Resources | |||
| Proved reserves (at end of year) | PJ | na | 10,654,260b |
| Bbbl | na | 1,732.4b | |
| Proved plus Probable reserves (at end of year) | PJ | 8,045a | na |
| Bbbl | 1.4a | na | |
| of which: crude oil | Bbbl | 0.3a | na |
| of which: condensate | Bbbl | 1.0a | na |
| of which: LPG | Bbbl | 0.1a | na |
| CAGR from 2010 | % | -2.4a | na |
| Production | |||
| Annual production | PJ | 687a | 210,664b |
| MMbbl | 120a | 34,254b | |
| of which: crude oil | MMbbl | 40a | na |
| of which: condensate | MMbbl | 69a | na |
| of which: LPG | MMbbl | 12a | 4,632b |
| CAGR from 2012 | % | –1.2b | 0.9b |
| Share of world oil production | % | 0.4b | 100b |
| World ranking | no. | 30b | na |
| Exports | |||
| Oil | PJ | 587c | 95,977b |
| Oil export value | A$b | 14.9c | na |
| Petroleum products | PJ | 96c | 58,49b |
| Petroleum products export value | A$b | 1.7c | na |
| Imports | |||
| Oil | PJ | 387c | 95,977b |
| Oil import value | A$b | 10.6c | na |
| Petroleum products | PJ | 1,707c | 58,496b |
| Petroleum products import value | A$b | 54.8c | na |
Abbreviations
PJ = petajoules. MMbbl = million barrels. LPG = liquefied petroleum gas. CAGR = compound annual growth rate. A$b = billion Australian dollars. na = not available.
Notes
Energy Institute oil reserves data are proved reserves while Geoscience Australia data are Proved and Probable (2P) reserves. World reserve data in Table 3.6 are current as of 2020, whilst world production data are current as of 2022. Reserves and production include condensate, natural gas liquids (NGLs) as well as crude oil. Oil exports and imports include crude oil and condensate. Petroleum products include refined products and LPG. Source: aGeoscience Australia; bEnergy Institute (2023) Statistical Review of World Energy; cDepartment of Industry, Science and Resources (2024) Resources and Energy Quarterly, March 2024 (Tables 16,17, and 19).
Trade
Trade
Since the mid-1980's Australia has been a net importer of refined oil products, as well as crude oil and other refinery feedstocks. However, Australia also exports a major share of its crude oil production, predominantly from Western Australia (Figure 3.4). Australia’s crude oil and condensate exports increased by 5% in 2021-22 to 623 PJ (DCCEEW, 2023a). Associated export earnings nearly doubled to AUD$14 billion, as oil prices recovered from the impact of COVID-19 and rose sharply following Russia’s invasion of Ukraine.
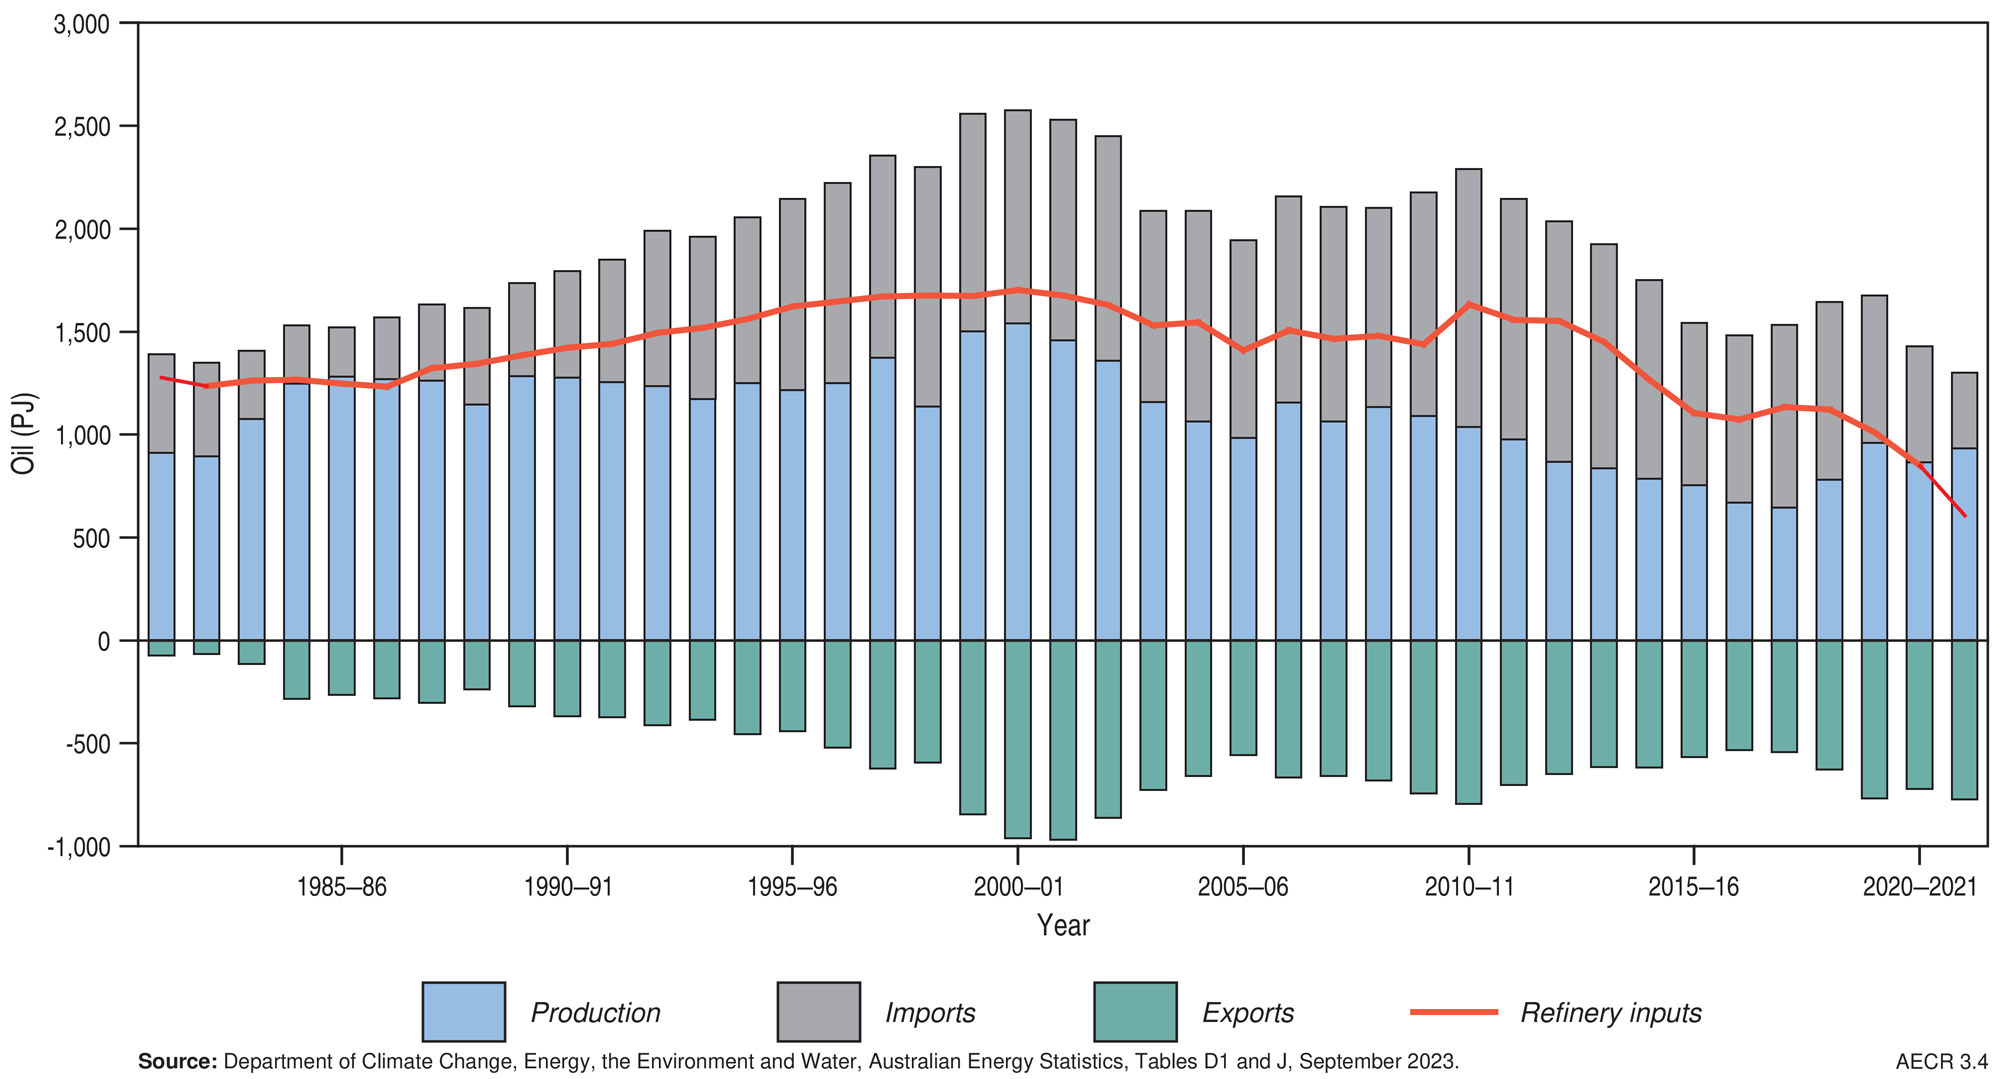
Figure 3.4. Historical trends in Australia’s oil balance.
About 86% of Australia’s domestically produced oil resources were exported in 2021-22. This is because Australian basins typically produce light sweet oils (less dense, lower sulphur), which need to be blended with other heavier crude oils to produce refined fuel products. As most oil in Australia is produced on the North West Shelf at significant distances from refineries in the eastern part of the country, it is more cost effective to transport crude oil to larger refineries in the Asian region and import refined fuel products into Australia. The oil produced from eastern Australian basins is largely consumed domestically. However, falling east coast oil production means that Australia’s two remaining domestic refineries increasingly rely on imported feedstock (Figure 3.5).
Australia also exported a small volume (about 168 PJ) of refined products and LPG in 2021-22, but this remained as a small proportion of domestically refined products. Export earnings from Australia’s refined petroleum products and LPG increased by about 43% in 2021–22 to AUD$5 billion, mostly because of increased earnings from bunker fuels (DISR, 2024).
The majority of Australia’s energy imports are represented by refined petroleum products (including LPG) and crude oil (Figure 3.5). Australia’s imports of crude oil continued to decline, with a decrease of 29% (160 PJ) in 2021–22 to 387 PJ, largely due to the closure of two refineries in 2021: Kwinana in Western Australia in March, and Altona in Victoria in August. Meanwhile, imports of refined products and LPG were at the highest level on record, increasing by 17% to 1,575 PJ (DCCEEW, 2023a), in part to replace declining supply from domestic refineries.
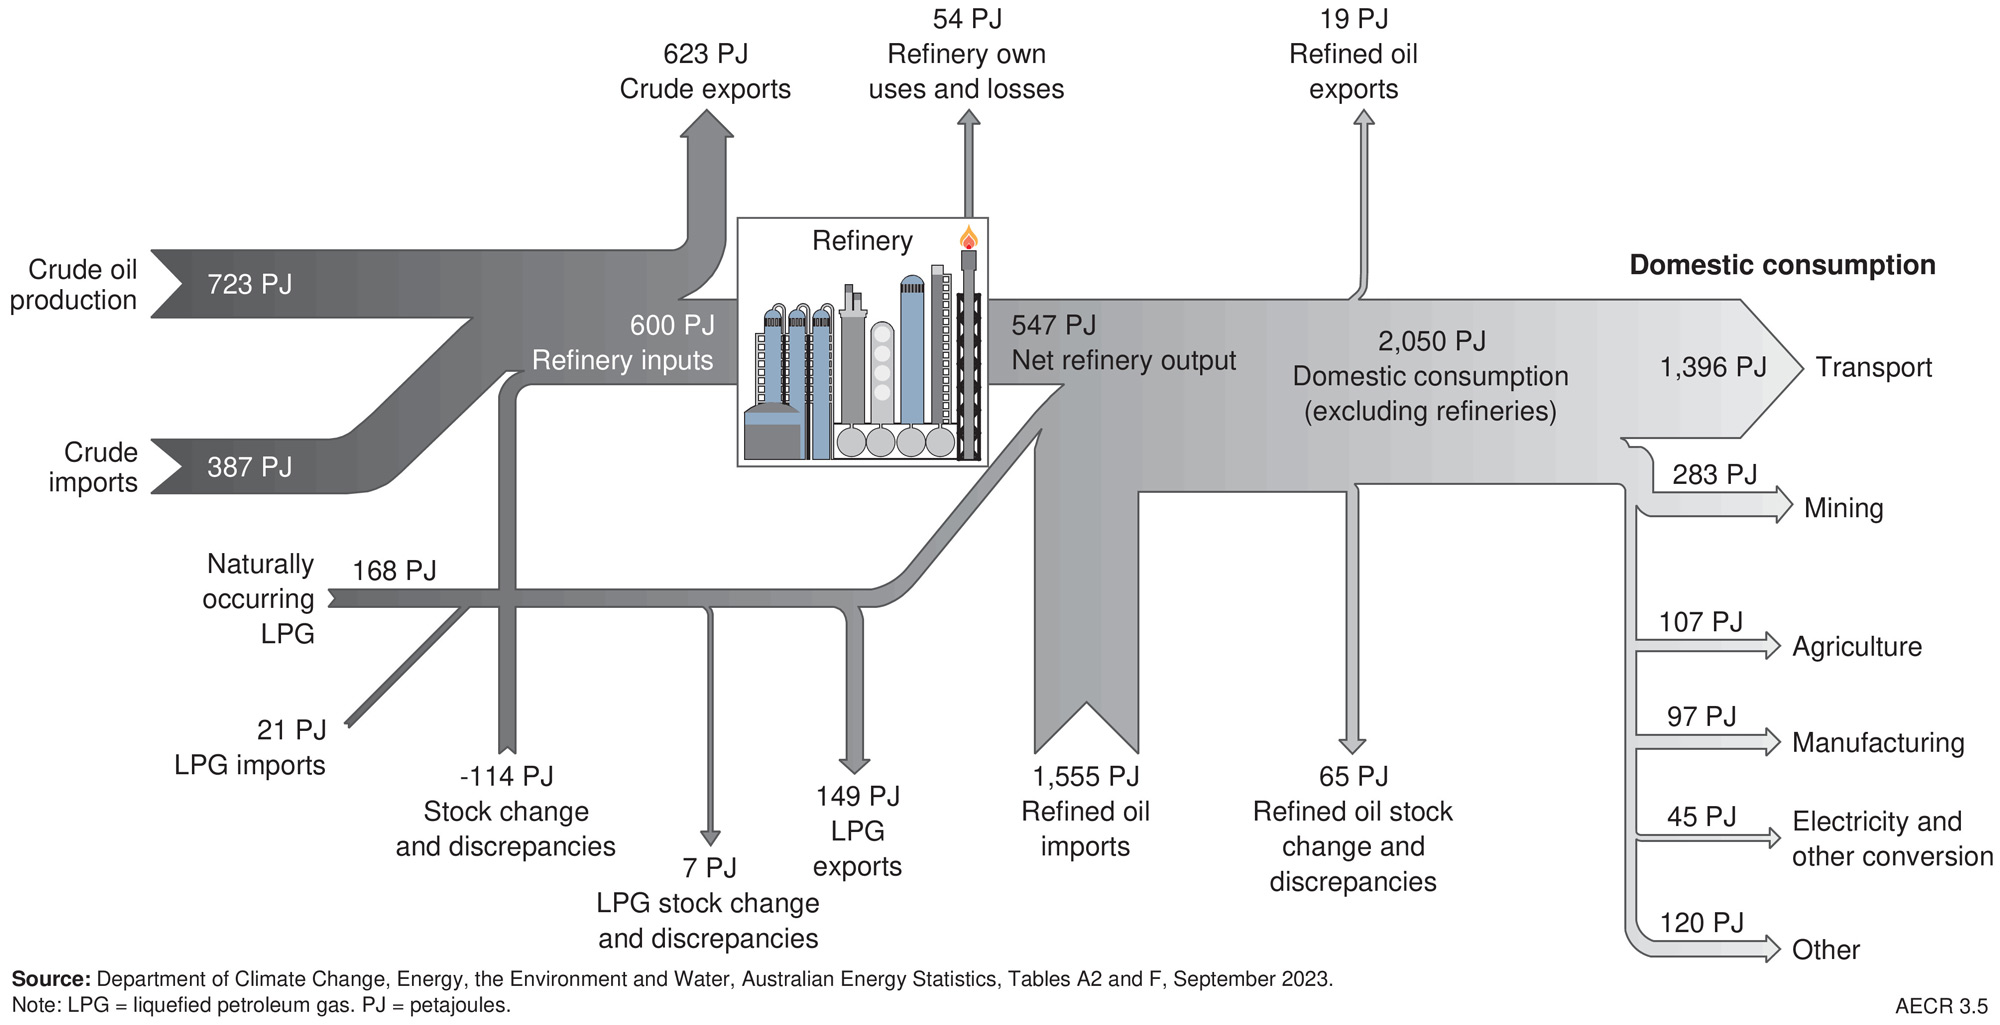
Figure 3.5. Australia’s oil flows, 2021-22.
World oil resources
World oil resources
In 2022, total world oil production was approximately 34 billion barrels (equivalent to ~210,664 PJ; Energy Institute, 2023). Volumetrically, the largest oil producers were in the Middle East, which held a 33% share of world production. The United States was the largest single producer, accounting for 19% of world production, followed by Saudi Arabia (13%) and the Russian Federation (12%; Figure 3.6). Australia is a minor oil producer, ranking 30th in the world and accounting for less than 0.5% of total oil production in 2022 (Energy Institute, 2023).
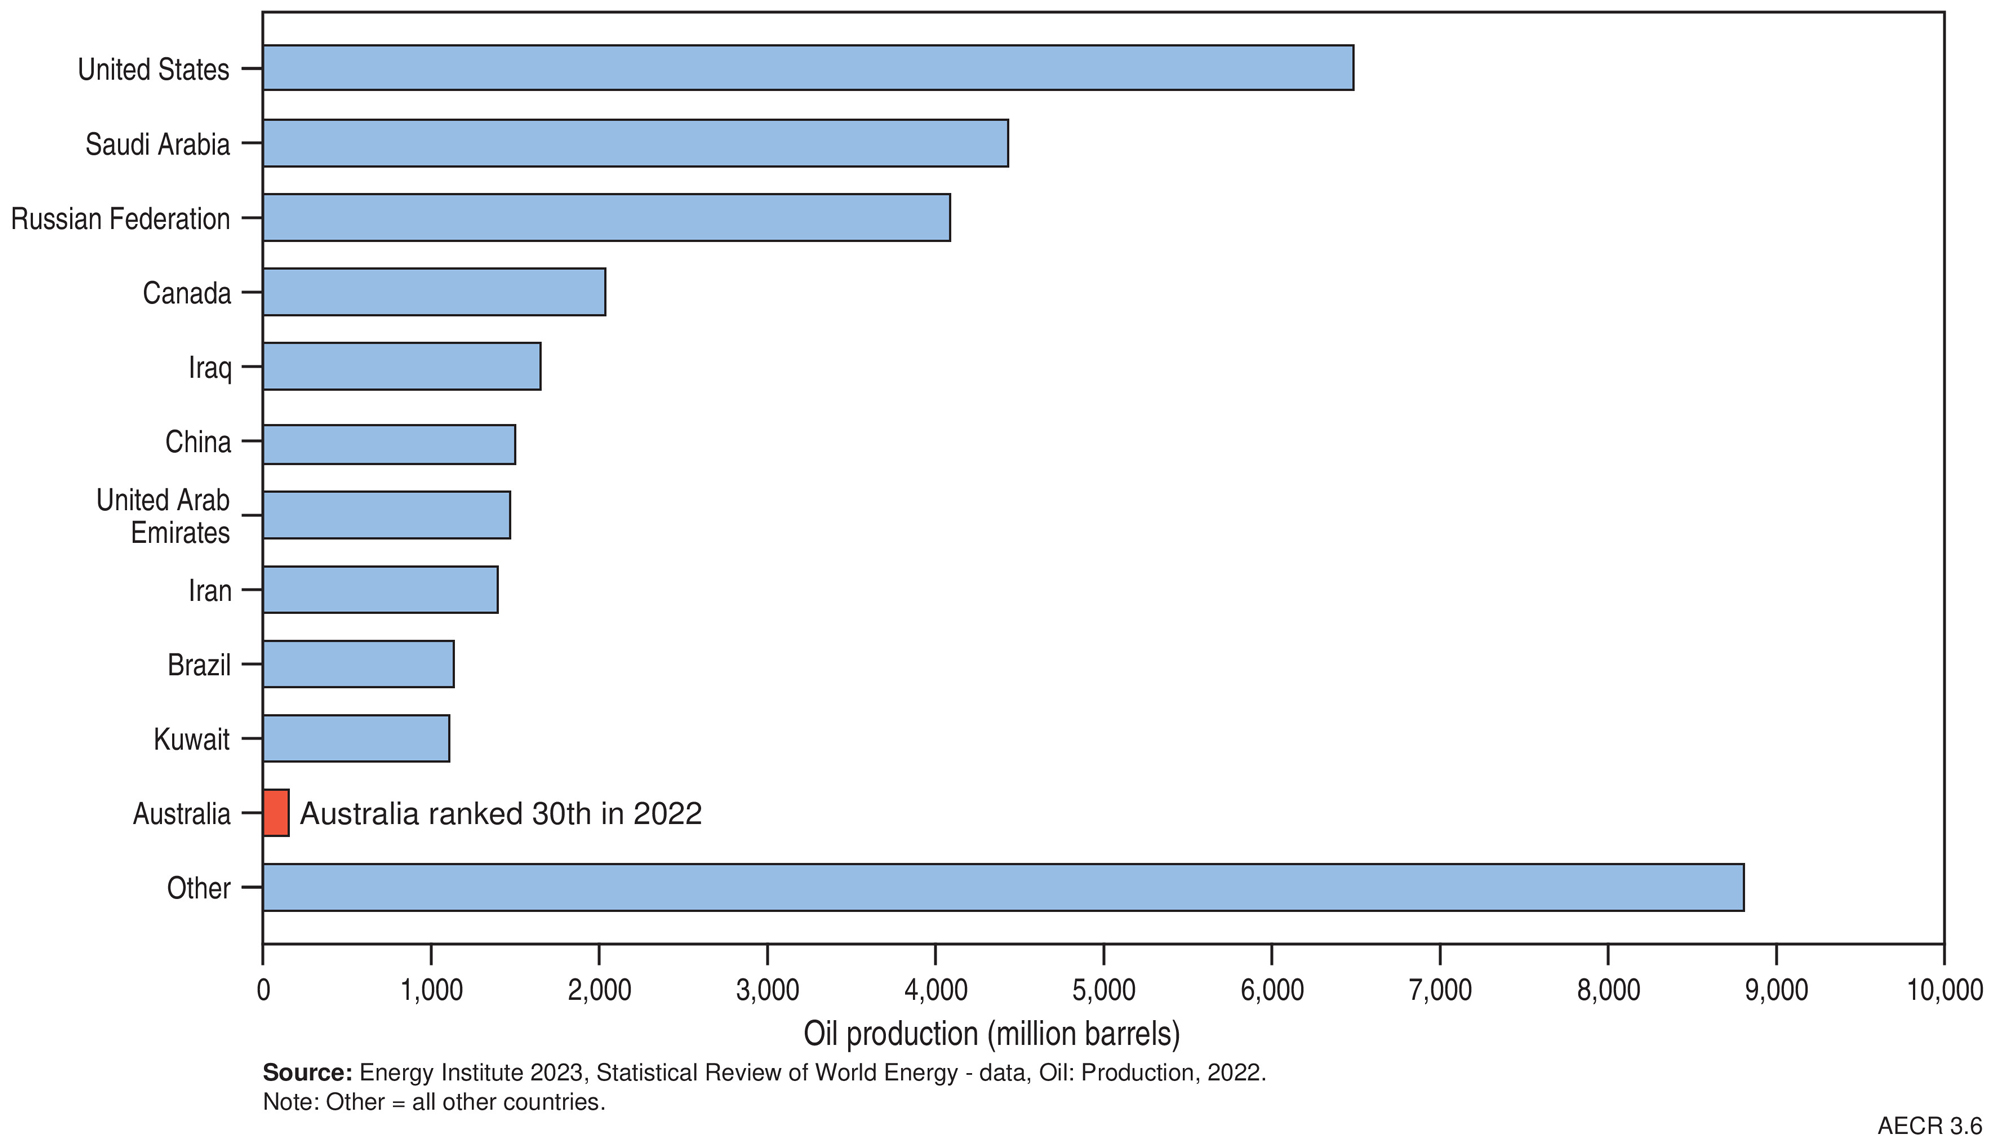
Figure 3.6. World oil production in 2022.
References
References
DCCEEW (Department of Climate Change, Energy, the Environment and Water), 2022. Australian Energy Update 2022 (Last accessed 13 May 2024)
DCCEEW (Department of Climate Change, Energy, the Environment and Water), 2023a. Australian Energy Update 2023, (last accessed 22 March 2024).
DCCEEW (Department of Climate Change, Energy, the Environment and Water), 2023b. Australian Energy Statistics 2023, Tables A2, D1, F and J, September 2023 (last accessed 22 March 2024).
DISR (Department of Industry, Science and Resources), 2024. Resources and Energy Quarterly, March 2024 (Last accessed 13 May 2024).
Dyni, J.R. 2006. Geology and resources of some world oil-shale deposits: U.S. Geological Survey Scientific Investigations Report 2005–5294, 42 p. (Last accessed 1 May 2024).
Energy Institute, 2023. Statistical Review of World Energy. (last accessed 22 March 2024).
United States Geological Survey (USGS). 2016. Assessment of undiscovered conventional oil and gas resources of the Cooper and Eromanga basins, Australia, 2016. U.S. Geological Survey Fact Sheet 2016-3050, 2 p. (Last accessed 1 May 2024).
References for onshore reserves, contingent resources, and production data
Armour Energy Limited, 2023. Annual Report For the year ended 30 June 2023 (Last accessed 17 April 2024)
Bass Oil Limited, 2023. Annual Report 2023. (Last accessed 17 April 2024)
Bass Oil Limited, 2023. Reserves and Contingent Resources at 31 December 2022. (Last accessed 17 April 2024)
Beach Energy Limited, 2022. Quarterly Report for the period ended 30 June 2022. (Last accessed 17 April 2024)
Beach Energy Limited, 2023. FY23 Second Quarter Activities Report (Last accessed 17 April 2024)
Beach Energy Limited, 2023. Annual Report 2023 (Last accessed 17 April 2024)
Bengal Energy Limited, 2022. Bengal Energy Announces Independent Oil and Natural Gas Resource Report (Last accessed 17 April 2024)
Bengal Energy Limited, 2023. Annual Information Form 2023. (Last accessed 17 April 2024)
Bengal Energy Limited, 2023. Annual Report 2023. (Last accessed 17 April 2024)
Black Mountain Energy, 2021. Prospectus (Last accessed 17 April 2024)
Black Mountain Energy, 2022. Annual Report 2022 (Last accessed 17 April 2024)
Buru Energy Limited, 2018. Independent Assessment of Resources at the Yulleroo Field 18 January 2018 (Last accessed 17 April 2024)
Buru Energy Limited, 2023. Annual Report 2022. (Last accessed 17 April 2024)
Buru Energy Limited, 2022. Rafael resources report confirms major gas potential (Last accessed 17 April 2024)
Carnarvon Energy Limited, 2023. Annual Report 2023 (Last accessed 03 June 2024)
Central Petroleum Limited, 2023. 2023 Annual Report. (Last accessed 17 April 2024)
Cooper Energy Limited, 2023. Annual Report 2023 .(Last accessed 17 April 2024)
Cooper Energy Limited, 2023. Reserves and Contingent Resources at 30 June 2023. (Last accessed 17 April 2024)
Cooper Energy Limited, 2022. Quarterly report for the three months ended 30 June 2022. (Last accessed 17 April 2024)
Cooper Energy Limited, 2023. Quarterly report for the three months ended 31 December 2022. (Last accessed 17 April 2024)
Denison Gas Limited, 2024. Reserves and resources (Last accessed 30 January 2024)
Elixir Energy Limited, 2022. Initial Contingent Resource Booked in Queensland. (Last accessed 17 April 2024)
Elixir Energy Limited, 2023. Good Oil Presentation, 5 September 2023. (Last accessed 17 April 2024)
Empire Energy Group Limited, 2023. Major EP187 Contingent Resources Upgrade. (Last accessed 17 April 2024)
EnergyQuest, 2023. EnergyQuarterly March 2023. EnergyQuest.
Geoscience Australia, 2018. Australian Energy Resources Assessment (AERA).
Jadestone Energy, 2023. 2022 Annual Report (Last accessed 22 May 2024)
New Hope Corporation, 2022. Bridgeport Energy Limited – 2022 Petroleum Reserves and Contingent Resources statement (Last accessed 17 April 2024)
New Hope Corporation, 2023. Bridgeport Energy Limited - 2023 Petroleum Reserves and Contingent Resources statement (Last accessed 17 April 2024)
Northern Territory Department of Industry, Tourism and Trade, 2023. NT onshore oil and gas production data (Last accessed 17 April 2024)
Northern Territory Geological Survey (NTGS), 2023. NT Resourcing The Territory Shale Gas and Liquids Factsheet April 2023 (Last accessed 17 April 2024)
Northern Territory Geological Survey (NTGS), 2023. NT Resourcing The Territory Conventional Oil and Gas Factsheet April 2023 (Last accessed 17 April 2024)
Omega Oil & Gas Limited, 2022. Prospectus. (Last accessed 17 April 2024)
Omega Oil & Gas Limited, 2023. Maiden Gross Contingent Gas Resource of 1.73 TCF across
ATPs 2037 and 2038. (Last accessed 17 April 2024)
Pilot Energy, 2023. Annual Report 2023. (Last accessed 17 April 2024)
Pilot Energy, 2023. Material Gas Fairway Identified in WA-481-P (Last accessed 03 June 2024)
QEM, 2022. QEM Upgrades Julia Creek Resource Base (Last accessed 17 April 2024)
Queensland Government, Department of Resources, 2024. Petroleum and gas production and reserve statistics. (Last accessed 17 April 2024)
Red Sky Energy Limited, 2022. Killanoola Project Initial Oil in Place Report (Last accessed 17 April 2024)
Red Sky Energy Limited, 2023. Presentation to Good Oil Conference (Last accessed 17 April 2024)
Santos Limited, 2023. 2022 Fourth Quarter Report Data Tables (Last accessed 17 April 2024)
Santos Limited, 2023. Annual Report 2022 (Last accessed 17 April 2024)
Strike Energy Limited, 2022. Independent certification of Ocean Hill gas resource (Last accessed 17 April 2024)
Strike Energy Limited, 2022. Independent certification of Walyering reserves (Last accessed 17 April 2024)
Triangle Energy (Global) Limited, 2023. Annual Report for the year ended 30 June 2023 (Last accessed 03 June 2024)
Triangle Energy (Global) Limited, 2022. Quarterly Report Period ending 31 March 2022 (Last accessed 03 June 2024)
Triangle Energy (Global) Limited, 2022. Quarterly Report Period ending 30 June 2022 (Last accessed 03 June 2024)
Triangle Energy (Global) Limited, 2022. Quarterly Report Period ending 30 September 2022 (Last accessed 03 June 2024)
Triangle Energy (Global) Limited, 2023. Quarterly Report Period ending 31 December 2022 (Last accessed 03 June 2024)
Victoria Department of Energy, Environment and Climate Action, 2023. Earth Resources Regulator Annual Statistical Report FY2022-23 (Last accessed 17 April 2024)
Vintage Energy Ltd, 2023. Annual Report 2023 (Last accessed 17 April 2024)
Woodside Energy Group Ltd, 2023. Annual Report 2022 (Last accessed 05 June 2024)
Data download
Data download
Australia's Energy Commodity Resources Data Tables - 2022 reporting period