Australia's Energy Commodity Resources 2024 Overview
Page last updated:15 July 2024
Introduction
Introduction
Welcome to the fourth edition of Geoscience Australia’s assessment of Australia’s Energy Commodity Resources (AECR 2024). AECR 2024 provides resource estimates of the nation’s non-renewable energy commodity resources, including oil, gas, coal uranium and thorium as at the end of 2022. Estimates are grouped according to commodity type, reserves and annual production.
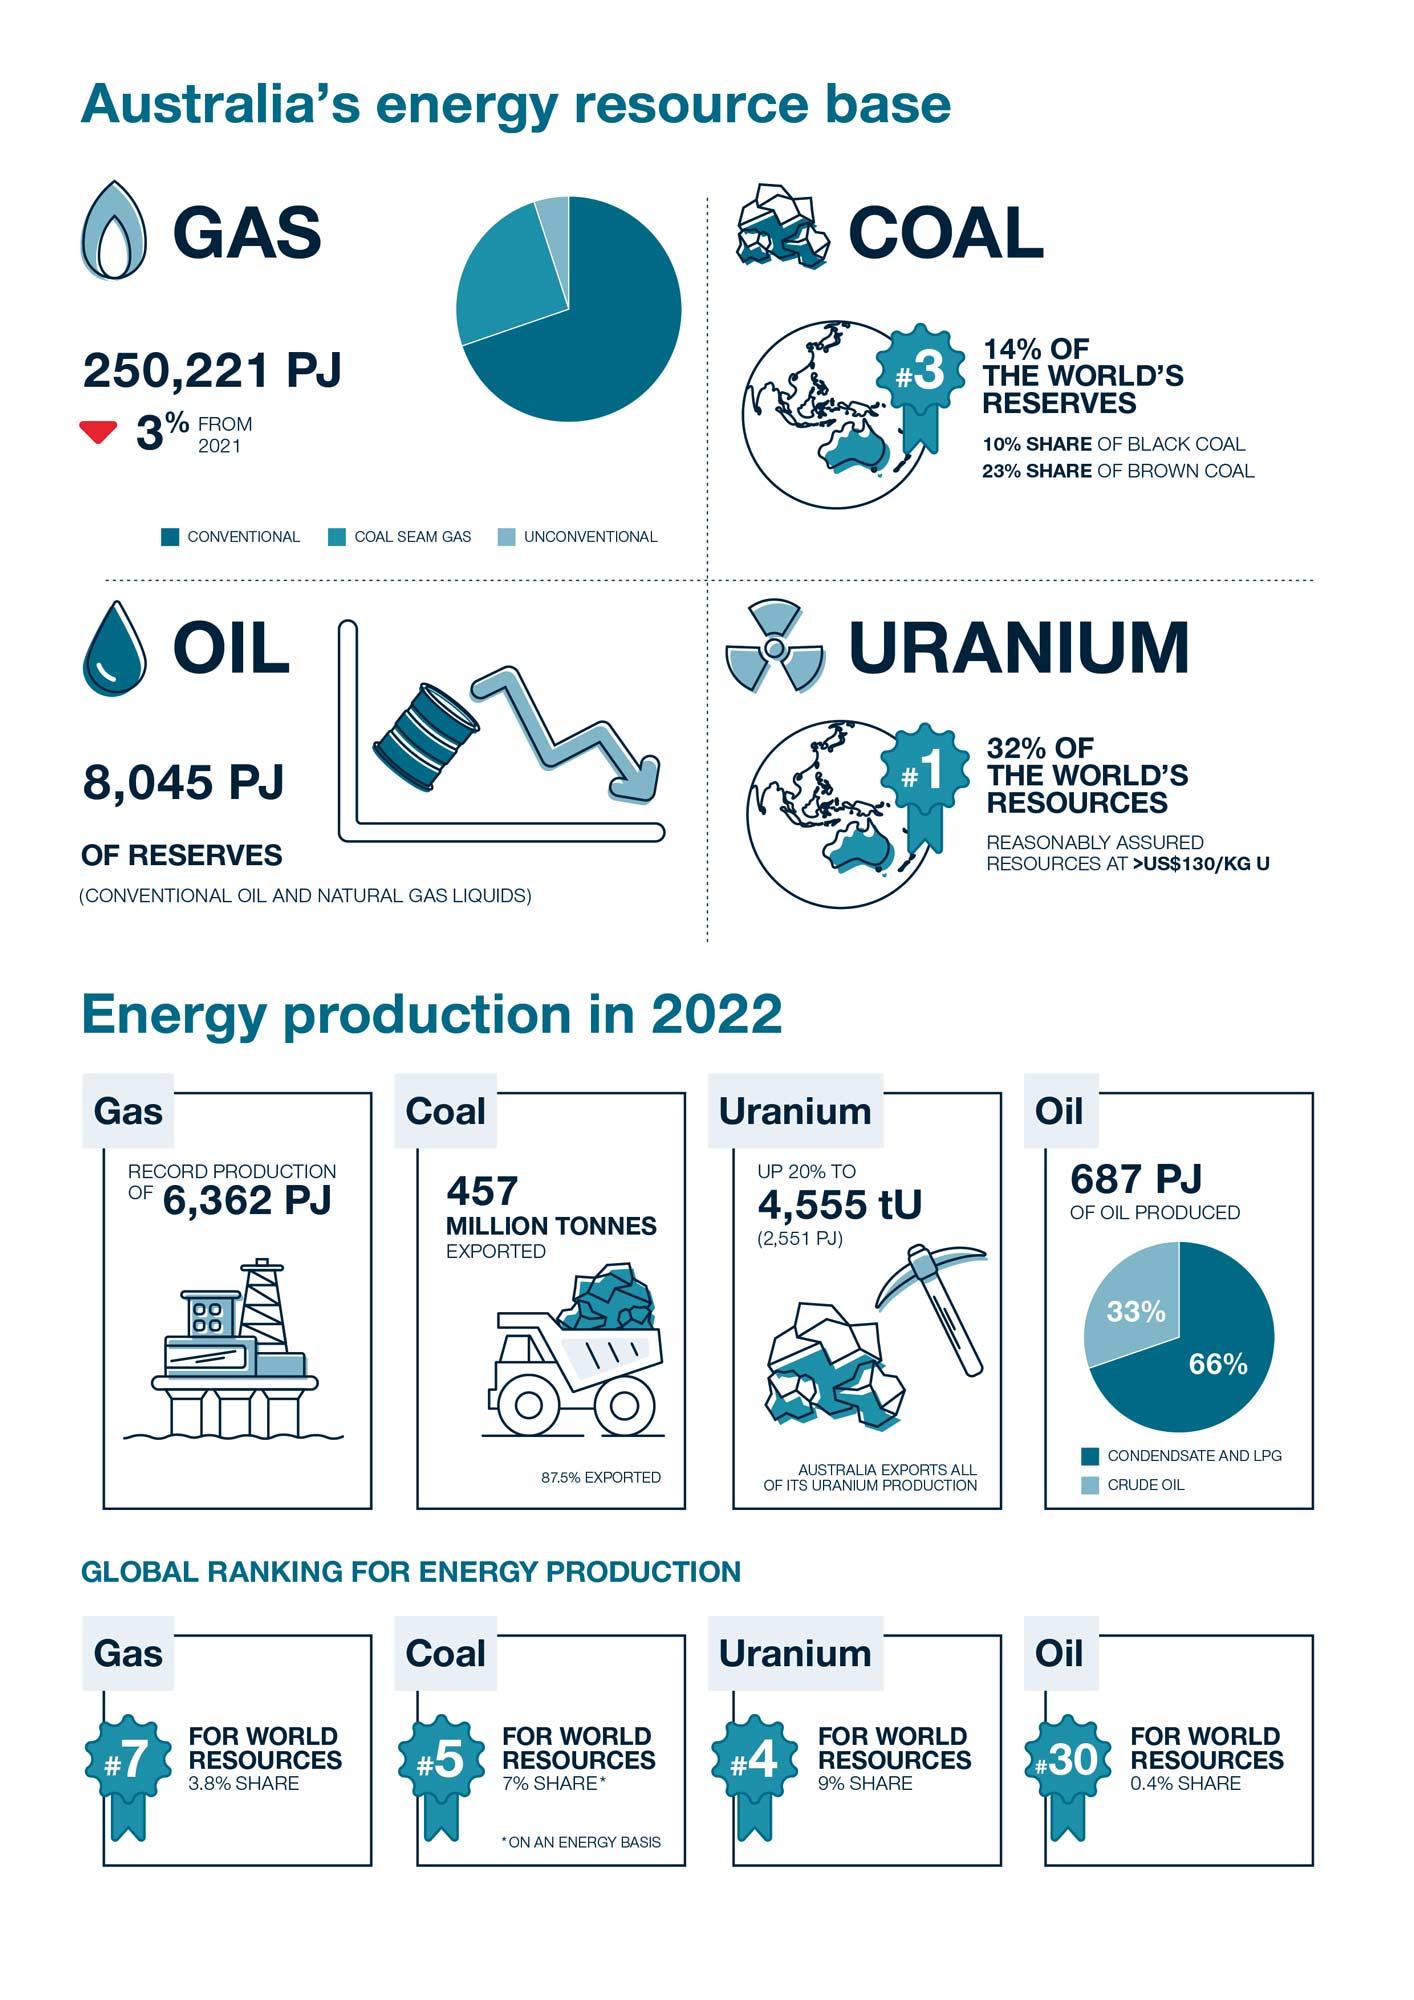
Throughout 2022 Australia continued to be a key global net energy exporter with a strong and diverse mix of energy resources across the continent, contributing 9% of uranium commodities, 7% of coal commodities and 4% of gas commodities to global energy production (Figure 1.1).
In 2022, Australia’s total demonstrated energy commodity resources (TDR) decreased by 1.2% (79,395 petajoules [PJ]; Table 1.1). Most of this decline was associated with a 3.5% (70,773 PJ) decrease in the TDR for black coal, a 5.9% (11,129 PJ) decrease in the TDR for conventional gas and a 6.6% decrease (5,606 PJ) in oil shale resources. The TDR for unconventional gas rose by 42.6% (4,347 PJ), as additional contingent resources were identified in the Beetaloo Sub-basin (1,991 PJ) and Bowen/Surat basins (2,359 PJ). There was also a 3.7% (1,107 PJ) increase in proven and probable reserves for coal seam gas during 2022, as reserves in the Bowen and Surat basins were upgraded. Meanwhile, Australia’s conventional oil resources continued their long-term decline, decreasing by 1.9% (411 PJ), despite crude oil TDR increasing by 5.4% (244 PJ) to a total of 4,791 PJ.
In line with the 1.1% (6,630 PJ) increase in global primary energy demand in 2022 (Energy Institute, 2023), Australia’s total production of its energy commodity resources also increased by 1.6% (332 PJ), reversing some of the declines in recent years (Table 1.1). This increase in production was largely due to the recovery from COVID-19 related factors and other matters including technical hurdles, trade sanctions and weather-related issues which had directly impacted Australian production in 2020 and 2021.
There was also a moderate increase in the production of natural gas (3.4%; 209 PJ) in 2022 as conventional production (up 5.7%) recovered from disruptions associated with COVID-19 and infrastructure maintenance and a significant increase in the production of uranium (20.5%; 438 PJ). However, production of coal decreased by 6.2% (37 million tonnes or 262 PJ); with brown coal production continuing its long-term decline and black coal production being impacted by severe weather events (Australia’s Identified Mineral Resources 2023) and production declined for both crude oil (9.9%) and condensate (6.3%), representing a combined decrease of 7.7% (53 PJ).
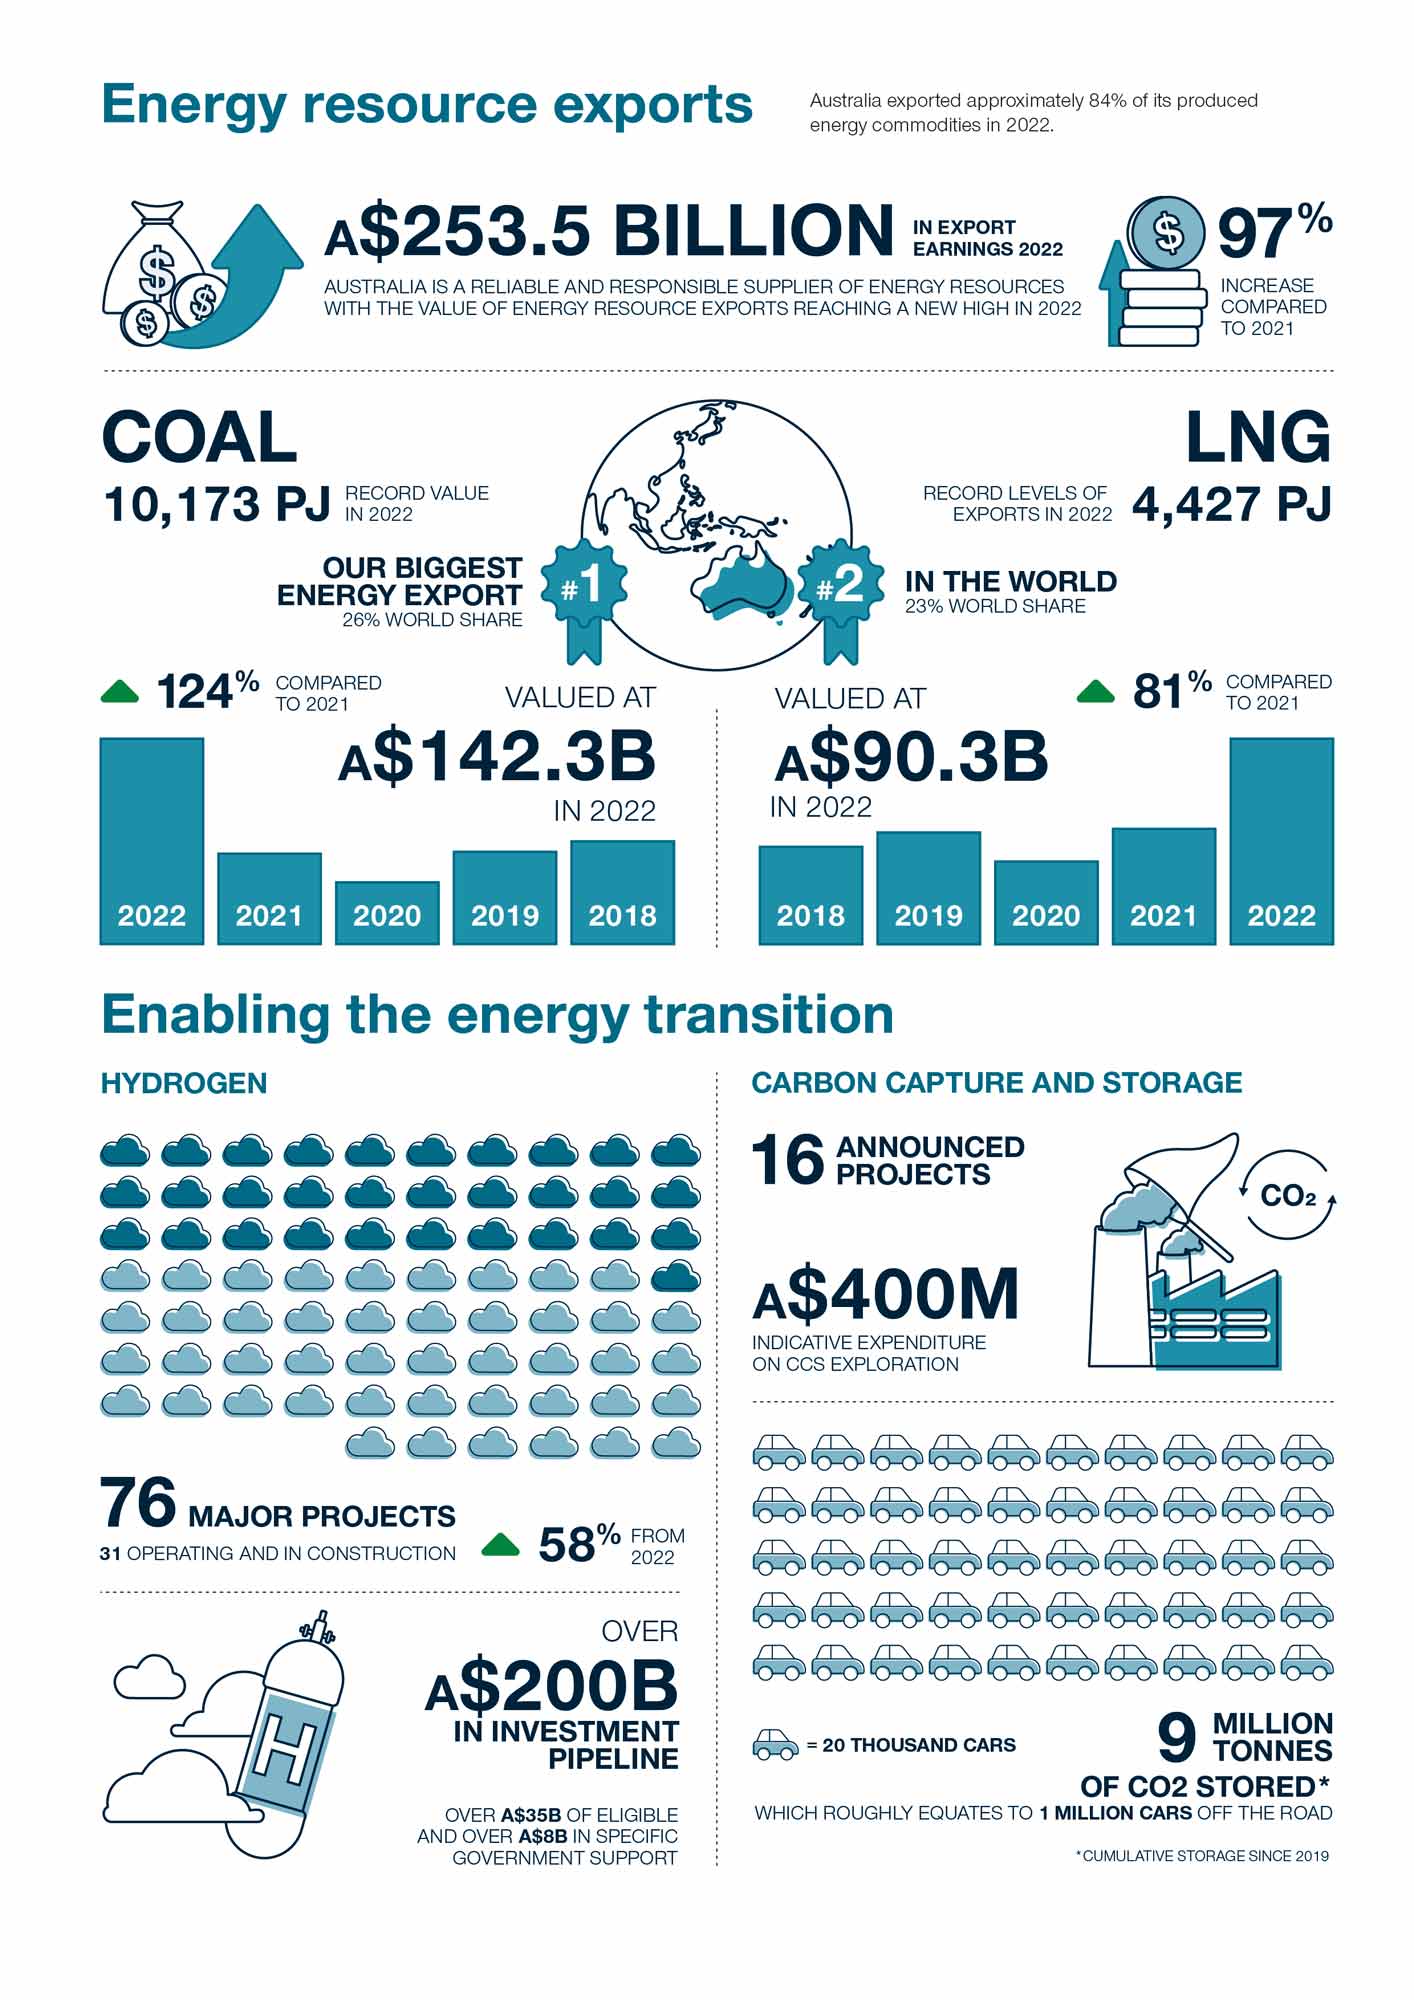
The Australian Government is committed to reaching net zero emissions by 2050, and in 2022 legislated a target of 43% reduction in emissions on 2005 levels by 2030 (DISR, 2022). In 2023, the Safeguard Mechanism was reformed to further reduce emissions limits and set a trajectory for large emitters, including for energy commodity projects, to achieve net zero emissions by 2050 (DCCEEW, 2023a). These new requirements highlight the relevance of carbon capture and storage (CCS) as well as clean hydrogen and renewable energy projects in Australia. The number of major hydrogen projects under development increased by almost 60% year on year, with over $200 billion in the investment pipeline for hydrogen and its derivatives. There are currently some 16 geological storage of carbon projects in various stages of development across Australia, mostly located in the offshore Commonwealth jurisdiction, with one operating commercial scale project that has stored more than 9 million tonnes of CO2 to date.
In addition, the 2024 edition of AECR provides information on the status of geothermal energy in Australia. Geothermal energy can be used as a heat source or to generate electricity and has the potential to support a low carbon energy future. The sector in Australia is still in the early stages of development, however the substantial increase in permit applications across the country reflects a resurgence of interest and growing recognition of the potential role for geothermal energy in Australia.
Table 1.1. Australia's total demonstrated non–renewable energy resources (2018, 2019, 2020, 2021 and 2022), production, reserves and estimated reserve life in 2022.
| Resource | Unit | Note | TDR 2018 | TDR 2019 | TDR 2020 | TDR 2021 | TDR 2022 | % TDR Growth 2021-22 | Production 2022 | % Production Growth 2021-22 | Reserves 2022 | Reserve Life 2022 |
|---|---|---|---|---|---|---|---|---|---|---|---|---|
| Crude oil | PJ | 1 | 6,474 | 5,661 | 5,205 | 4,546 | 4,791 | 5.4 | 232 | -9.9 | 1,475 | 6 |
| Condensate | PJ | 1 | 16,213 | 15,951 | 15,448 | 15,581 | 14,787 | -5.1 | 405 | -6.3 | 5,982 | 15 |
| LPG | PJ | 1 | 1,483 | 1,421 | 1,207 | 1,155 | 1,294 | 12.0 | 49 | 2.4 | 588 | 12 |
| Oil shale | PJ | 1 | 84,436 | 84,436 | 84,436 | 84,436 | 78,830 | -6.6 | 0 | na | 0 | na |
| Unconventional oil (undifferentiated) | PJ | 1 | 335 | 335 | 404 | 369 | 473 | 28.2 | 0 | na | 0 | na |
| Conventional gas | PJ | 1 | 194,239 | 196,133 | 192,252 | 187,839 | 176,710 | -5.9 | 4,800 | 5.7 | 78,061 | 16 |
| Coal seam gas | PJ | 1 | 63,732 | 58,248 | 55,131 | 57,316 | 56,348 | -1.7 | 1,562 | -3.0 | 30,859 | 20 |
| Coal seam gasification | PJ | 1 | 1,469 | 2,622 | 2,622 | 2,622 | 2,622 | 0.0 | 0 | na | 1,153 | na |
| Unconventional gas (undifferentiated) | PJ | 1 | 13,426 | 12,203 | 12,252 | 10,194 | 14,541 | 42.6 | 0 | na | 0 | na |
| Black coal | PJ | 2, 3 | 2,066,612 | 2,085,362 | 2,021,599 | 2,046,714 | 1,975,942 | -3.5 | 11,216 | -2.2 | 1,871,757 | 167 |
| Brown coal | PJ | 2, 3 | 3,293,660 | 3,240,107 | 3,247,899 | 3,247,899 | 3,247,899 | 0.0 | 416 | -3.3 | 730,660 | 1,758 |
| Uranium | PJ | 4 | 801,287 | 673,791 | 737,923 | 732,480 | 737,520 | 0.7 | 2,576 | 20.5 | 178,640 | 69 |
| Thorium | kt | 5 | 130 | 560 | 635 | 604 | 795 | 31.6 | 0 | 0.0 | 0 | na |
| Total resources | PJ | 6 | 6,543,366 | 6,376,270 | 6,376,378 | 6,391,151 | 6,311,756 | -1.2 | 21,256 | 1.6 | 2,899,176 |
Abbreviations
PJ = petajoule; TDR = total demonstrated resources; kt = thousand tonne; LPG = liquefied petroleum gas.
Notes
1. Based on the sum of 2P (proven and probable) reserves plus 2C (proven and probable) contingent resources as defined under the PRMS classification system (see Appendix 3 for further information). 2. Demonstrated recoverable coal resources. 3. Coal production data for 2022 is based on 2021-22 data published in the 2023 Australian Energy Statistics Report. 4. Recoverable resources at <US$130/kg. 5. A conversion into energy content equivalent for thorium was not available at the time of publication. 6. Excludes thorium resources. Source: Geoscience Australia, 2023; Hughes et al., 2024; Australian Energy Statistics 2023, published by the DCCEEW.
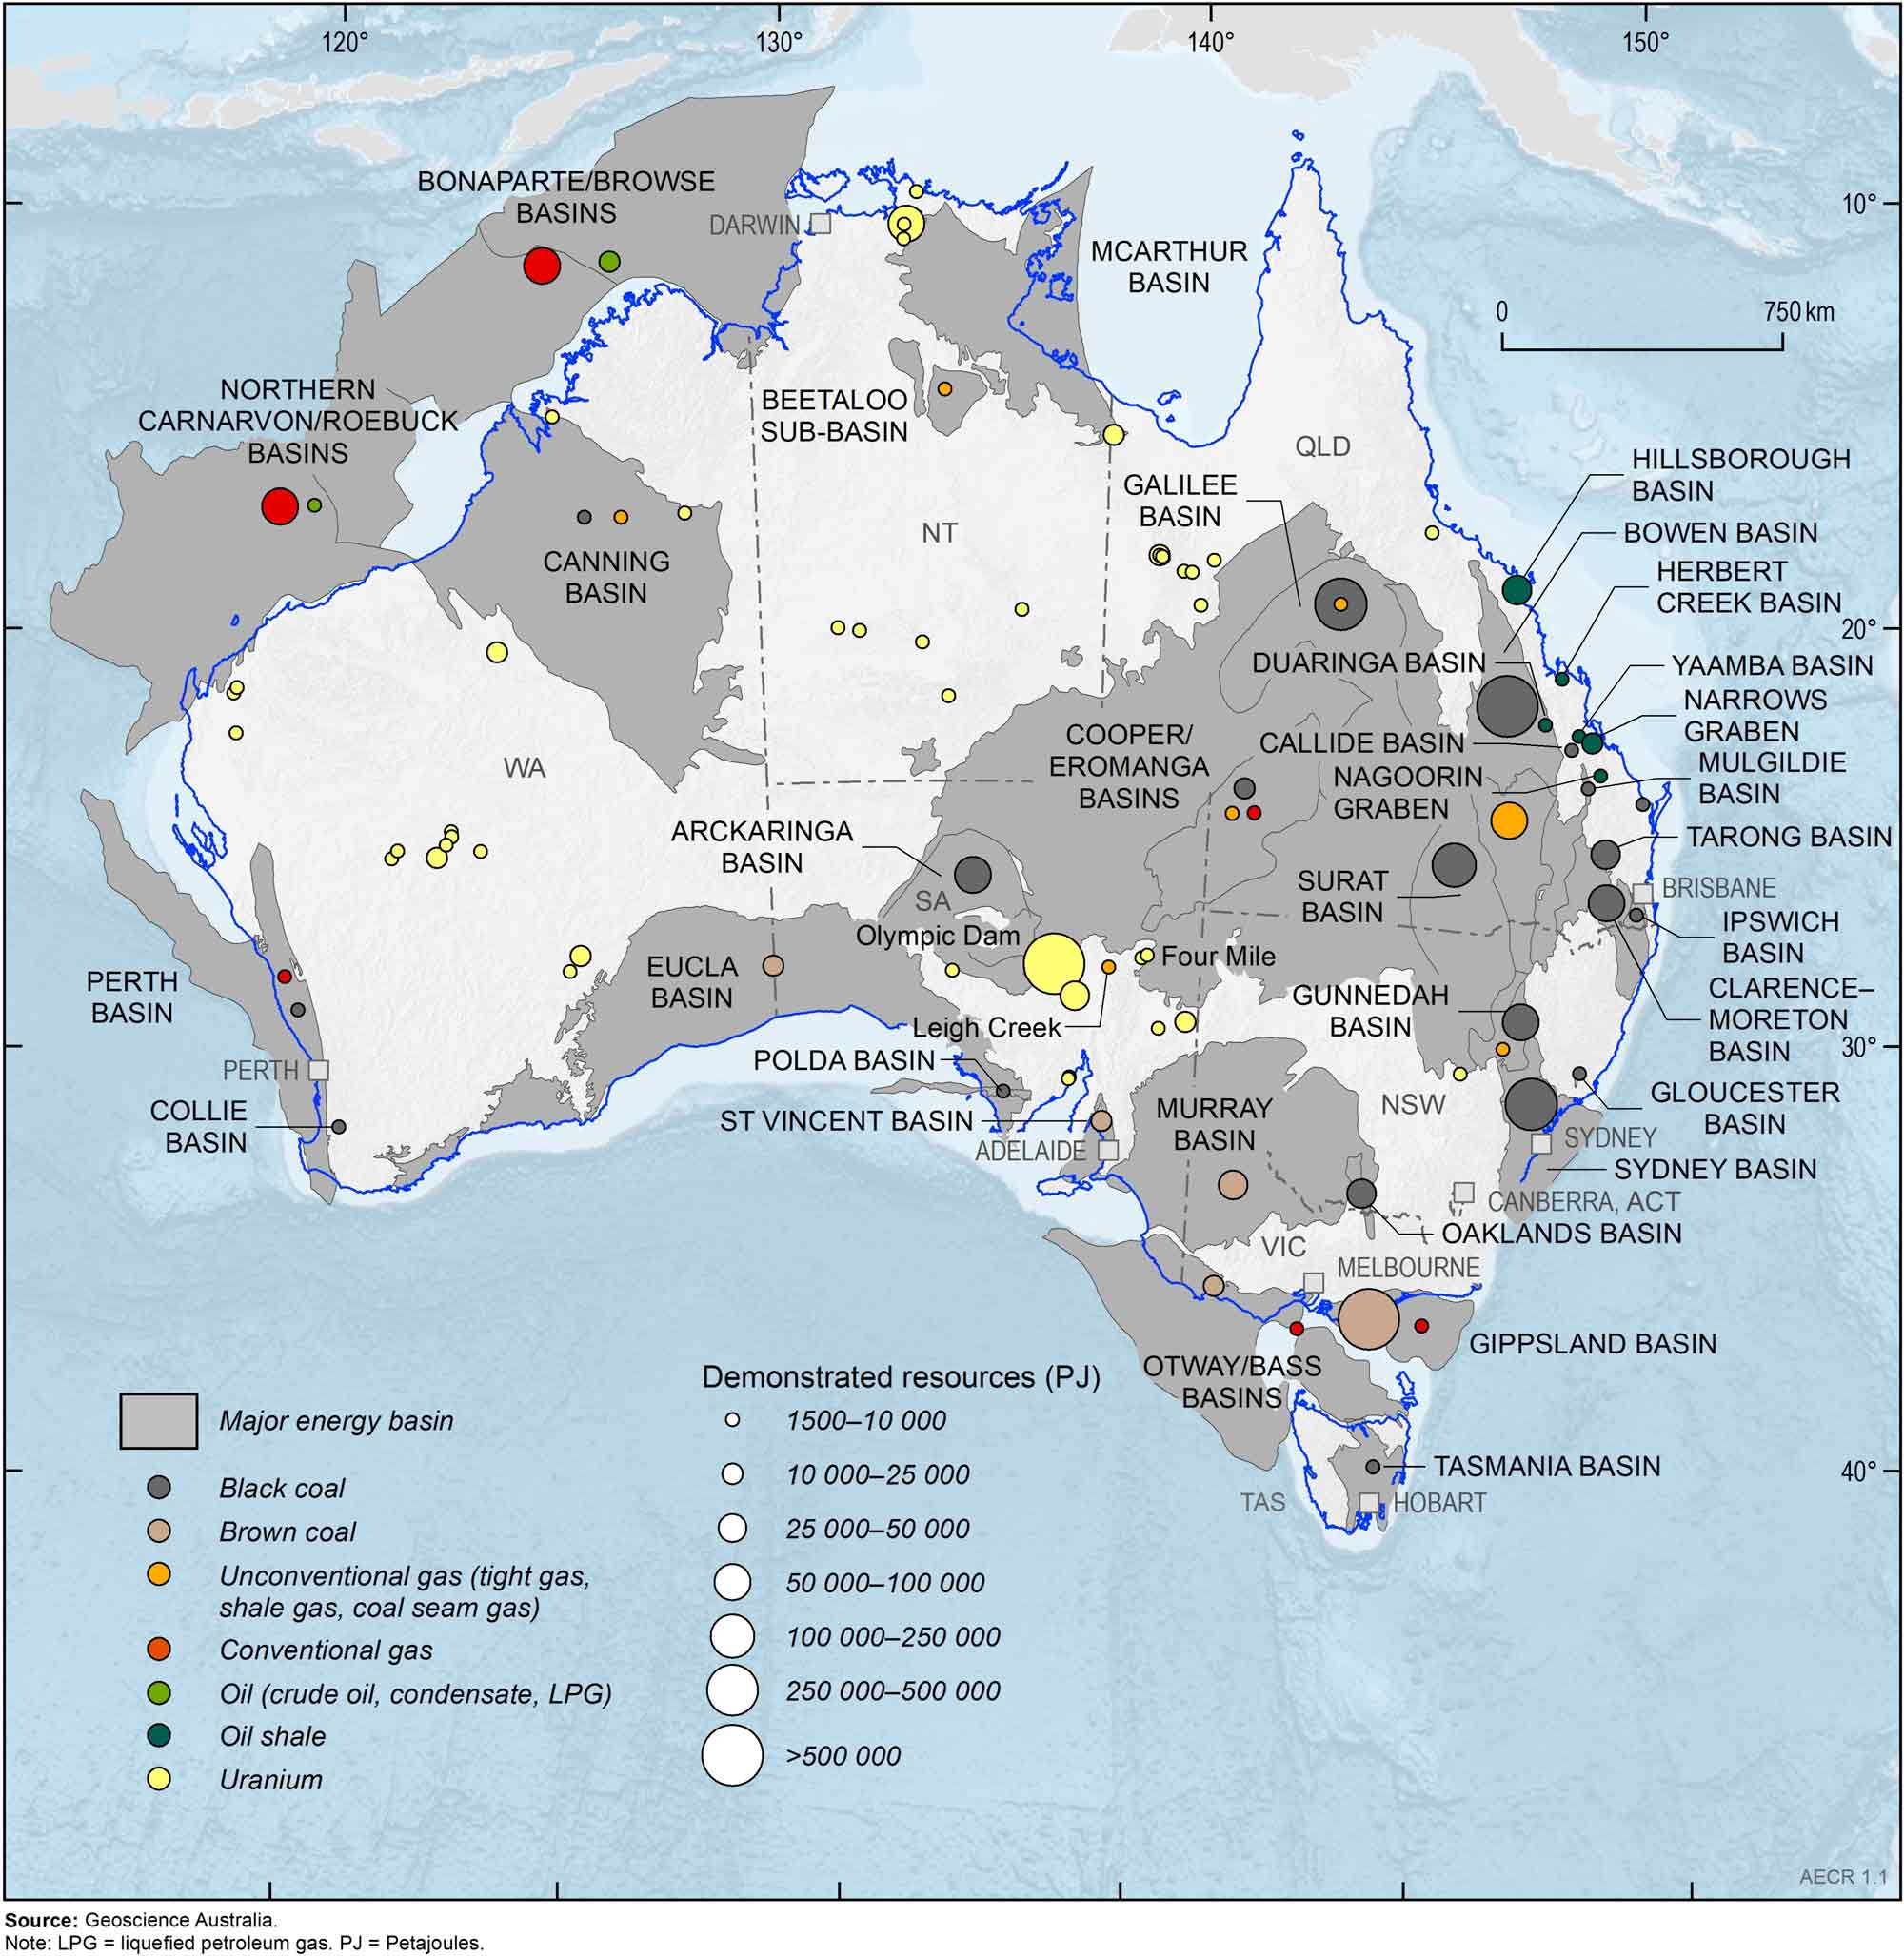
Figure 1.1. Distribution of Australia’s major non-renewable energy resources in 2022 (by basin or deposit), which contain total demonstrated resources greater than 1,500 PJ.
Box 1.1 Energy resource estimates and terminology
Estimating energy resource volumes requires a consistent approach to describing commodity reserves and resources to ensure results are reliable and easily comparable. Appendix 3 outlines the various resource classification systems used in AECR to describe the commerciality of energy resources. These systems use levels of geological knowledge and confidence to distinguish between identified and potential resources.
For the purposes of the AECR publication the following terminologies are used to describe the various energy resource classifications:
Identified resources are those for which measurements have been made to quantify their extent and grade or quality. A measurement may be, for example, a well drilled into an oil reservoir to provide a sample. The process of ‘proving’ that a resource is suitable for development is one of reducing uncertainty through the measurement of the nature of the resource, and its commercial and social viability.
‘Reserves’ and ‘economic demonstrated resources (EDR)’ are terms given to non-renewable energy resources that are known to exist in sufficient quantity and grade confirming their commercial and social viability. ‘Contingent resources’ or ‘sub economic resources’ are the terms given to resources that have been confirmed to exist but are not currently viable and/or economic to extract. Total demonstrated resources (TDR) is the sum of these two resource classes.
‘Potential resources’ are identified by indirect evidence with a high degree of uncertainty around their existence and viability. The potential resource base is often described by the terms ‘prospective’, ‘undiscovered’ or ‘inferred’. These potential resources require further exploration programs to demonstrate if a resource is present, followed by appraisal programs to determine the economic and technical viability of extracting any identified resources.
Furthermore, the resource base cannot be considered in isolation from energy conversion technologies. For example, energy security increased globally when the advancement of hydraulic fracturing technologies enabled once non-viable shale oil and shale gas resources in the US to be commercially exploited.
Estimating the resource base requires setting a cut-off grade—for example, a minimum estimated ultimate recovery of gas in a reservoir for conventional hydrocarbons or well drainage area for unconventional hydrocarbons. An energy conversion technology is implicit in this—hence, the minimum viable resource is determined not only by the inherent nature of the resource, but also by the technology available to produce it.
Due to their risk and uncertain nature, only a limited set of prospective resource estimates are published each year by energy companies. Consequently, it is not possible to provide an accurate aggregation of all prospective gas resources in Australia using published prospective resource estimates. A bibliography of all published prospective resource estimates for the 2022 reporting year accessed by Geoscience Australia is provided in Appendix 4
Mineral and petroleum energy resource estimates are often documented as industry standard measurements of volume or mass. Coal and uranium are generally measured by weight (tonnes), while oil and gas are generally measured by volume (barrels/cubic feet). However, the energy content of different energy commodities varies significantly. In this assessment, energy resource estimates have been converted to a common energy unit—petajoules (PJ)—to allow direct comparisons of different energy commodities. The Measurement and Conversion appendix (Appendix 5) provides average energy contents and conversion factors for the various energy commodities.
Estimating energy reserve life
The potential life of Australia’s non-renewable energy reserves is estimated through dividing the total remaining identified reserves by 2022 annual production rates (Table 1.1). Such estimates provide a snapshot in time that can only be used for general impressions as they are averages based on the assumption that:
- future production rates remain the same as the 2022 production rates used in the calculation.
- accumulations and deposits deemed as identified reserves in 2022 will remain so in the future and not be reclassified as identified, prospective or inferred resources; and
- depleted reserves are not replaced by new discoveries or conversion of contingent resources to reserves.
Gas resources
Gas resources
Australia has substantial conventional gas resources that are located mostly off the northwest coast of Western Australia, and significant onshore unconventional (coal seam gas, shale gas, and tight gas) resources. In 2022 Australia’s TDR for its conventional and unconventional gas is estimated at 250,221 PJ (222 trillion cubic feet [Tcf]), of which 108,920 PJ (97 Tcf) are classified as proven and probable (2P) reserves. Therefore, based on 2022 rates of production, and assuming any uncertainties associated with the development of these reserves can be addressed, current reserves equate to a theoretical total gas reserve life of about 17 years.
As at December 2022, Australia’s TDR for conventional gas is estimated to be 176,710 PJ (157 Tcf), a decrease of 5.9% from 2021. This decrease continues the trend of natural field decline seen since 2019 as conventional gas production exceeds the discovery rate for new resources.
- Based on 2022 production rates, the estimated life for Australia’s conventional gas proven and probable reserves (78,061 PJ; 69 Tcf) is 16 years.
Coal seam gas (CSG) resources are located primarily in Australia’s east in the Bowen, Surat, Galilee, Gunnedah, and Sydney basins. As of December 2022, TDR for Australia’s CSG are estimated at 56,348 PJ (50 Tcf), a decrease of 1.7% from 2021. This decline is despite a 3.7% (1,107 PJ) increase in proven and probable reserves during 2022, due to reserve upgrades in the Bowen and Surat basins.
- Based on 2022 production rates, Australia’s proven and probable reserves of CSG (30,859 PJ; 27 Tcf) has an estimated life of 20 years.
Australia’s gas resource base includes one in-situ coal seam gasification project, the Leigh Creek Energy Project. In-situ coal gasification refers to gas being extracted from coal seams by underground heating to produce synthesis gas (‘syngas’). The Leigh Creek Energy Project has an estimated TDR of 2,622 PJ (2 Tcf). There has been no change to this resource estimate from the AECR 2022 and 2023 editions, and the project is currently seeking approvals under the Environment Protection and Biodiversity Conservation Act, 1999.
Prospective shale gas, tight gas and basin centred gas resources are held in low permeability reservoirs across Australia. Most of these resources are located in the Cooper Basin, Canning Basin, Bowen/Surat basins and Beetaloo Sub-basin. In 2022, TDR for unconventional gas (excluding CSG and in-situ coal seam gasification) totalled 14,541 PJ (13 Tcf), representing a 42.6% (4,347 PJ) increase from 2021. This is due to the addition of contingent resources identified in the Beetaloo Sub-basin (1,991 PJ) and Bowen/Surat basins (2,359 PJ). There were no identified unconventional gas reserves in 2022. Due to the lack of production and a limited understanding of reserves there is no resource life estimation for these unconventional gas resources.
Oil resources
Oil resources
Australia’s conventional liquid hydrocarbon resources include crude oil, and the condensate plus liquefied petroleum gas (LPG) resources associated with gas accumulations (as phases of natural gas liquids).
As at December 2022, TDR for Australia’s crude oil is estimated to be 4,791 PJ or 815 million barrels (MMbbl). Australia’s crude oil resources are small by world standards and are being depleted at a faster rate than they are being replenished by new discoveries. Total identified crude oil resources increased by 5.4% in 2022, as a result of the addition of reserves (2P) in the Northern Carnarvon/Roebuck basins and contingent resources (2C) in the Bonaparte/Browse and Bowen/Surat basins.
- Based on 2022 production rates, the estimated life for Australia’s crude oil proven and probable reserves is 6 years.
Australia is reliant on crude oil and refined petroleum imports to meet its energy requirements, importing nearly 95% of our crude oil and refined oil products. For the supply shortage of indigenous crude oil to be addressed increased exploration of Australia’s oil-prone basins will be needed. Australia’s liquefied petroleum gas (LPG) resources are also relatively small with an estimated TDR of 1,294 PJ (307 MMbbl) in 2022, an increase of about 12% from 2021.
- Based on 2022 production rates, the remaining life for Australia’s LPG proven and probable reserves is about 12 years.
Australia has significantly more condensate than crude oil and LPG resources, with an estimated TDR of 14,787 PJ (2,515 MMbbl) in 2022, a decrease of 5% from 2021. Most condensate resources are associated with LNG projects in the Northern Carnarvon and Browse basins on the North West Shelf.
- Based on 2022 production rates, condensate proven and probable reserves have an estimated life of about 15 years.
Unconventional oil resources are currently undeveloped and include oil shale occurrences (TDR of 78,830 PJ; 13,407 MMbbl) and minor condensate and LPG associated with unconventional gas resources (TDR of 841 PJ; 146 MMbbl). Oil shale resources are exclusively located in Queensland and require mining and industrial processing to extract oil. Although minor amounts of oil shale resources were produced in the past, there are currently no identified reserves or operating projects.
Coal resources
Coal resources
Australia’s coal resources are world class in volume and quality. As at December 2022, TDR for Australia’s recoverable black and brown coal are estimated to be 5,223,841 PJ (409,562 Mt). In addition to having a large TDR of coal, Australia also has significant Inferred coal resources.
TDR for black coal is estimated to be 1,975,942 PJ (78,138 Mt). Black coal resources are found in most states, with the largest TDR in the Bowen–Surat basins in Queensland and the Sydney Basin in New South Wales. In 2022, Australia’s black coal TDR decreased by 4% and Economic Demonstrated Resources for black coal fell by 3% (Hughes et al., 2023).
- Based on 2022 production rates, the estimated reserve life for black coal is 167 years.
Australia has vast brown coal resources, although these have a much lower energy content than black coal. Brown coal TDR are estimated to be 3,247,899 PJ (331,423 Mt) and are located mainly in Victoria’s Gippsland Basin. Australia’s brown coal reserves remain unchanged since 2021 and will support over 1,750 years of production based on the very low current extraction rates.
Uranium and thorium resources
Uranium and thorium resources
More than one-third of the world’s known uranium resources are located in Australia. As at December 2022, TDR for Australia’s uranium resources are estimated to be 737,520 PJ (1,317 thousand tonnes [kt]). Although most Australian states/territories have uranium deposits, EDR are concentrated in South Australia, the Northern Territory and Western Australia. Australia’s TDR for uranium resources showed a minor increase of 0.7% in 2022.
- Based on 2022 production rates, uranium reserves have an estimated life of 70 years.
Australia also has a major share of the world’s thorium resources, which while not currently in use as an energy resource, could play a role as a nuclear energy source in the future.
Hydrogen
Hydrogen
Hydrogen is a key energy commodity for decarbonising Australia’s economy, particularly for hard-to-abate sectors. A major review of Australia’s National Hydrogen Strategy, to be released in 2024, will focus on prioritising hard-to-abate domestic sectors and supporting development of large-scale ‘green’ export industries like ammonia, iron and alumina. Investment from Australian state/territory and federal governments is increasing, with over A$8 billion of committed hydrogen specific support and over A$35 billion of hydrogen eligible support through a range of programs, including the National Reconstruction Fund (DCCEEW, 2023a).
Australia has extensive world-class renewable and non-renewable energy resources that can support the development of a new clean hydrogen industry. There is significant interest in Australia’s future hydrogen production with over A$200 billion in the investment pipeline for hydrogen and derivatives.
- The number of major clean hydrogen projects under consideration in Australia increased from 48 in 2022 to 76 in 2023.
In addition to hydrogen production, Australia is prospective for naturally occurring hydrogen resources. Although geological controls for the occurrence of this resource are not yet completely understood, exploration for hydrogen is expanding, as evidenced by the recent uptake of exploration permits targeting natural hydrogen. In 2022, Australia had an estimated 8 PJ of naturally occurring hydrogen resources.
Carbon capture and storage
Carbon capture and storage
Carbon Capture and Storage (CCS) and/or carbon capture, utilisation and storage (CCUS) is a decarbonisation tool that can be applied to prevent the release of CO2 from stationary greenhouse gas emission sources and to remove CO2 emissions directly from the atmosphere. The CCS value chain includes capturing, transporting, compressing, and injecting CO2 into deep underground geological formations where it is permanently trapped. With the world looking at CCS solutions to reach net-zero emissions by 2050, exploration and development of CCS projects are considered a key necessity for meeting Australian and global emissions reduction targets and realising a clean energy future.
The CCS landscape in Australia is continually evolving. Since 2022 to now, there has been considerable activity with respect to the legislative and regulatory frameworks that govern and enable CCS in Australia. Including the offshore Commonwealth jurisdiction, there are now frameworks enabling greenhouse gas storage in place in South Australia, Victoria, Queensland, Western Australia. Further, in 2023, the Environment Protection (Sea Dumping) Amendment (Using New Technologies to Fight Climate Change) Act 2023 came into force, providing a framework to enable the transboundary movement (international import or export) of CO2 for the purpose of sub-seabed geological storage.
Australia has one operating commercial-scale CCS facility, the Gorgon CCS Project, which as of December 2023 had stored more than 9 million tonnes of CO2. As of June 2024, there are some 15 CO2 storage projects in development across Australia, including the Moomba CCS project in South Australia that is due to begin injecting CO2 in 2024. In 2023, 10 offshore areas were released for bidding under the Commonwealth Offshore Greenhouse Gas Storage Acreage Release process and a decision on these greenhouse gas storage assessment permits is pending. This follows the award of five offshore greenhouse gas storage assessment permits in 2022, with associated work program exploration indicative expenditure totalling A$399.3 million.
- In 2022, Australia’s identified storage resources (2P capacity and 2C contingent resources) are estimated to be 403 million tonnes CO2.
Geothermal energy
Geothermal energy
Geothermal energy resources represent one of the cleanest and most reliable and essentially inexhaustible commodities for energy generation. Geothermal energy is not variable and does not require energy storage to provide a constant supply of electricity or heat. Australian geothermal installations include many ground-source heat pumps, mostly installed in the colder regions of Australia, and numerous direct-use installations, largely located in the Perth, Otway, Gippsland and Great Artesian basins.
The geothermal energy sector in Australia is in the early stages of development. The development of geothermal energy for utility-scale electricity generation has stalled but has recently experienced a resurgence of interest as evidenced by a substantial increase in permit applications right across the country.
- In 2021, the installed ‘direct use’ production capacity for Australia was 94.4 megawatts thermal. There has been a 700% increase in granted (32) and under-application (80) exploration permits in Australia since 2022.
Recent breakthroughs in geothermal technology have the potential to positively impact on the future development of geothermal energy in Australia.
Australia’s energy production and trade
Australia’s energy production and trade
The outlook for Australian energy production from gas, oil, coal and uranium is tied to global trends in demand, supply and pricing. This section provides an analysis and overview of Australia’s energy production and trade during the 2021-22 financial year. It draws on the data and information published in the Australian Energy Update (DCCEEW, 2023b), together with Resources and Energy Quarterly data published by the Office of the Chief Economist (DISR, 2023c). The statistics from the Australian Energy Update 2023, cover the period of easing restrictions due to the COVID-19 pandemic and the associated impacts on energy supply and trade.
Australia’s energy resources contribute substantially to the nation’s gross domestic product and export earnings. Energy productivity (gross domestic product ‘GDP’ divided by energy consumption) improved by 3.7% in 2021–22, and by 28% over the past ten years (DCCEEW, 2023b). Australia now creates $374 million in GDP for every petajoule of energy consumed, $83 million more than a decade ago (DCCEEW, 2023b). Approximately 84% of Australian produced energy (including uranium) was exported in 2021–22. Exports of LNG have been one of the main contributors to recent growth in our energy exports.
Australia is a net exporter of energy commodities but, notwithstanding this, it remains a net importer of oil products.
Primary energy production in Australia
Australia’s total energy production decreased by 2.5% in 2021–22 to 21,219 PJ (Table 1.2; Figure 1.2). This was largely driven by a significant reduction in uranium production. The production of coal declined slightly, while production of natural gas and LPG grew substantially. Renewable energy production continued to show significant growth.
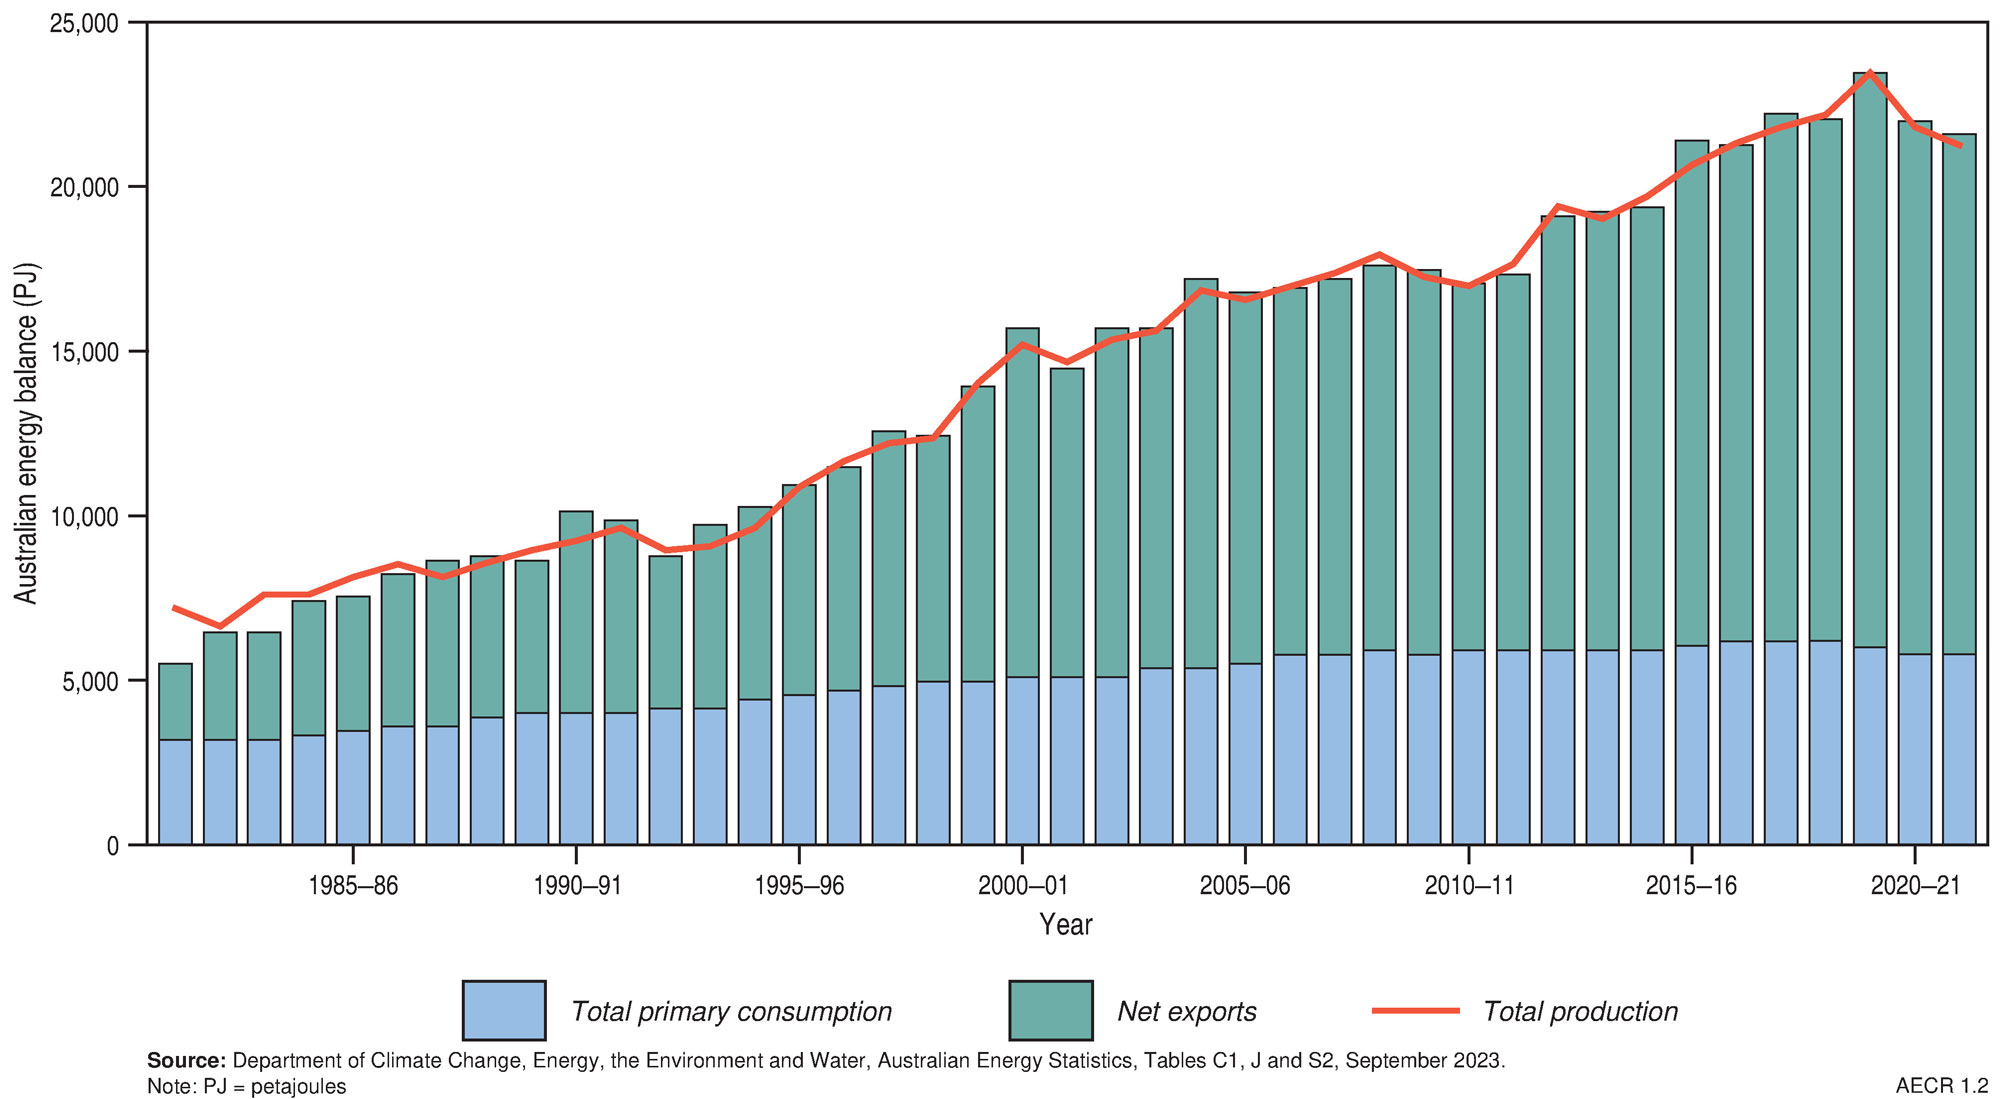
Figure 1.2. Historical trends in Australia’s energy balance, 1981–82 to 2021–22.
Table 1.2. Australian primary energy production by fuel type (2021–22).
| Energy source | Production (PJ) | Share (%) | Annual growth 2021-22 (%) | Compound annual growth 2011-12 to 2021-22 (%) |
|---|---|---|---|---|
| Energy Commodities | ||||
| Black coal | 11,216 | 52.9 | -1.3 | 1.3 |
| Brown coal | 416 | 2.0 | -3.3 | -5.7 |
| Natural gas | 6,076 | 28.6 | 6.0 | 10.9 |
| Oil, NGL | 723 | 3.4 | 0.6 | -2.0 |
| LPG | 168 | 0.8 | 14.8 | 6.7 |
| Uranium | 2,108 | 9.9 | -27.8 | -5.2 |
| Total Energy Commodities | 20,706 | 97.6 | -2.8 | 1.8 |
| Renewable Energy | 513 | 2.4 | 10.3 | 5.7 |
| Total Energy Production | 21,219 | 100.0 | -2.5 | 1.9 |
Notes
The share of production by fuel types differs from that published in the Australian Energy Statistics due to inclusion of uranium in this table. Source: DCCEEW, Australian Energy Statistics, Tables J and S2, September 2023.
Black coal production fell by 1.3% in 2021–22 to 11,216 PJ, but still remained the principal source of energy production in Australia (Figure 1.3). Production declined mostly in response to heavy rainfall and storms causing pit flooding and damaging transport infrastructure (DCCEEW, 2023b). Brown coal production dropped by 3.3% to 416 PJ—a continuation of the longer-term trend of declining brown coal production from its peak in 2009-10.
Natural gas production increased by 6.0% to 6,076 PJ in 2021–22 as it recovered from the COVID-related reduction in global demand for LNG exports and outages in LNG production at the Gorgon and Prelude facilities (DCCEEW, 2023b). About 67% of production was from conventional gas resources in Western Australia. Coal seam gas accounted for about one-quarter of Australia’s annual gas production, which was almost entirely from fields in the Bowen and Surat basins (Queensland).
Crude oil and condensate production was similar to last year with 723 PJ produced. This reflects the opposing influences of reduced crude oil production from ageing oil fields and increased condensate production associated with the rebounding natural gas production with which it is coproduced. Similarly, LPG production grew 15% to 168 PJ as a result of coproduction associated with increased gas production (DCCEEW, 2023b).
Uranium contributed 9.9% of Australia’s total primary energy production in 2021-22 at 2,108 PJ. This represents a 27.8% decline in uranium production from 2020–21 following closure of the Ranger Mine in January 2021.
Renewable energy production continued to show significant growth, increasing by 10.3% to 513 PJ, with solar and wind showing the largest increases in production.
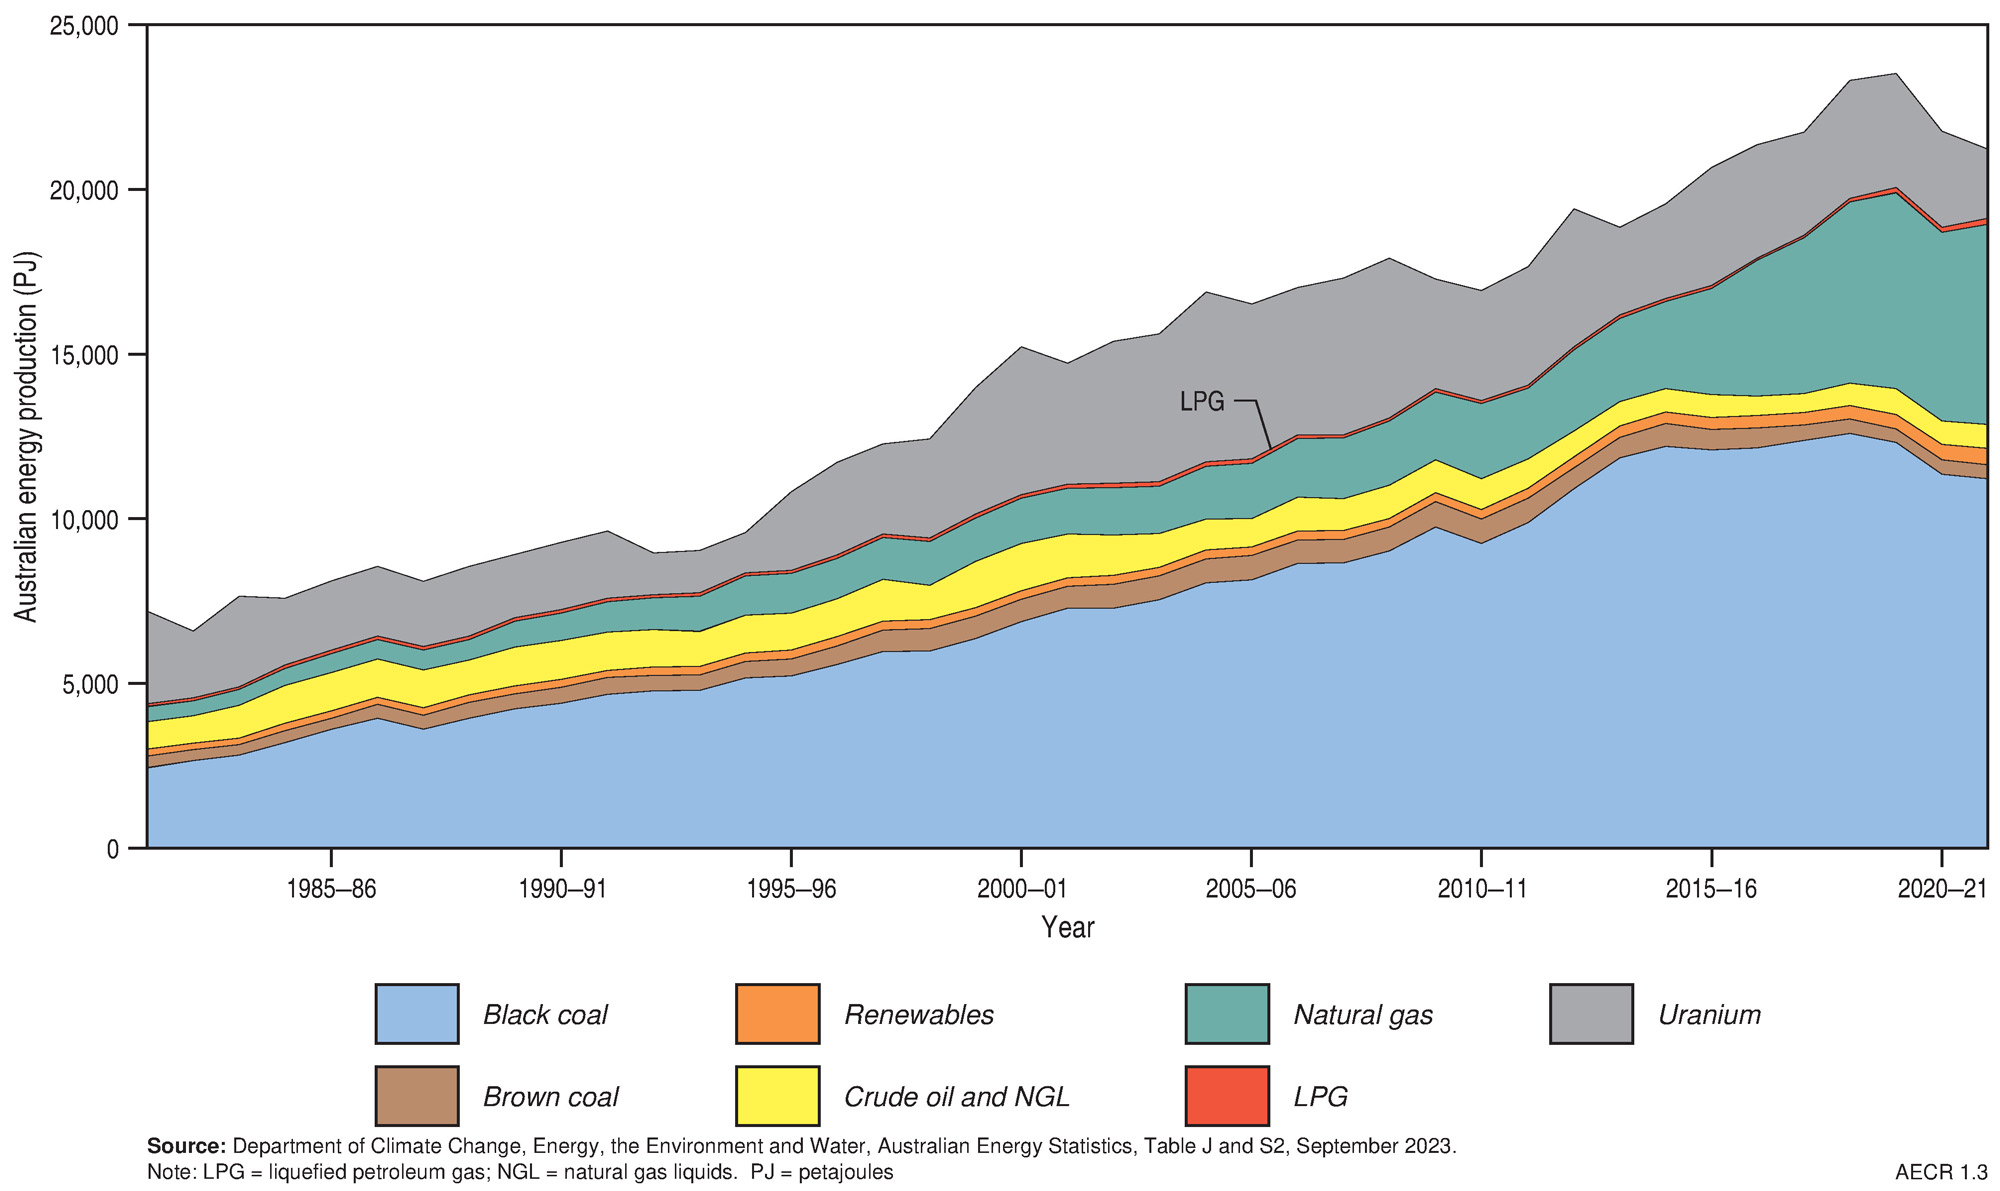
Figure 1.3. Historical trends in Australia’s energy production, by fuel type, 1981–82 to 2021–22.
Trade of Australia’s energy resources
Australia continued to be a net exporter of energy commodities, with exports exceeding imports more than eight-fold (Table 1.3; Figure 1.4; Table 1.4; Figure 1.5; Table 1.5; Figure 1.6). However, in 2021-22 Australia’s energy commodity resource trade recorded an overall decline in exports totalling 17,942 PJ (down 2.1%), going against the annual growth rate over the past decade of 2.8% (Table 1.3; Figure 1.4; Figure 1.6). Even with a decline in exports, on the back of high energy prices and a weakening Australian dollar against the US dollar during 2021-22, Australia’s energy commodity export earnings grew rapidly to a record A$204.1 billion, more than 150% growth from the A$81 billion in export earnings during the previous year (Table 1.5, Figure 1.7). Energy commodity imports also grew slightly during 2021–22 by 2,129 PJ (0.7%).
Black coal remained the dominant energy commodity exported despite a 1.5% decline in energy content, from 10,324 PJ in 2020–21 to 10,173 PJ in 2021–22 (Table 1.3). This reduction is attributed to China’s restrictions on coal imports from Australia and weather-related disruptions to production (DCCEEW, 2023b). Despite this decline in exports, associated earnings surged to A$113.8 billion from A$39.2 billion in 2020–21, a result of high black coal prices paired with a weakening Australian dollar against the US dollar. Black coal exports grew an average 1.8% per year over the last decade.
- About 90% of black coal produced in Australia was exported in 2021–22.
Table 1.3. Australian energy exports by fuel type (2021–22)
| Energy source | Exports (PJ) | Share (%) | Annual growth 2021-22 (%) | Compound annual growth 2011-12 to 2021-22 (%) |
|---|---|---|---|---|
| Black coal | 10,173 | 56.7 | -1.5 | 1.8 |
| Coal by-products | 22 | 0.1 | -2.5 | 3.1 |
| Natural gas (LNG) | 4,637 | 25.8 | 7.5 | 16.1 |
| Crude Oil and ORF | 623 | 3.5 | 5.0 | -0.3 |
| LPG | 149 | 0.8 | 15.7 | 10.1 |
| Refined Products | 19 | 0.1 | -50.5 | -8.8 |
| Uranium | 2,319 | 12.9 | -20.0 | -3.3 |
| Total | 17,942 | 100.0 | -2.1 | 2.8 |
Notes
The share of production by fuel types differs from that published in the Australian Energy Statistics due to inclusion of uranium in this table. Source: DCCEEW, Australian Energy Statistics, Table J and S2, September 2023.
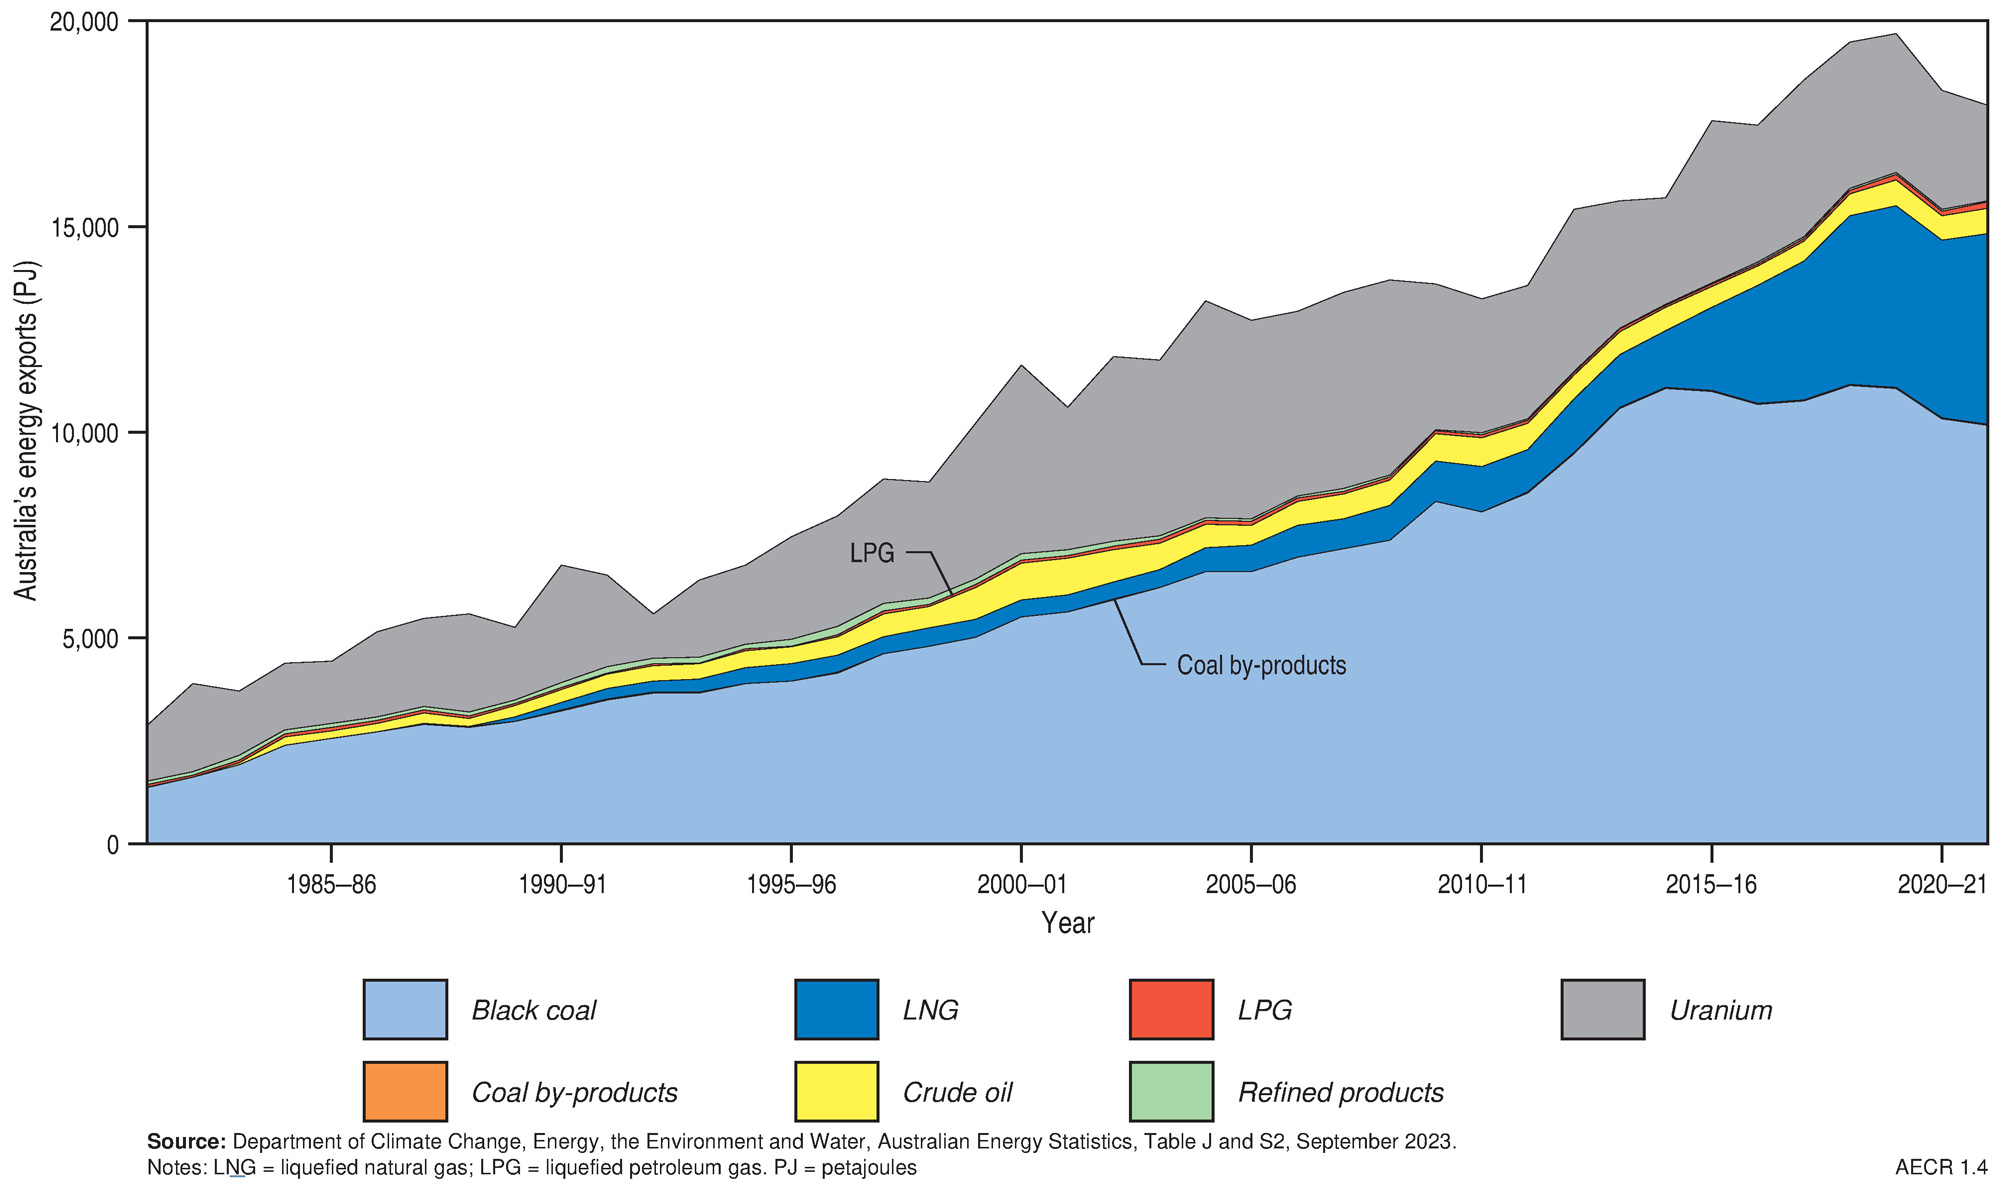
Figure 1.4. Australia’s energy exports, by fuel type, 1981–82 to 2021–22.
Australia’s LNG exports grew by 7.5% in 2021–22 to 4,637 PJ. The increase was partly due to a rebound from outage and maintenance impacts the previous year, and also driven by higher post-lockdown gas demand in Asian markets as well as disruptions to Russian exports following the invasion of Ukraine (DISR, 2022). Australia’s exports of LNG have increased an average of 16.1% a year over the past decade, with several new facilities commencing production in that period. About 76% of all natural gas produced in Australia was exported in 2021–22. LNG export earnings also grew by 131.6% in 2021–22 to a record high of A$70.6 billion as LNG prices surged as the fallout from Russia’s invasion of Ukraine ensued (DISR, 2022). The only gas Australia imported in 2020–21 was sourced from the former Joint Petroleum Development Area in the Timor Sea, which was transported and liquefied in Darwin for export.
- During 2021–22 Australia maintained its position as one of the world’s largest LNG exporters, along with Qatar and the US.
Crude oil and condensate exports also grew slightly in 2021–22 by 5.0% to 623 PJ, reflecting increased production at some LNG producing facilities (DCCEEW, 2023b). LPG exports also increased 2021–22 by 15.7% to 149 PJ. Export earnings from crude oil and condensate increased markedly by 88.7% to A$14.0 billion in 2021–22, while export earnings for LPG also increased by 9.8% to A$1.5 billion. Australia continued to import the majority of its crude oil and refined petroleum products, which totalled 1,942 PJ in 2021–22. However, during this period, crude oil imports declined significantly by 29.3%. This was in large part due to the closure of the Kwinana and Altona refineries in 2021 (DCCEEW, 2023b). Throughout 2021-22 Australia continued to export relatively light (lower density) and sweet (low sulphur) oils produced from fields on the North West Shelf to large Asian refineries and import the majority of refined petroleum products.
- In 2021–22 about 86% of all crude oil and condensate produced in Australia was exported.
Australia is a significant exporter of uranium oxide for use in nuclear power plants. However, following a decline of 14.3% in 2020—21, uranium exports decreased by a further 20% to 2,319 PJ in 2021‑‑22, reflecting the first full financial year of production following the closure of the Ranger Mine in early 2021. On average, uranium exports decreased by about 3.3 % per annum over the past decade. Export earnings for uranium decreased by 7% in 2021–22 to A$606 million (DISR, 2023a).
Table 1.4. Australian energy imports by fuel type (2021–22).
| Energy source | Imports (PJ) | Share (%) | Annual growth 2021-22 (%) | Compound annual growth 2011-12 to 2021-22 (%) |
|---|---|---|---|---|
| Coal and coal by-products | 15 | 0.7 | 22.6 | 17.3 |
| Crude Oil and ORF | 387 | 18.2 | -29.3 | -10.3 |
| LPG | 21 | 1.0 | 21.7 | -2.4 |
| Refined Products | 1,555 | 73.0 | 16.9 | 7.3 |
| Natural Gas | 152 | 7.1 | -26.7 | -2.4 |
| Total | 2,129 | 100.0 | 0.7 | 0.0 |
Notes
Source: DCCEEW, Australian Energy Statistics, Table J, September 2023.
Table 1.5. Annual value of Australian energy commodity exports by fuel type (2021–22).
| Energy source | Value (A$ billion) | Share (%) | Annual growth 2021-22 (%) | Compound annual growth 2011-12 to 2021-22 (%) |
|---|---|---|---|---|
| Crude oil and ORF | 14.0 | 6.9 | 88.7 | 1.6 |
| LPG | 1.5 | 0.7 | 9.8 | 4.5 |
| Bunker fuel | 3.1 | 1.5 | 75.9 | 6.9 |
| Other petroleum products | 0.4 | 0.2 | 14.9 | -6.7 |
| Natural gas (LNG) | 70.6 | 34.6 | 131.6 | 19.4 |
| Metallurgical coal | 67.6 | 33.1 | 191.5 | 8.2 |
| Thermal coal | 46.3 | 22.7 | 189.0 | 10.4 |
| Uranium | 0.6 | 0.3 | -6.9 | -0.7 |
| Total | 204.1 | 100.0 | 151.2 | 10.4 |
Notes
Source: DISR, Commonwealth of Australia Resources and Energy Quarterly September 2023, Table 2(2).
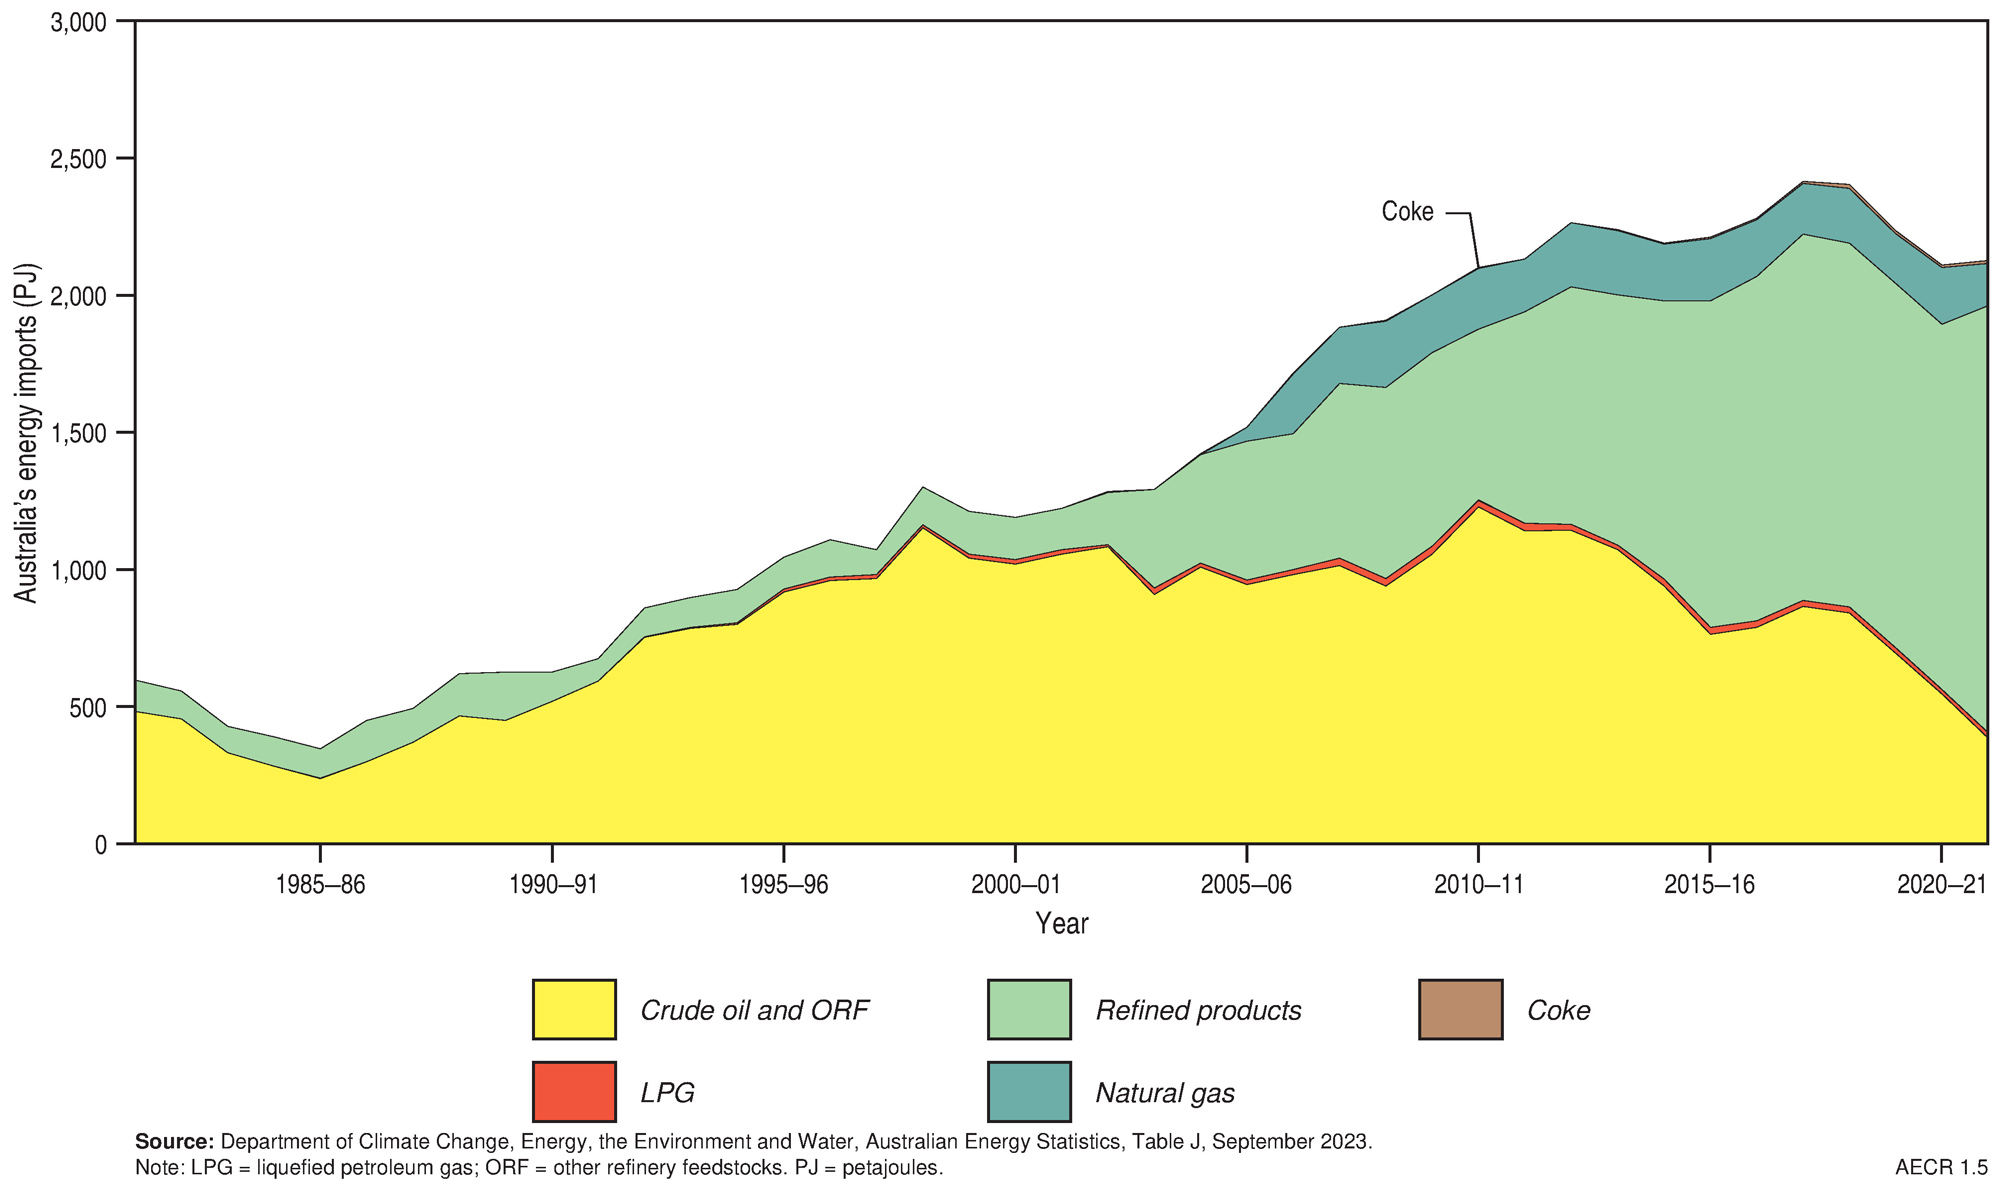
Figure 1.5. Australia’s energy imports, by fuel type, 1981–82 to 2021–22.
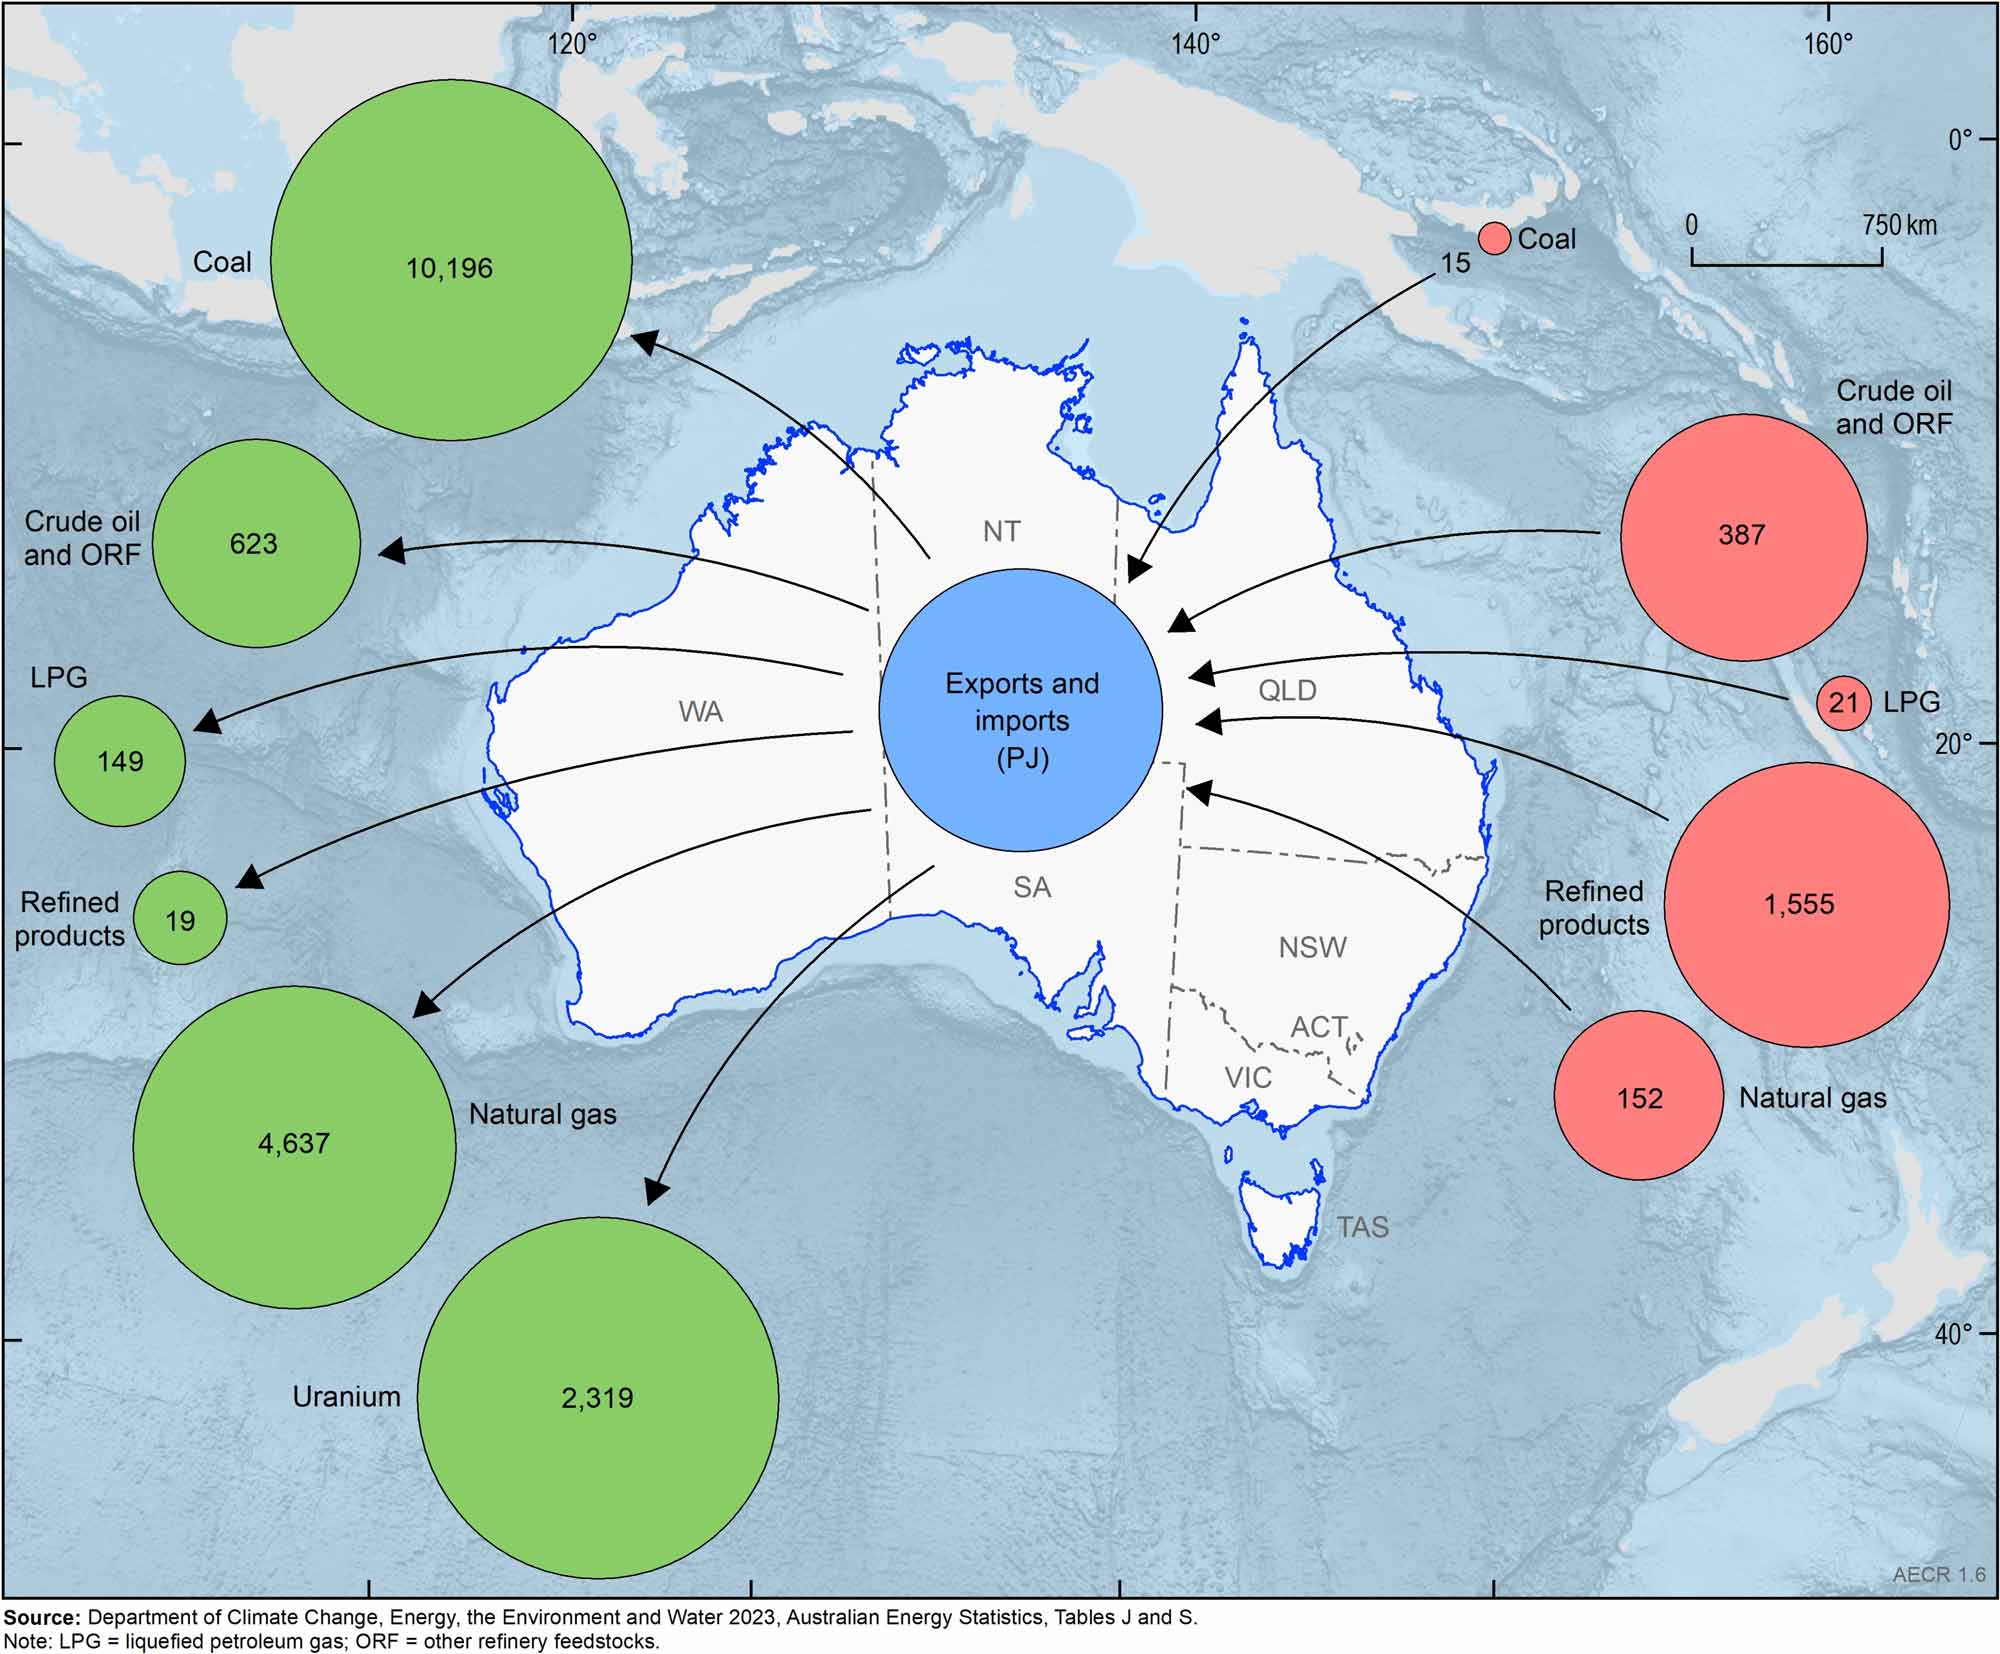
Figure 1.6. Australia’s energy trade, 2021–22.
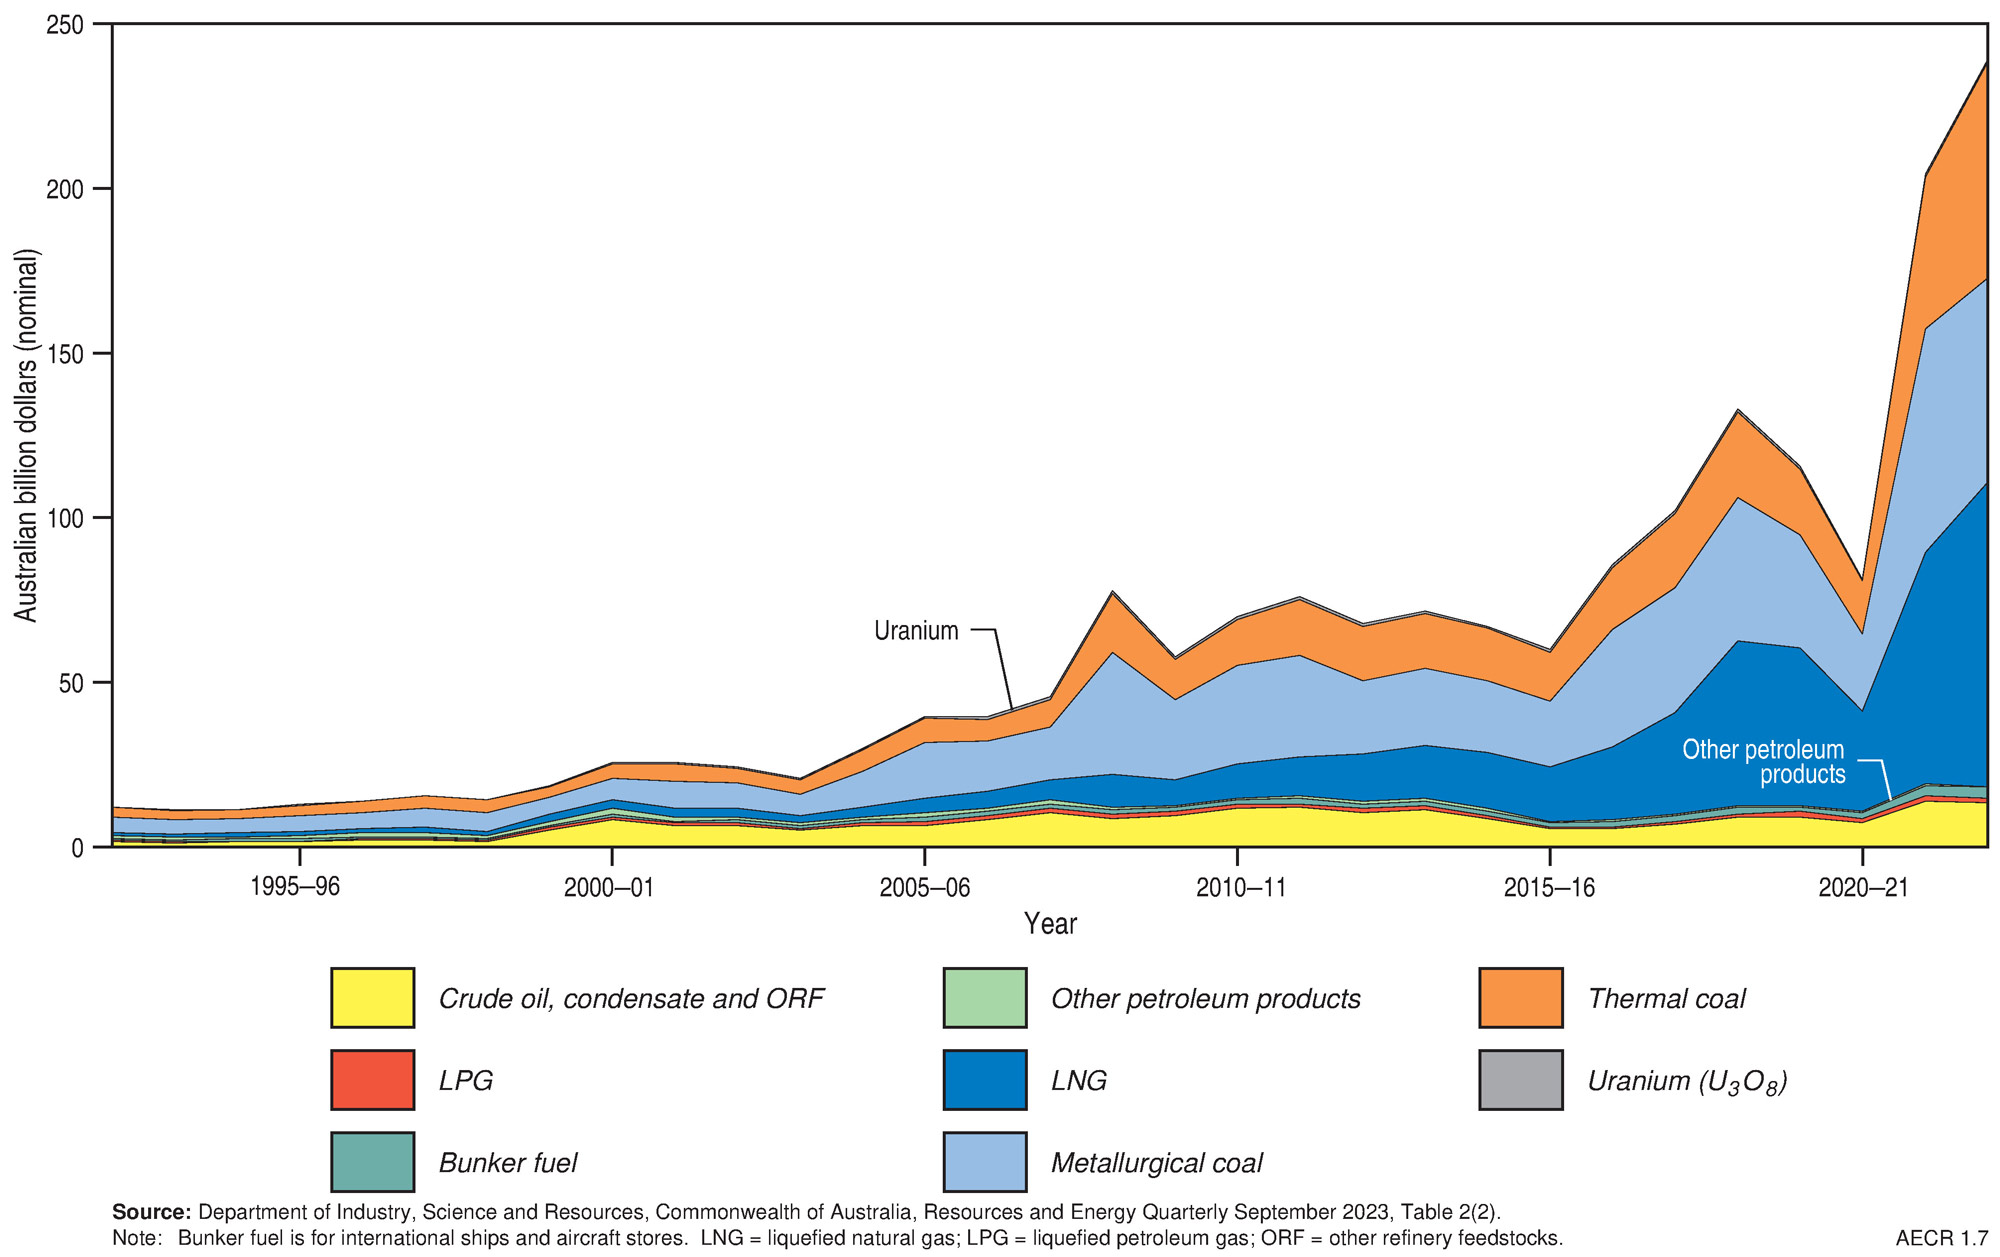
Figure 1.7. Australia’s energy exports (free on board) value by fuel type, 1992–93 to 2022–23.
Australia in the world energy market
Australia in the world energy market
Data published by the International Energy Agency (IEA), the World Nuclear Association and the Energy Institute are examined in this section to understand Australia’s role in the production of energy commodity resources and their trade in the context of world energy markets in 2020 and 2021.
The IEA provides data in their World Energy Balances Highlights (2023a) publication on primary energy production and trade for the world and selected countries during 2021. Additional historical data for countries and regions are also provided on the IEA website. Statistics on reserves, production and trade of fossil fuel resources (oil, gas and coal) for key countries and regions during 2022 are available in the Statistical Review of World Energy (Energy Institute, 2023). Uranium production data for 2021 are published by the Nuclear Energy Agency (NEA, 2023)
In 2022, global energy demand continued its long-term growth, with primary energy consumption increasing by 1.1%. Renewable energy consumption accounted for most of this increase, growing by 13% between 2021 and 2022. Overall, fossil fuel consumption grew slightly (0.5%), with a decrease in natural gas consumption offset by increases in oil and coal consumption (Energy Institute, 2023). Nuclear energy consumption also declined between 2021 and 2022, decreasing by nearly 5%.
World primary energy production
Primary energy production totalled 614,319 PJ in 2021, with about 45% of all production originating in China, the US and Russia (Table 1.6). Australia was ranked the eighth highest primary energy producer in 2021 accounting for about 2.9% (17,855 PJ) of all world energy production. Most global primary energy production was from oil (29%), coal (27%), and natural gas resources (24%; Figure 1.8).
Table 1.6. World energy production by country 2021.
| Country | Energy production (PJ) | World share (%) | Rank | Major energy resources |
|---|---|---|---|---|
| People's Republic of China | 124,867 | 20.3 | 1 | Coal, renewables |
| United States | 92,710 | 15.1 | 2 | Natural gas, crude oil/NGL/feedstock |
| aRussian Federation | 58,933 | 9.6 | 3 | Natural gas, crude oil/NGL/feedstock |
| India | 25,495 | 4.2 | 4 | Coal, renewables |
| aSaudi Arabia | 25,371 | 4.1 | 5 | Natural gas, crude oil/NGL/feedstock |
| Australia | 17,855 | 2.9 | 8 | Coal, natural gas, uranium |
| World total | 614,319 |
Notes
The IEA defines nuclear energy as the electricity produced from nuclear power plants and therefore does not include extraction of uranium resources in their energy production data. See Table 1.2 for Australia's total energy production in 2021-22 including uranium extraction. Source: IEA (2023), World Energy Balances: Overview ahttps://www.iea.org/countries
Global natural gas production was essentially flat in 2022, decreasing by 0.2% (0.3 Tcf; 346 PJ), while the share of gas in primary energy consumption decreased slightly to 24% from 25% in 2021. Gas production in Australia increased by 3.4% (0.18 Tcf; 208 PJ) during 2022—as production was less impacted by COVID-19 and by scheduled outages and maintenance and record-high utilisation rates of Australia’s West coast LNG facilities were achieved.
- At the end of 2022, globally Australia was the seventh largest natural gas producer, contributing about 3.8% to global gas production.
Global oil production increased by 4.2% (3.77 MMbbl per day; 23.2 PJ per day)) in 2022, with the largest production increases occurring in Saudi Arabia (1.18 MMbbl/d; 7.3 PJ/d), Iraq (0.42 MMbbl/d; 2.6 PJ/d), United Arab Emirates (0.38 MMbbl/d; 2.3 PJ/d), and Kuwait (0.32 MMbbl/d; 2.0 PJ/d). Oil production in Australia decreased by 6.9% (0.02 MMbbl/d; 0.1 PJ/d).
- At the end of 2022, Australia was ranked 30th in the world for oil production, contributing only 0.4% to global production.
Global production of black and brown coal increased by 7.4% (12,069 PJ) in 2022, building on the gains seen in 2022. Much of this production increase was associated with domestic consumption in China (production up by 10.5%; 8,781 PJ) and India (production up by 12.2%; 1,639 PJ), together with increased exports from Indonesia (production up by 10.0%; 1,273 PJ). Australia’s coal production decreased in 2022 by 6.1% (34 Mt; Hughes et al., 2024).
- In 2022, Australia was the world’s fifth largest producer of black and brown coal, contributing about 6.6% to global production.
In 2022, global uranium production from mines increased by 4.0% to 49,355 tonnes U (tU; 27,639 PJ). Strong increases of uranium production occurred in Canada (up 56.7%; 2,659 tU;1,489 PJ) and Australia (up 19.9%; 757 tU; 424 PJ), where production (4,555 tU, 2,551 PJ) remains well below the levels achieved prior to the 2021 Ranger Mine closure. Meanwhile, production in Kazakhstan and Namibia declined modestly (down 2.7% and 2.4%, respectively) following increases in 2021.
- During 2022, Australia was the world’s fourth largest producer of uranium, contributing about 9.2% to global production.
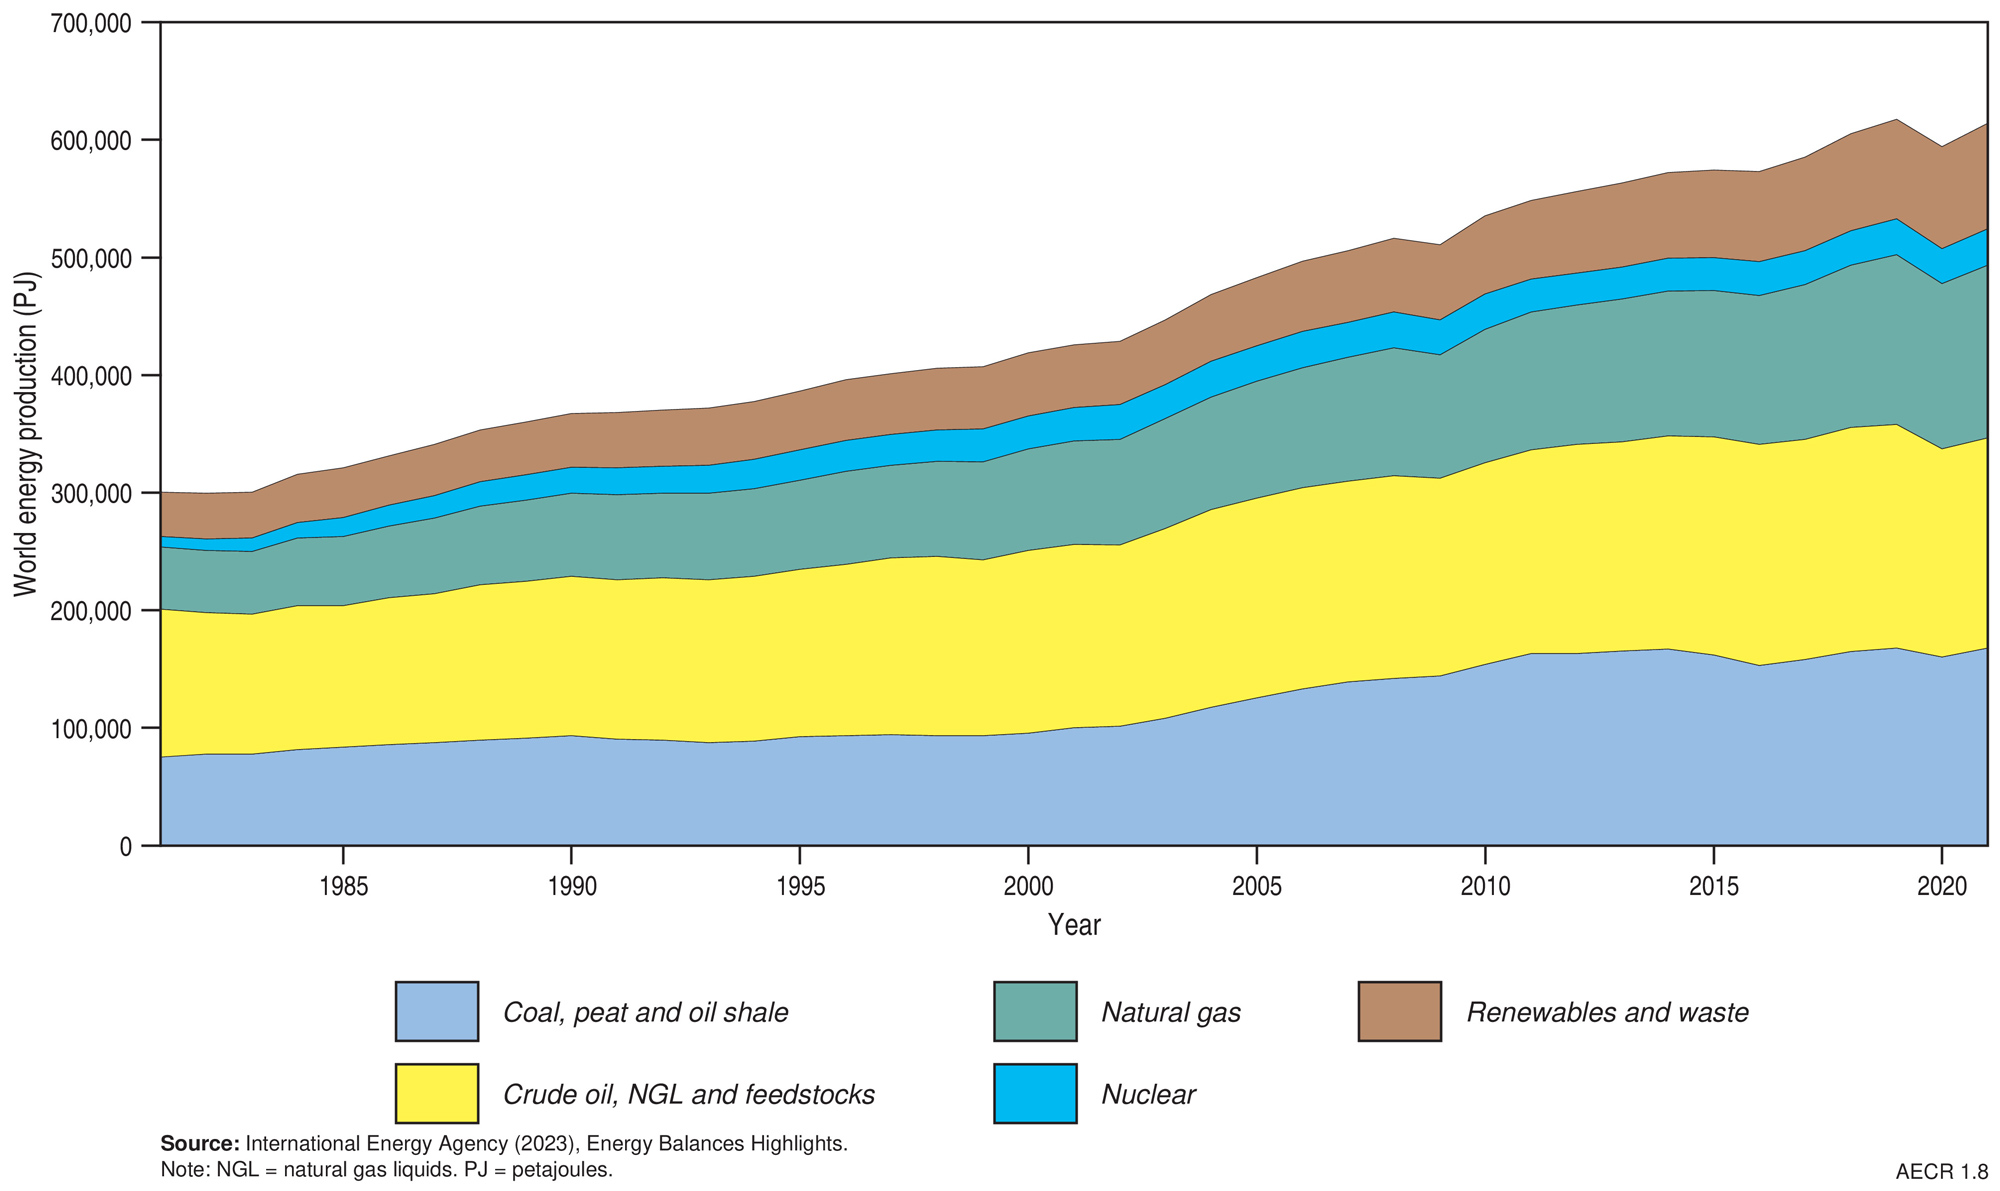
Figure 1.8. Historical trends in world primary energy production, by resource type, 1981 to 2021.
World trade
In 2021 global exports of fossil fuels totalled 227,932 PJ, and included 91,629 PJ of oil resources (40% share), 57,237 PJ of oil products (25% share), 44,628 PJ of natural gas (20% share), and 34,438 PJ of coal (15% share; Figure 1.9). About 47% of fossil fuel exports during this period originated from six countries—the Russian Federation (14.4%), the United States (10.9%), Saudi Arabia (7.7%), Australia (6.3%), Canada (5.8%) and Indonesia (4.8%; Table 1.7).
During 2021 there was a 3.4% (824 MMbbl; ~5,070 PJ) increase in the global trade of crude oil and refined products. The most significant growth in oil exports was from the Middle East (448 MMbbl; ~2,754 PJ), Saudi Arabia (399 MMbbl; ~2,455 PJ) and the US (293 MMbbl; ~1,800 PJ), while notable declines occurred in exports from Africa (229 MMbbl; ~1,407 PJ) and Europe (109 MMbbl; ~672 PJ). Australia’s oil exports experienced a 5.8% (7 MMbbl; ~42 PJ) increase in 2022.
Table 1.7. World energy exports by country in 2021.
| Country | Energy exports (PJ) | World share (%) | Rank | Major energy exports |
|---|---|---|---|---|
| Russian Federation1 | 32,774 | 14.4 | 1 | Largest natural gas exporter (pipeline & LNG) and major exporter of oil and coal |
| United States | 24,834 | 10.9 | 2 | Major exporter of oil and natural gas |
| Saudi Arabia1 | 17,464 | 7.7 | 3 | Largest oil and NGL exporter |
| Australia | 14,395 | 6.3 | 4 | Largest exporter of coal, largest exporter of LNG |
| Canada | 13,192 | 5.8 | 5 | Major exporter of oil and natural gas |
| Indonesia | 10,944 | 4.8 | 6 | Second largest coal exporter |
| World Total | 227,932 |
Notes
Includes coal, natural gas, crude oil and natural gas liquids (NGL), and oil products. Sources: IEA (2023; https://www.iea.org/countries); 1Energy Institute (2023) Statistical Review of World Energy.
In 2021, global trade of natural gas decreased by 5.1% (1.8 Tcf; ~2,054 PJ), driven by an 15.5% (2.8 Tcf; 3,115 PJ) decrease in pipeline trade. LNG supply increased by 5.2% (0.9 Tcf; 1,061 PJ), just below the 10-year average of 5.3%. Major growth in LNG exports occurred in the US (10.2%; 0.3 Tcf; 383 PJ), while Australia showed a moderate increase of 3.5% (0.1 Tcf; 151 PJ).
Australian coal exports experienced a 1% (150 PJ; 5 Mt) decline in 2021-22 as a result of regional flooding events and Chinese restrictions on Australian coal imports (DCCEEW 2023a; DISR, 2023b). During 2022, Russian coal exports continued to be affected by international sanctions and Indonesian production increased in order to meet domestic and international demand (IEA, 2023b). Australian coal exports to Japan, South Korea and Taiwan increased, exports to India fell, and exports to China ceased (DISR, 2023c).
- In 2021–22, Australia remained the world’s largest exporter of metallurgical coal and the second largest exporter of thermal coal (DISR, 2023c).
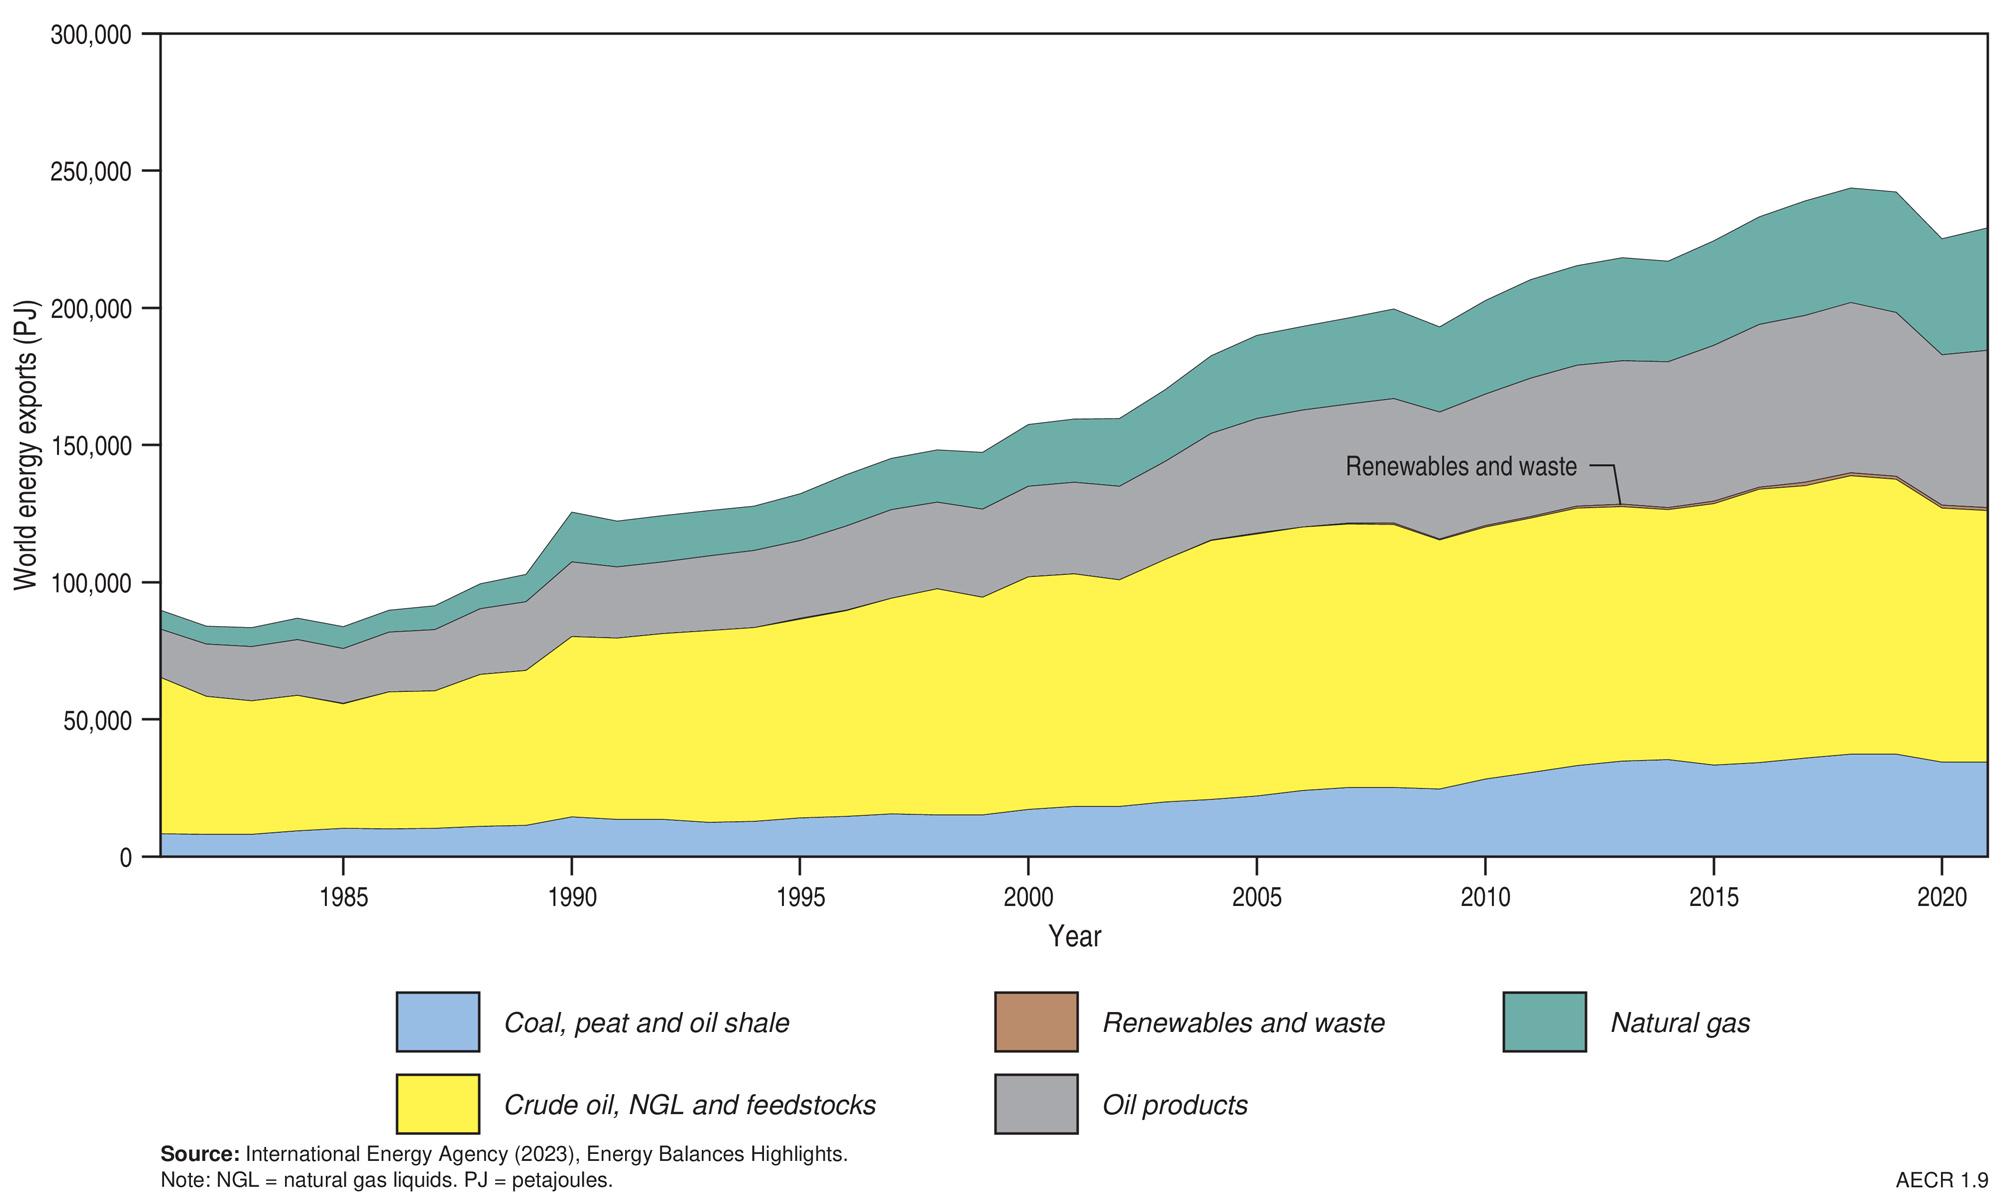
Figure 1.9. World energy exports, 1981–2021.
References
References
DCCEEW (Department of Climate Change, Energy, the Environment and Water), 2023a. HyResource - Funding. (Accessed 17 January 2024).
DCCEEW (Department of Climate Change, Energy, the Environment and Water), 2023b. Australian Energy Update 2023 (last accessed 31 March 2024).
DISR (Department of Industry, Science and Resources), 2022. Resources and Energy Quarterly, September 2022 (last accessed 22 March 2024).
DISR (Department of Industry, Science and Resources), 2023a. Resources and Energy Quarterly, September 2023 (last accessed 31 March 2024).
DISR (Department of Industry, Science and Resources), 2023b. Resources and Energy Quarterly, December 2023 (last accessed 22 March 2024).
DISR (Department of Industry, Science and Resources), 2023c. Resources and Energy Quarterly, March 2023 (last accessed 22 March 2024).
DISR (Department of Industry, Science and Resources), 2024. National Electronic Approvals Tracking System, National Offshore Petroleum and Titles Administrator (Last accessed 17 May 2024).
Energy Institute, 2023. Statistical Review of World Energy. (last accessed 22 March 2024).
Geoscience Australia, 2023. Australia’s Energy Commodity Resources, 2023 Edition. Geoscience Australia, Canberra. (last accessed 30 May 2024)
Hughes, A., Britt, A., Pheeney, J., Morfiadakis, A., Kucka, C., Colclough, H., Munns, C., Senior, A., Cross, Summerfield, D., Hitchman, A., Cheng, Y., Walsh, J., Thorne, J. and Sexton, M., 2024. Australia's Identified Mineral Resources 2023. Geoscience Australia, Canberra.
IEA (International Energy Agency), 2023a. World Energy Balances: Overview (last accessed 1 May 2024).
IEA (International Energy Agency), 2023b. Coal 2023 Analysis and forecast to 2026 (last accessed 22 March 2024).
NEA (Nuclear Energy Agency), 2023, Uranium 2022: Resources, Production and Demand, OECD Publishing, Paris (last accessed 30 May 2024)
Data download
Data download
Australia's Energy Commodity Resources Data Tables - 2022 reporting period