Australia's Energy Commodity Resources 2024 Uranium and Thorium
Page last updated:15 July 2024
Uranium and Thorium
Summary statistics for Uranium, 2022.
|
TDR 737,508 PJ ( 0.7%) | |
|
EDR 692,160 PJ ( 0.7%) |
|
Production 2,551 PJ ( 20%) | |
|
Export Income $0.7 b ( 60%) |
|
Production World Ranking 4 (9%) | |
|
Export World Ranking 4 (11%) |
Abbreviations:
TDR – Total Demonstrated Resources; EDR – Economic Demonstrated Resources; PJ – petajoules; $b – billion dollars (Australian). Percentage increases or decreases are in relation to 2021. World rankings are followed by percentage share in brackets.
Key messages
Key messages
- Australia has the world’s largest Economic Demonstrated Resources of uranium and in 2022 was the world’s 4th largest uranium producer. Australia has no commercial nuclear power plants and has very limited domestic uranium requirements.
- Australia exports all its uranium production to countries which have signed bilateral safeguards agreement which ensures that Australian uranium is only used for peaceful purposes and does not contribute to any military applications.
- Australia’s average annual export volume of uranium for the last 10 years is approximately 5,464 tonnes of uranium (tU). However, in the medium term, Australia’s uranium exports are predicted to drop by approximately 20% due to the Ranger Mine ceasing operations in January 2021.
- Thorium has been used previously in the nuclear generation process, but its use is still largely experimental and there is no current commercial market for thorium.
- Thorium is not produced in Australia and production on a large scale is unlikely in the immediate future.
- Australia has widespread uranium- and thorium-bearing mineral deposits and has been involved in the uranium industry from its beginnings. The Olympic Dam Mine in South Australia remains the world’s largest deposit of uranium.
- In January 2021, after 40 years of operation, the historic Ranger Mine ceased production. Producing approximately 112,000 tU (132,000 tonnes U3O8), it stands as Australia’s largest uranium producer.
- As at 31 December 2022, Australia has the world’s largest Economic Demonstrated Resources (EDR) of uranium—1,236 thousand tonnes of uranium (ktU; 692,160 petajoules [PJ])—and in 2022 was the world’s 4th largest producer of uranium, behind Kazakhstan, Canada and Namibia.
- In 2022, Australia had two producing uranium mines: Olympic Dam and Four Mile, both in South Australia. The Honeymoon Mine (Boss Energy) in South Australia, which has been in care and maintenance since 2013, has announced plans to re-start uranium mining operations in 2024.
- At present, Australian commonwealth legislation does not permit the establishment of a nuclear power industry in Australia.
Australia’s identified resources
Australia’s identified resources
Uranium
In its native form, Uranium is a slightly radioactive element that is widespread at levels of 1–4 parts per million (ppm) in the Earth’s crust. Concentrations of uranium-rich minerals, such as uraninite, carnotite and brannerite, can form economically recoverable deposits. The majority of Australia's uranium occurs in four main types of deposit: iron oxide breccia complexes, unconformity-related accumulations, sandstone-hosted resources and palaeochannel/calcrete-style resources.
Once mined, uranium is processed into uranium oxide (U3O8), also referred to as uranium oxide concentrate and is exported in this form. Natural uranium (from mine production) contains approximately 0.7% of the uranium isotope 235U and 99.3% 238U.
As at December 2022, Australia’s Economic Demonstrated Resource (EDR) for uranium was 1,236 ktU (692,160 PJ). An additional 81 ktU (45,360 PJ) was classified as Subeconomic Demonstrated Resources and 618 ktU (346,223 PJ) as Inferred Resources. Australia’s total Identified Resources were 1,935 ktU (1,083,731 PJ). Although most Australian states and territories host uranium deposits, EDR are concentrated in South Australia, the Northern Territory and Western Australia (Figure 5.1). South Australia’s Olympic Dam is the world’s largest uranium deposit, with an EDR of 987 ktU (553,219 PJ).
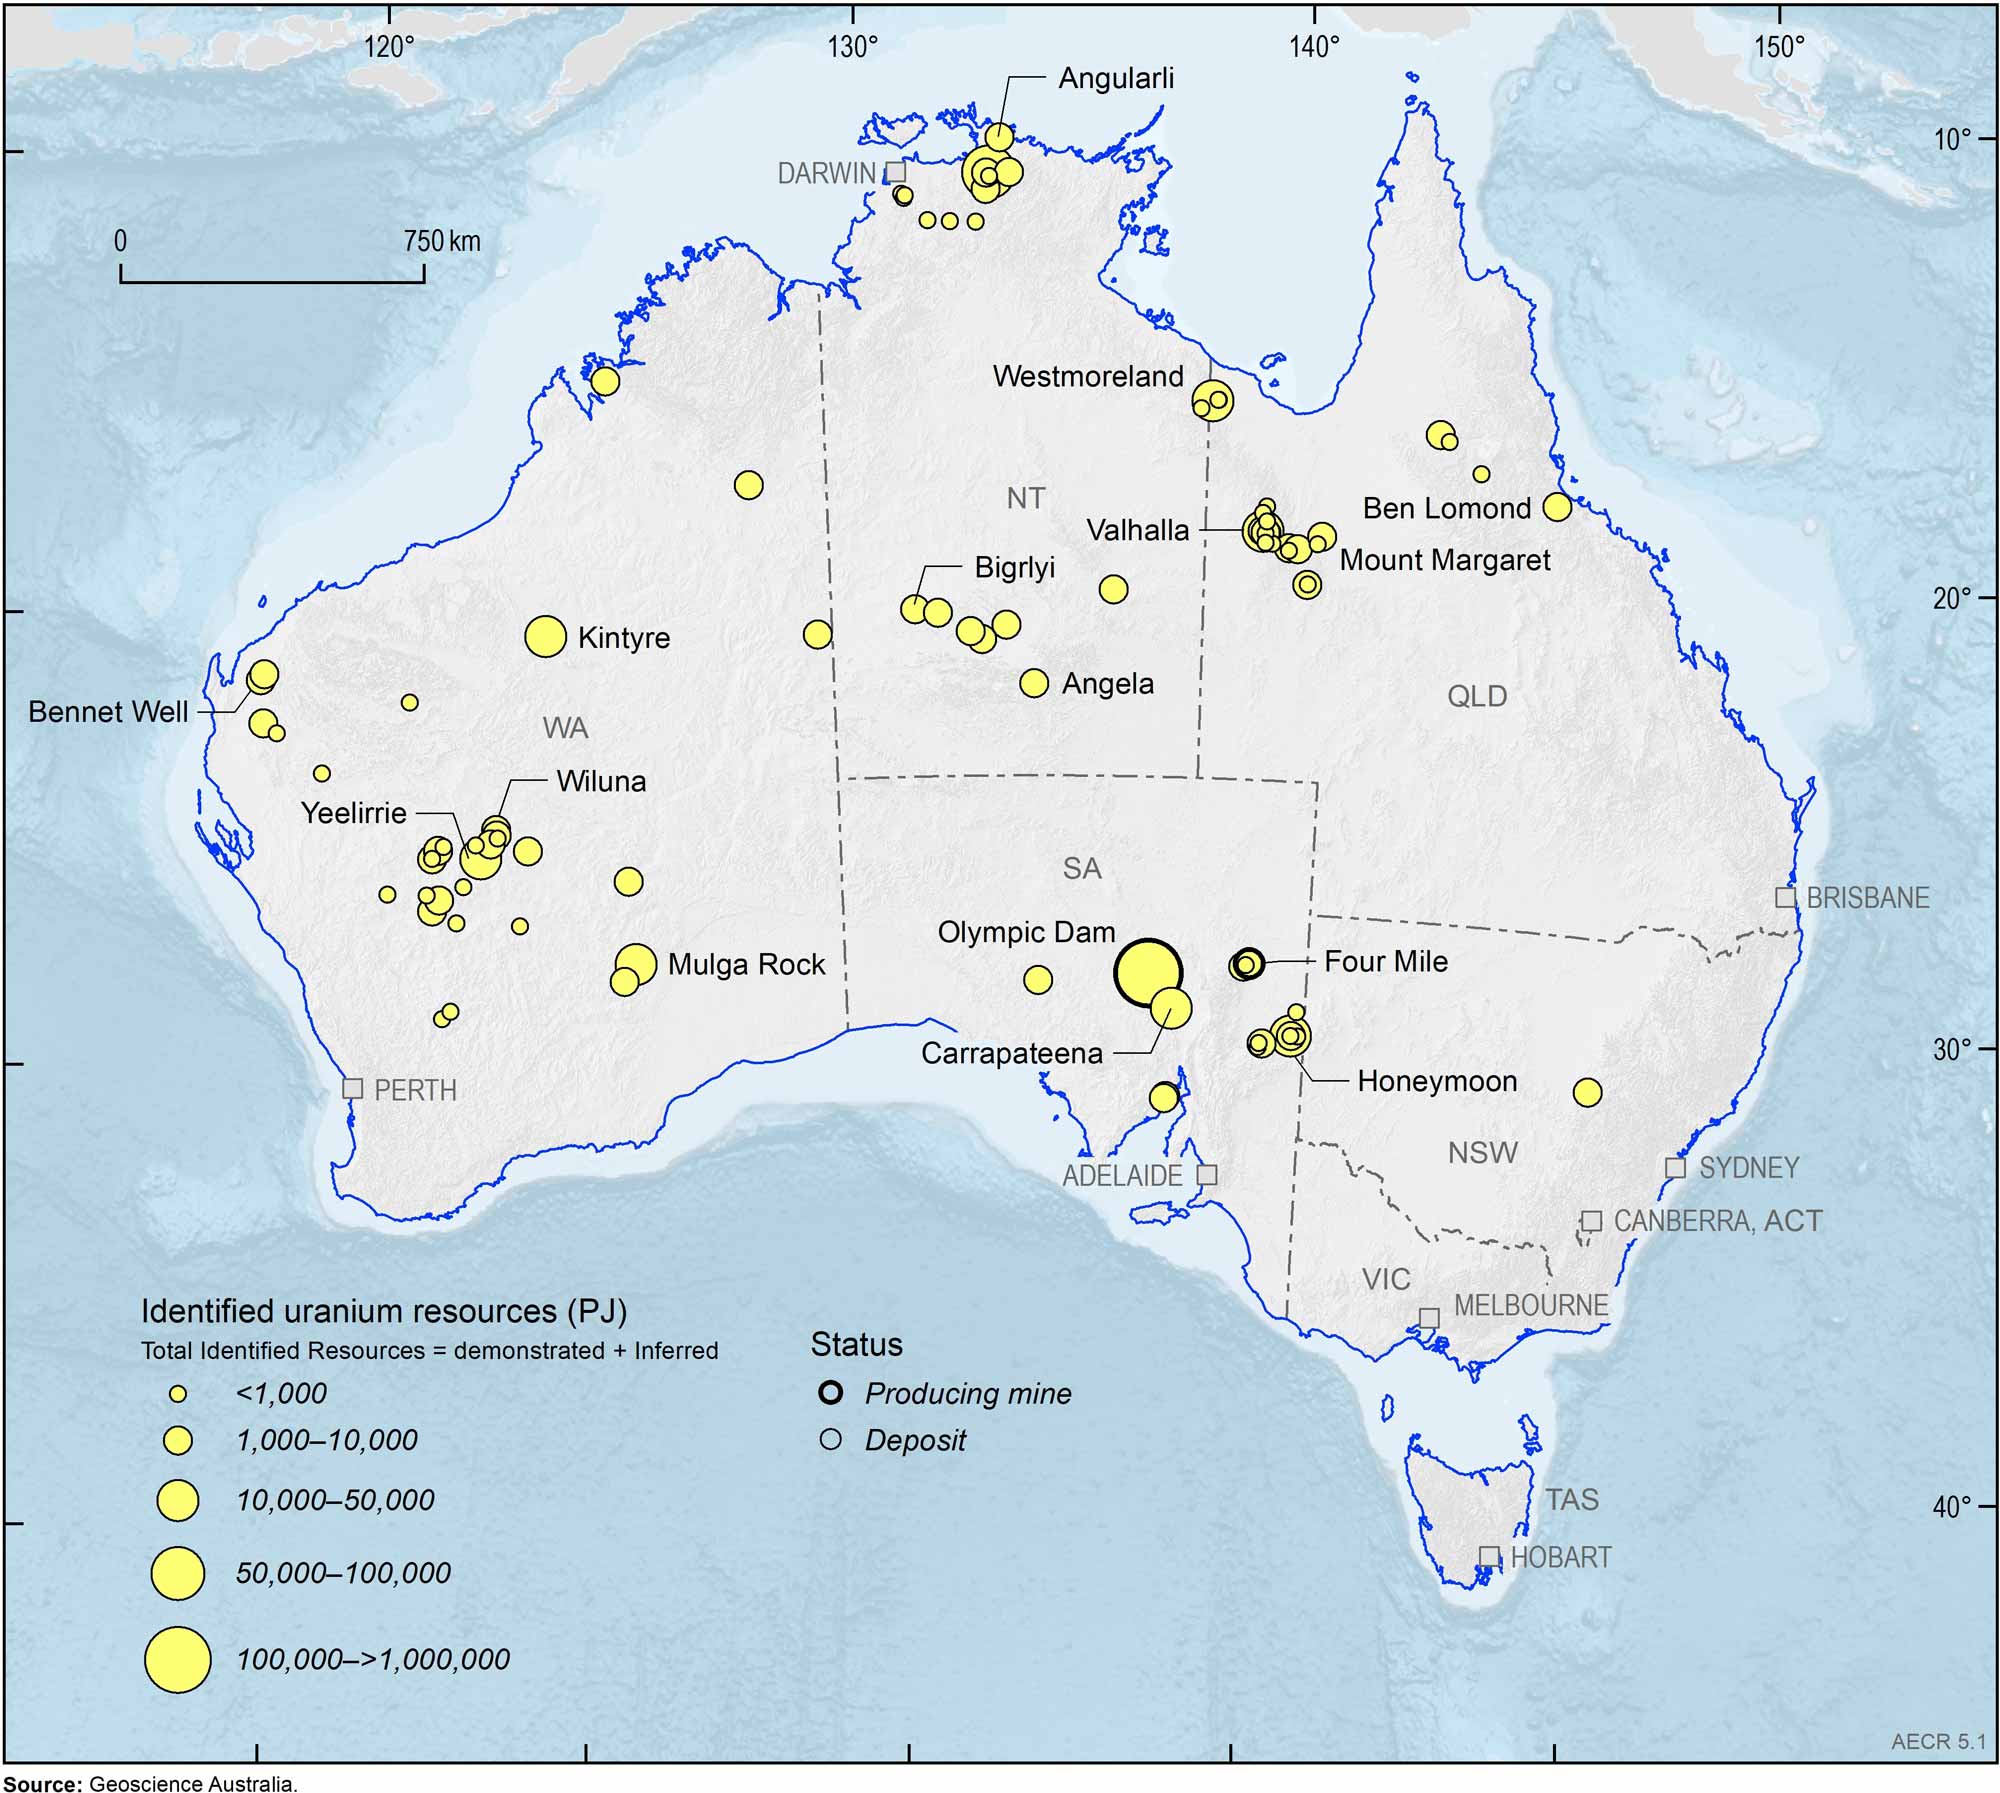
Figure 5.1. Australia’s identified uranium resources by deposit (PJ), 2022.
Thorium
Thorium is a naturally occurring slightly radioactive metal that is three to five times more abundant in the Earth’s crust than uranium. It is less conducive to nuclear weapons proliferation and due to its greater energy-producing efficiency, generates substantially less radioactive waste. The most common source of thorium is monazite, a rare earth phosphate mineral that is a minor constituent of heavy mineral sand (HMS) deposits. On average, monazite contains approximately 6% thorium and 60% rare earth elements.
In Australia, approximately 80% of thorium resources are contained in HMS deposits; the remaining 20% are in rare earth element hard-rock deposits (Figure 5.2). Monazite and thorium resources are not generally published and so Geoscience Australia estimates the monazite (and hence thorium) content in deposits and classifies these estimated resources as Inferred Resources. Using this approach, Geoscience Australia estimates that Australia’s total identified in situ thorium resources were approximately 1,435 kt as of 31 December 2022.
Currently, no thorium is produced in Australia. Although HMS deposits containing monazite are currently being mined, the thorium is not recovered due to the lack of a thorium market.
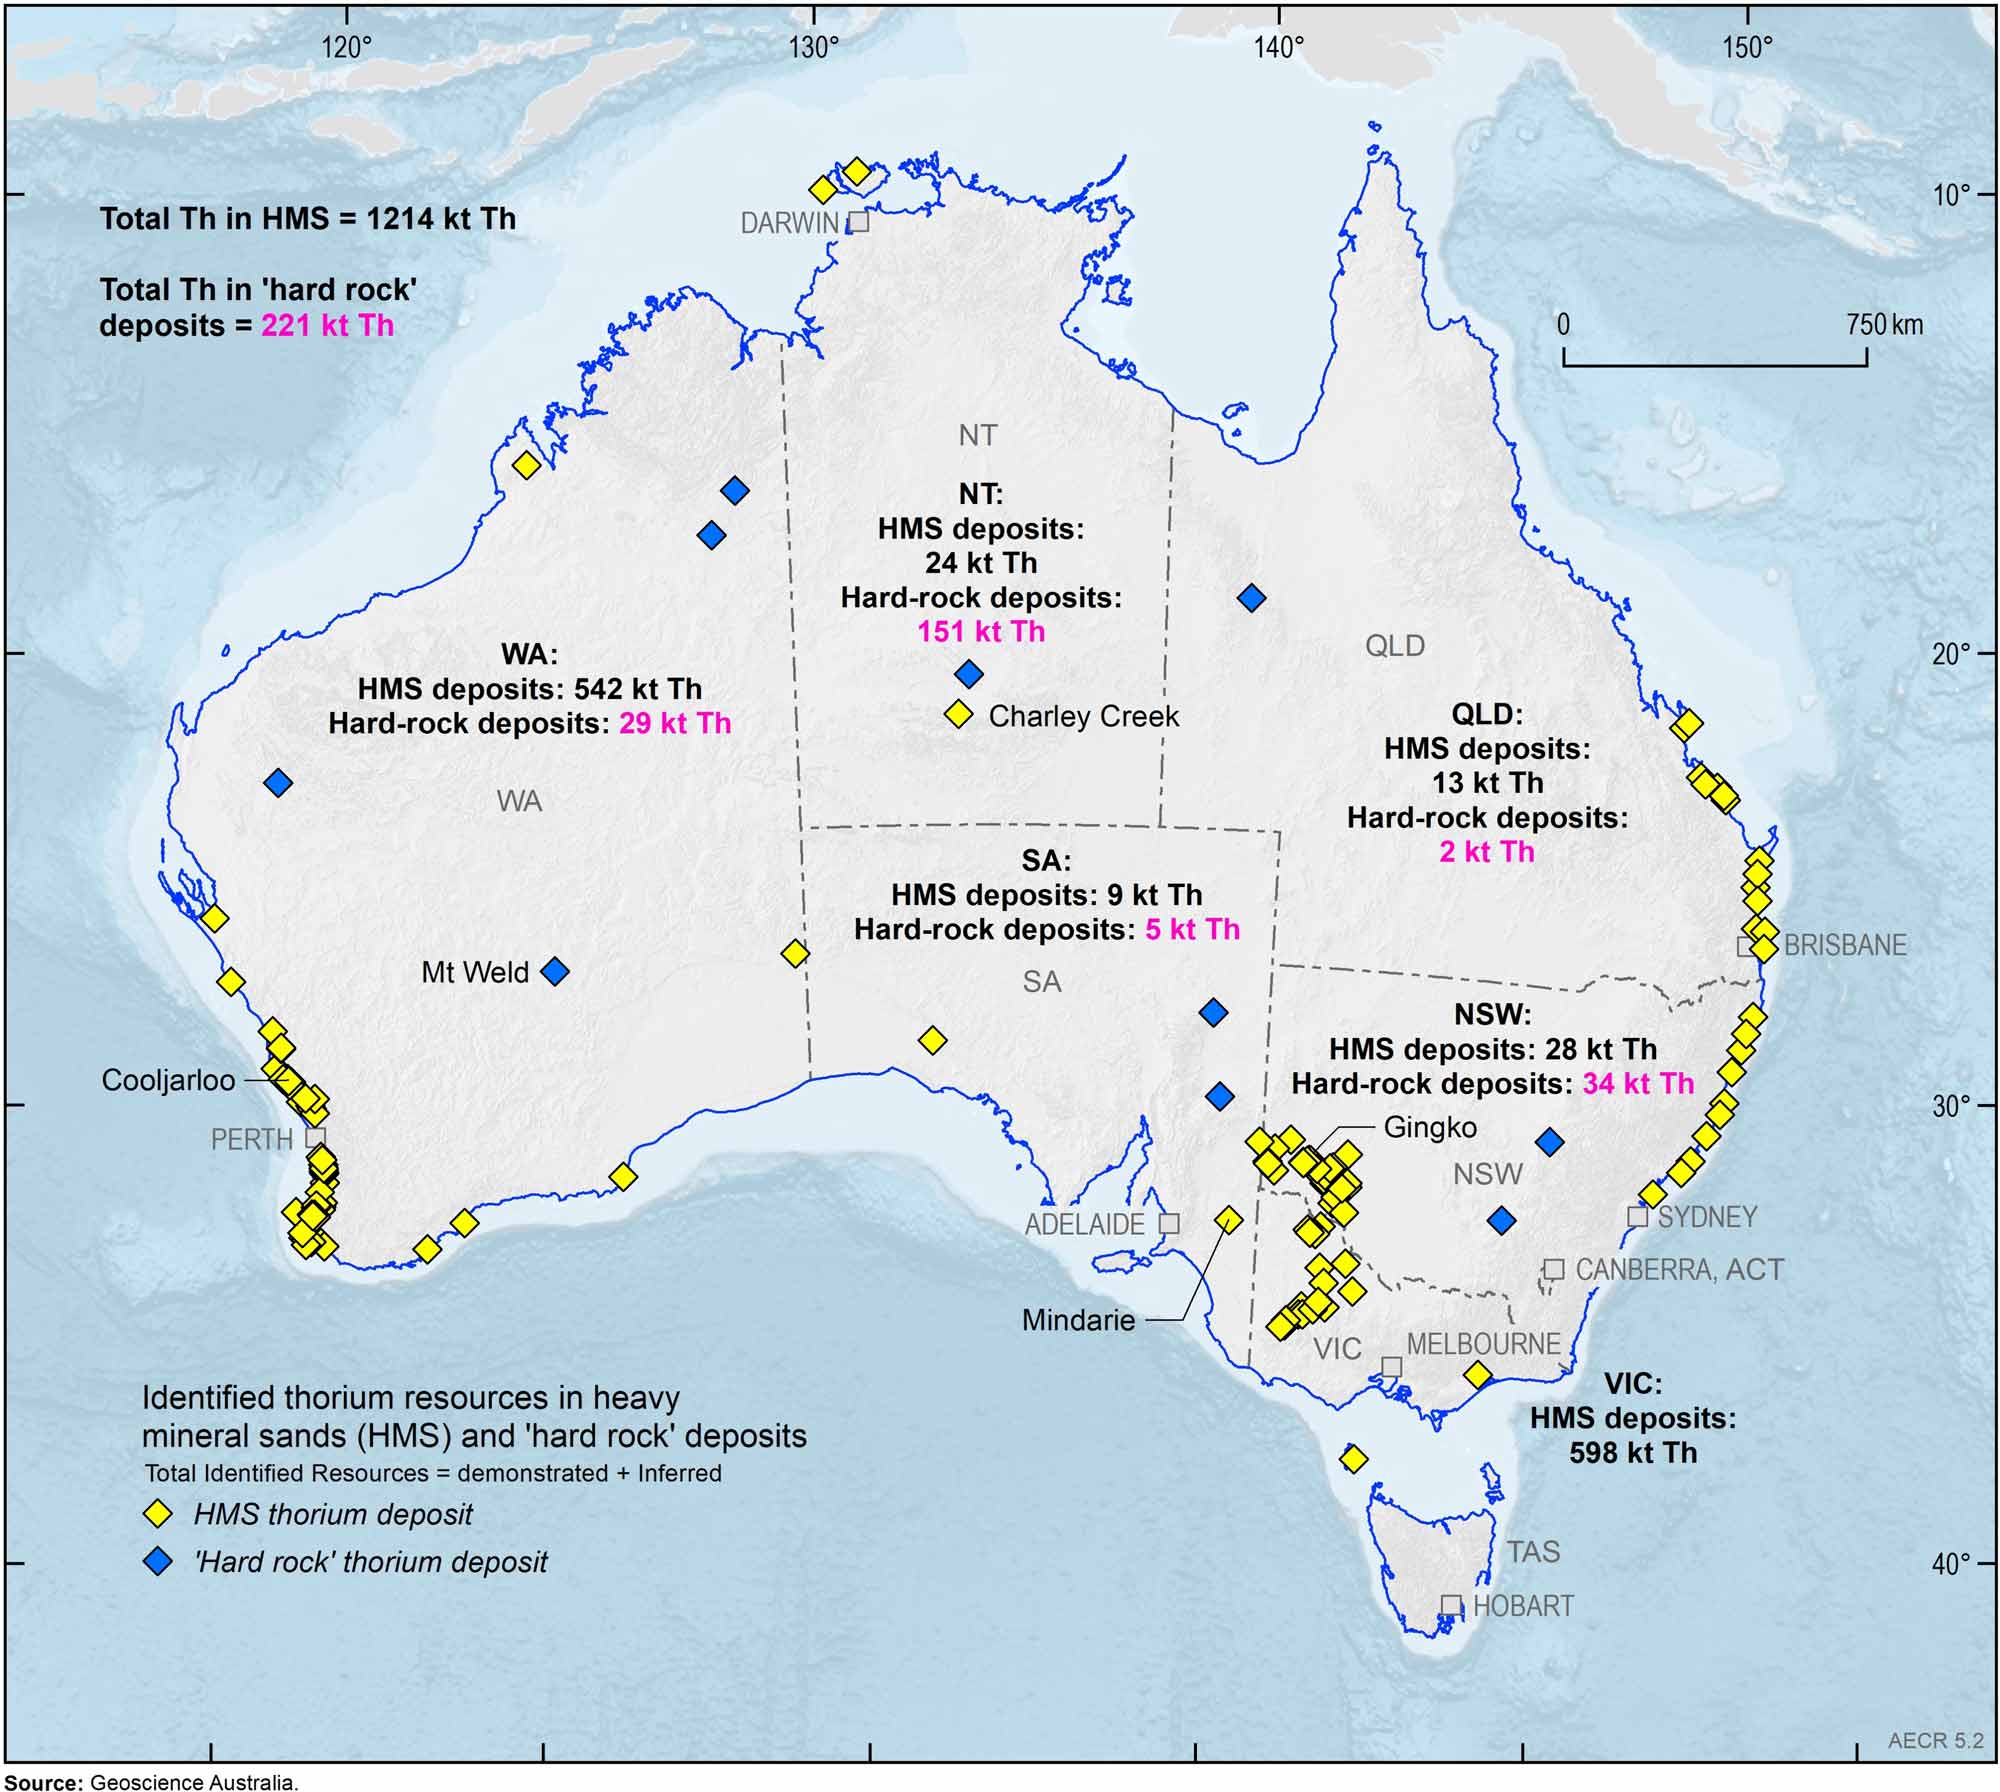
Figure 5.2. Australia’s identified thorium resources in heavy mineral sand and ‘hard rock’ deposits, 2022.
Production
Production
In 2022, Australia’s production of uranium was 4,555 tU (2,551 PJ; Figure 5.3), an increase of approximately 20% compared with 2021. This increase was due to the completion of processing infrastructure upgrades carried out at Olympic Dam during 2021. However, with the cessation of operations at the Ranger Mine in January 2021 an overall decrease in Australia’s uranium production of about 20% in the short to medium term has been forecasted.
In 2022, Australia was the world’s 4th largest uranium producer (9%) behind Kazakhstan (43%), Canada (15%) and Namibia (11%). This contrasts with the previous 10 years where Australia’s uranium production has typically ranked 3rd behind Canada. In 2022, Australia’s uranium was produced from two operating mines: Olympic Dam and Four Mile, both in South Australia (Figure 5.4). All of Australia’s domestic production is exported.
The Honeymoon Mine in South Australia (Boss Energy), which has been in care and maintenance since 2013, has announced plans to re-start mining operations in 2024. In Western Australia, the Mulga Rock Project (Deep Yellow Ltd.) has environmental approval and plan to commence a revised Definitive Feasibility Study (DFS) in 2024. The company hopes to have the DFS completed by mid-2025, with production planned for 2028. (Figure 5.4).
Global uranium production is dominated by a small number of countries, with Australia, Kazakhstan, Canada, Namibia, South Africa and Niger accounting for most production. Proterozoic unconformity-related deposits in Canada dominate the categories of lowest production cost. The sandstone-hosted resources of Kazakhstan, Niger and the United States comprise the next cost level. The Australian Olympic Dam breccia complex deposit is dominant in the key cost category of less than US$130/kgU.
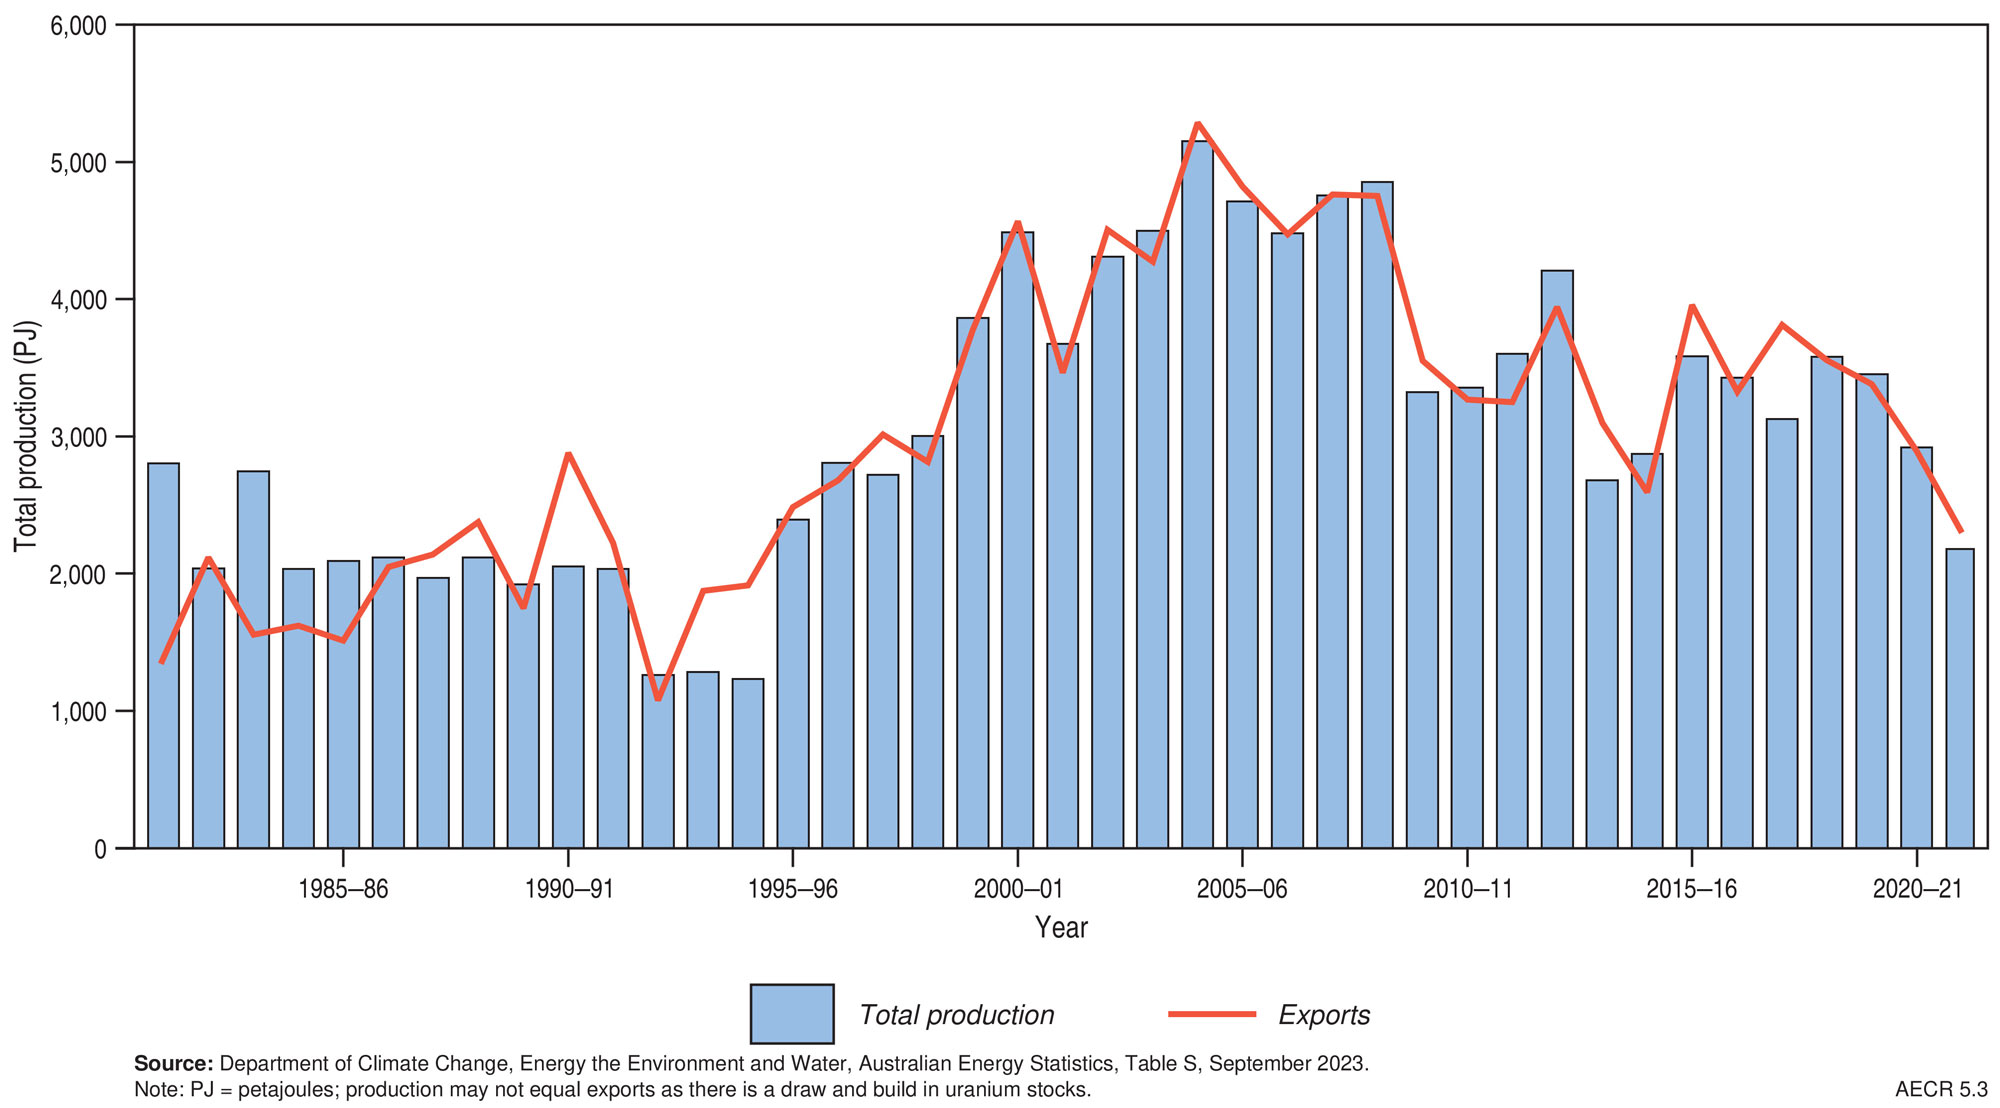
Figure 5.3. Historical trends in Australia’s uranium production and exports.
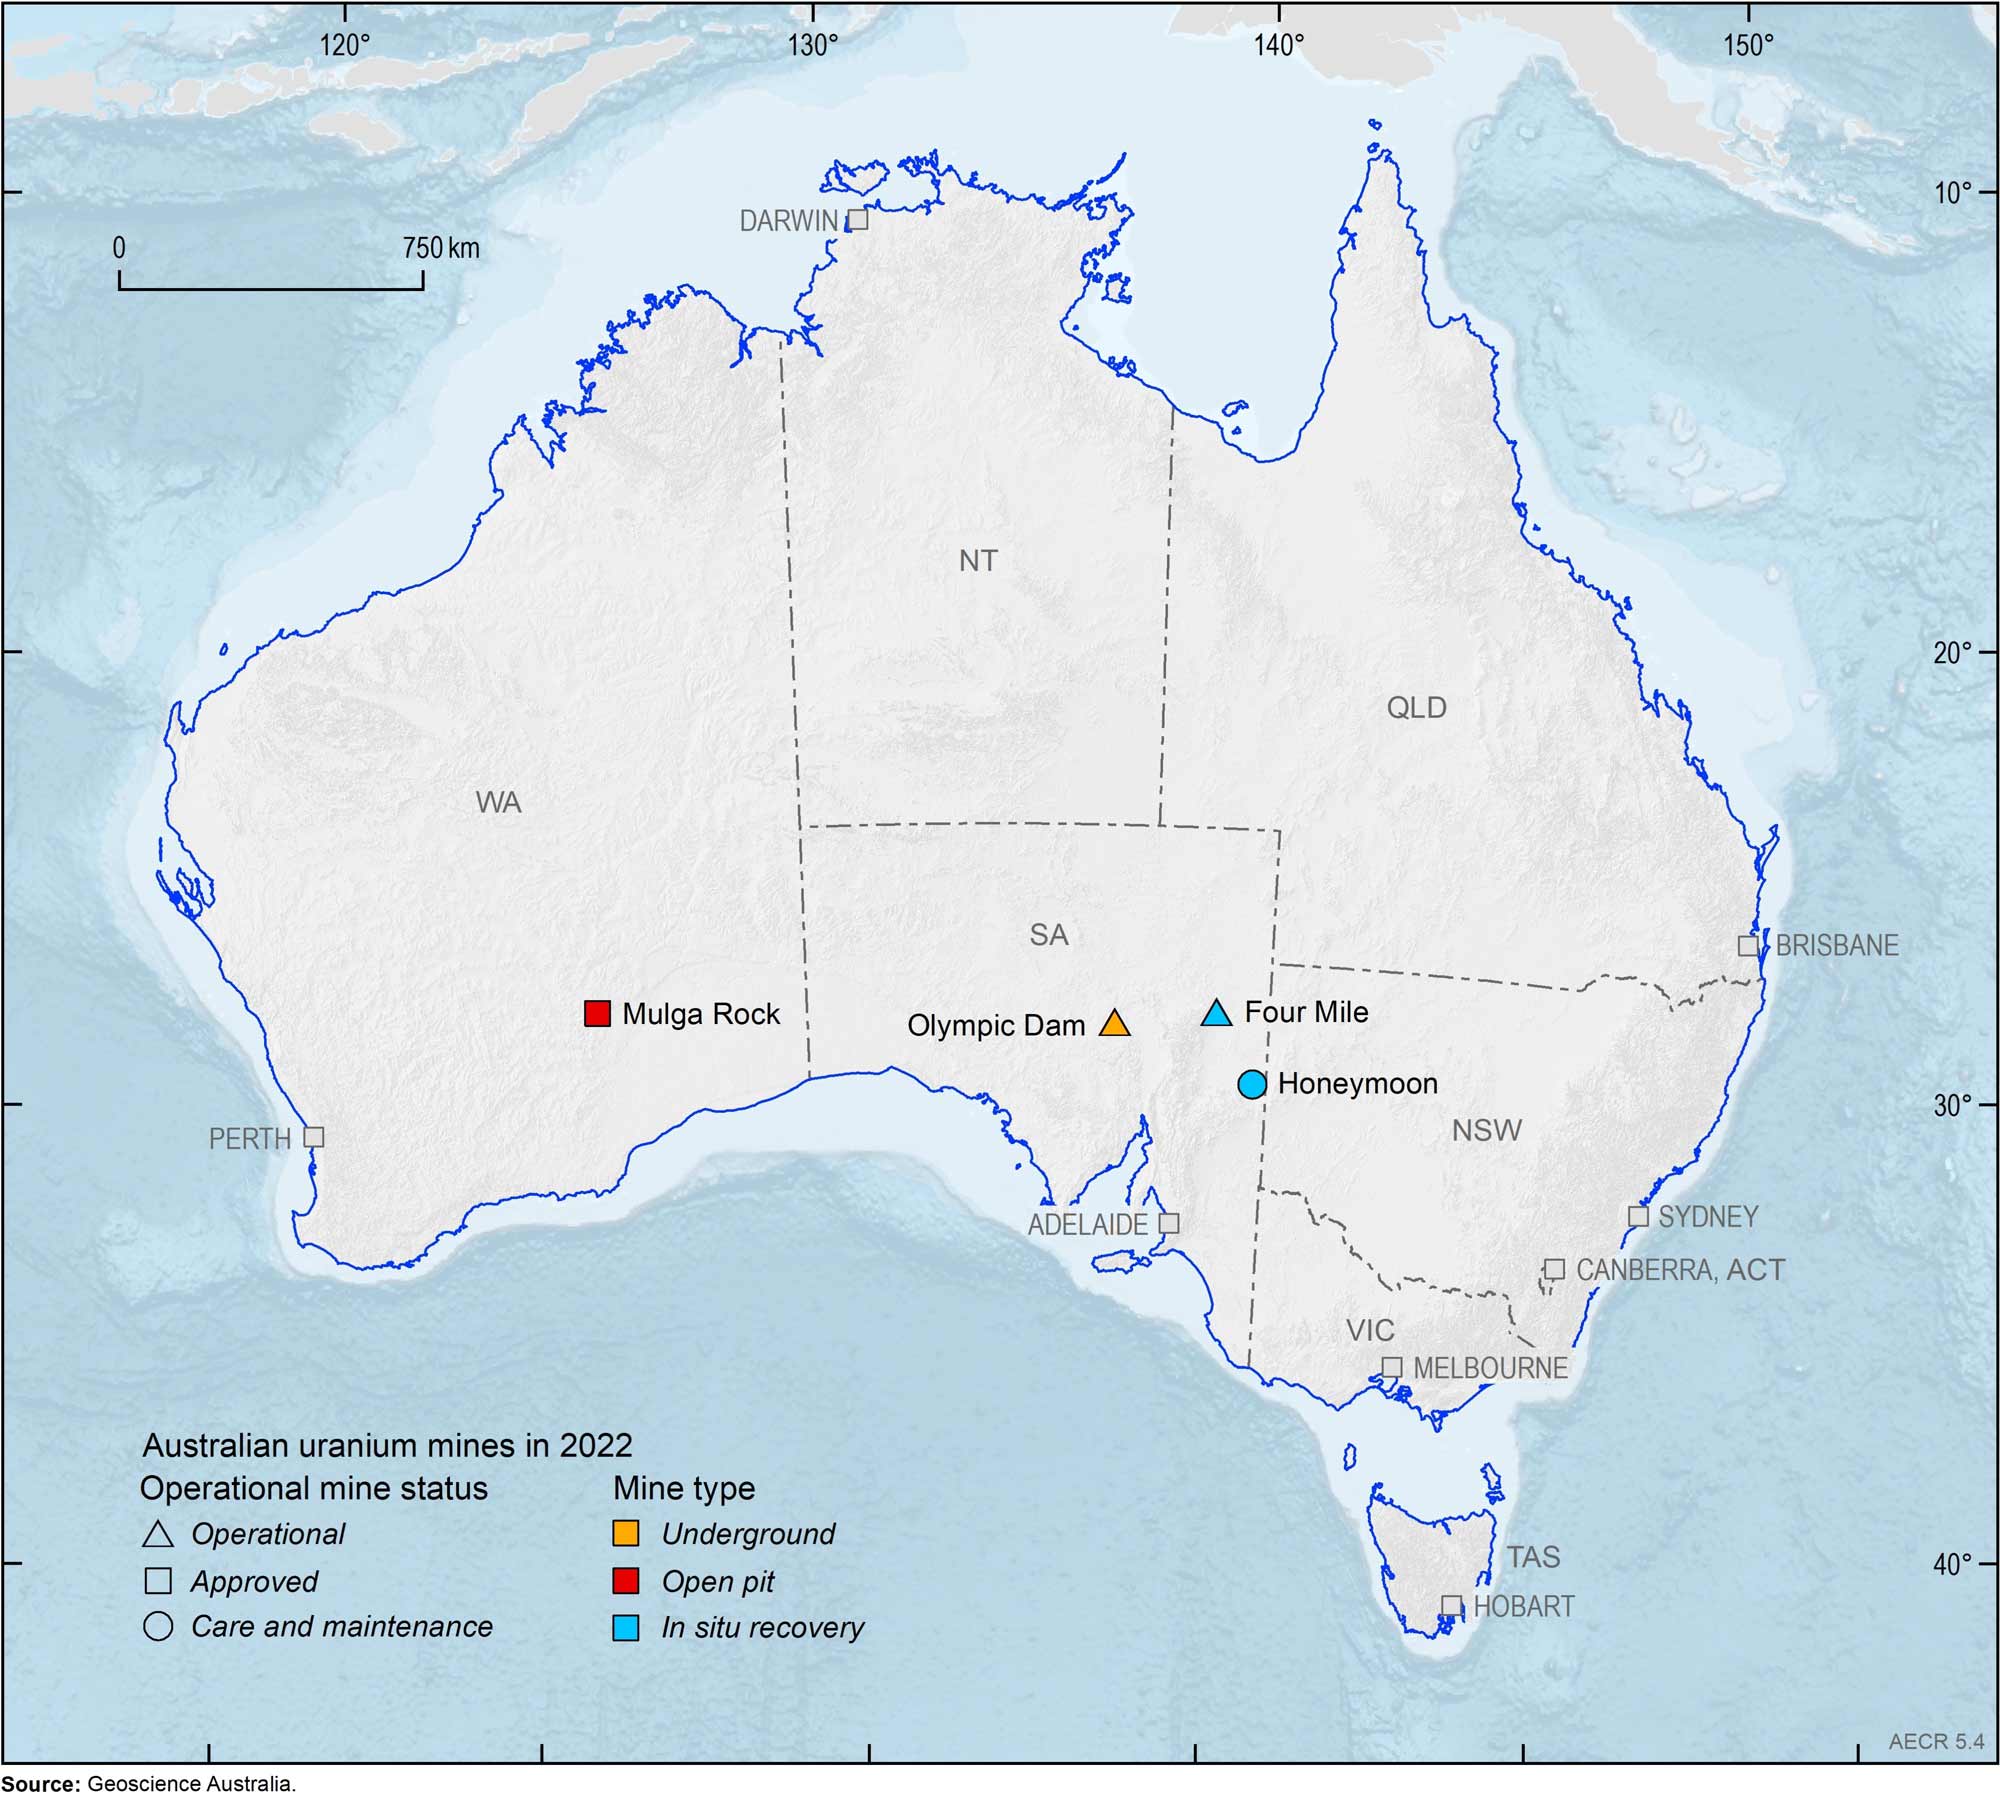
Figure 5.4. Australia’s uranium mines, 2022.
Trade
Trade
Australia exports all its uranium production to countries which have signed bilateral safeguards agreement. There are a total of 43 countries plus Taiwan with signed bilateral agreements. These agreements ensure that Australian uranium is only used for peaceful purposes and does not contribute to any military applications. Australian mining companies supply uranium under long-term contracts to electricity utilities in North America, Europe and Asia. In 2022, Australia exported 2,576 PJ (4,600 tU)—55% of this was exported to Canada, while 27% was sent to France and 18% to the United States.
World resources
World resources
The Organisation for Economic Co-operation and Development Nuclear Energy Agency and the International Atomic Energy Agency (OECD NEA and IAEA) describe 15 uranium deposit types. The largest tonnages are the sandstone, Proterozoic unconformity and Polymetallic iron-oxide breccia complex deposits (OECD-NEA and IAEA, 2023). The recoverable volumes of World Reasonably Assured Resources (RAR) at less than US$130/kgU were estimated at approximately 3,815 million tonnes (Mt) in 2021 (OECD NEA and IAEA, 2023). Australia accounts for approximately 32% of this global inventory (Figure 5.5; Table 5.1).
Extracting the latent energy value of thorium in a cost-effective manner is a challenge and requires considerable investment in research and development (World Nuclear Association, 2020). Another challenge is that thorium can only be used as a fuel in conjunction with a fissile material such as recycled plutonium.
Thorium-fuelled reactors have previously operated to generate electricity at Hamm-Uentrop in Germany (300 MWe, 1983–1989), at Peach Bottom (40 MWe, 1967–1974), Fort St Vrain (330 MWe, 1976–1989) and Shippingport (60 MWe, 1977–1982) in the United States (World Nuclear Association, 2020), with India having a longstanding program to develop thorium-based reactors. India has one small test facility in operation with a network of larger commercial facilities planned (World Nuclear Association, 2024a; Power, 2019).
However, as international research into associated technologies tends to be small scale and intermittent (e.g. New Scientist, 2017), commercial use of thorium as a nuclear reactor fuel is still some decades away.
Table 5.1. Key uranium statistics.
| Unit | Australia 2022 | World 2022 | |
|---|---|---|---|
| Resources | |||
| Identified RAR recoverable at <US$130/kg U | PJ | 692,160 | 2,136,120* |
| tU | 1,236,000 | 3,814,500* | |
| Share of World | % | 32 | 100 |
| World Ranking | no. | 1 | na |
| Production | |||
| Annual production | PJ | 2,551 | 27,639 |
| tU | 4,555 | 49,355 | |
| Share of world | % | 10.1 | 2.0 |
| World ranking | no. | 3.8 | 100 |
| CAGR from 2012 | % | 7 | na |
| Exports | |||
| Annual exports | PJ | 2,576 | na |
| tU | 4,600 | na | |
| Export value | A$b | 0.73 | na |
Abbreviations
t = tonne; PJ = petajoule; RAR = Reasonably Assured Resources; CAGR = compound annual growth rate; na = not available or not applicable.
Notes
*World resources are for 2021. Sources: Australia resources data (2022) from Geoscience Australia OZMIN database; World resources data (2021) from, Uranium 2022: Resources, Production and Demand; Export data from, Department of Industry, Science and Resources, Commonwealth of Australia Resources and Energy Quarterly March 2024, and have been converted from tonnes uranium oxide to tonnes uranium metal; Australia production world share, ranking and world production sourced from the World Nuclear Association website (2024b).
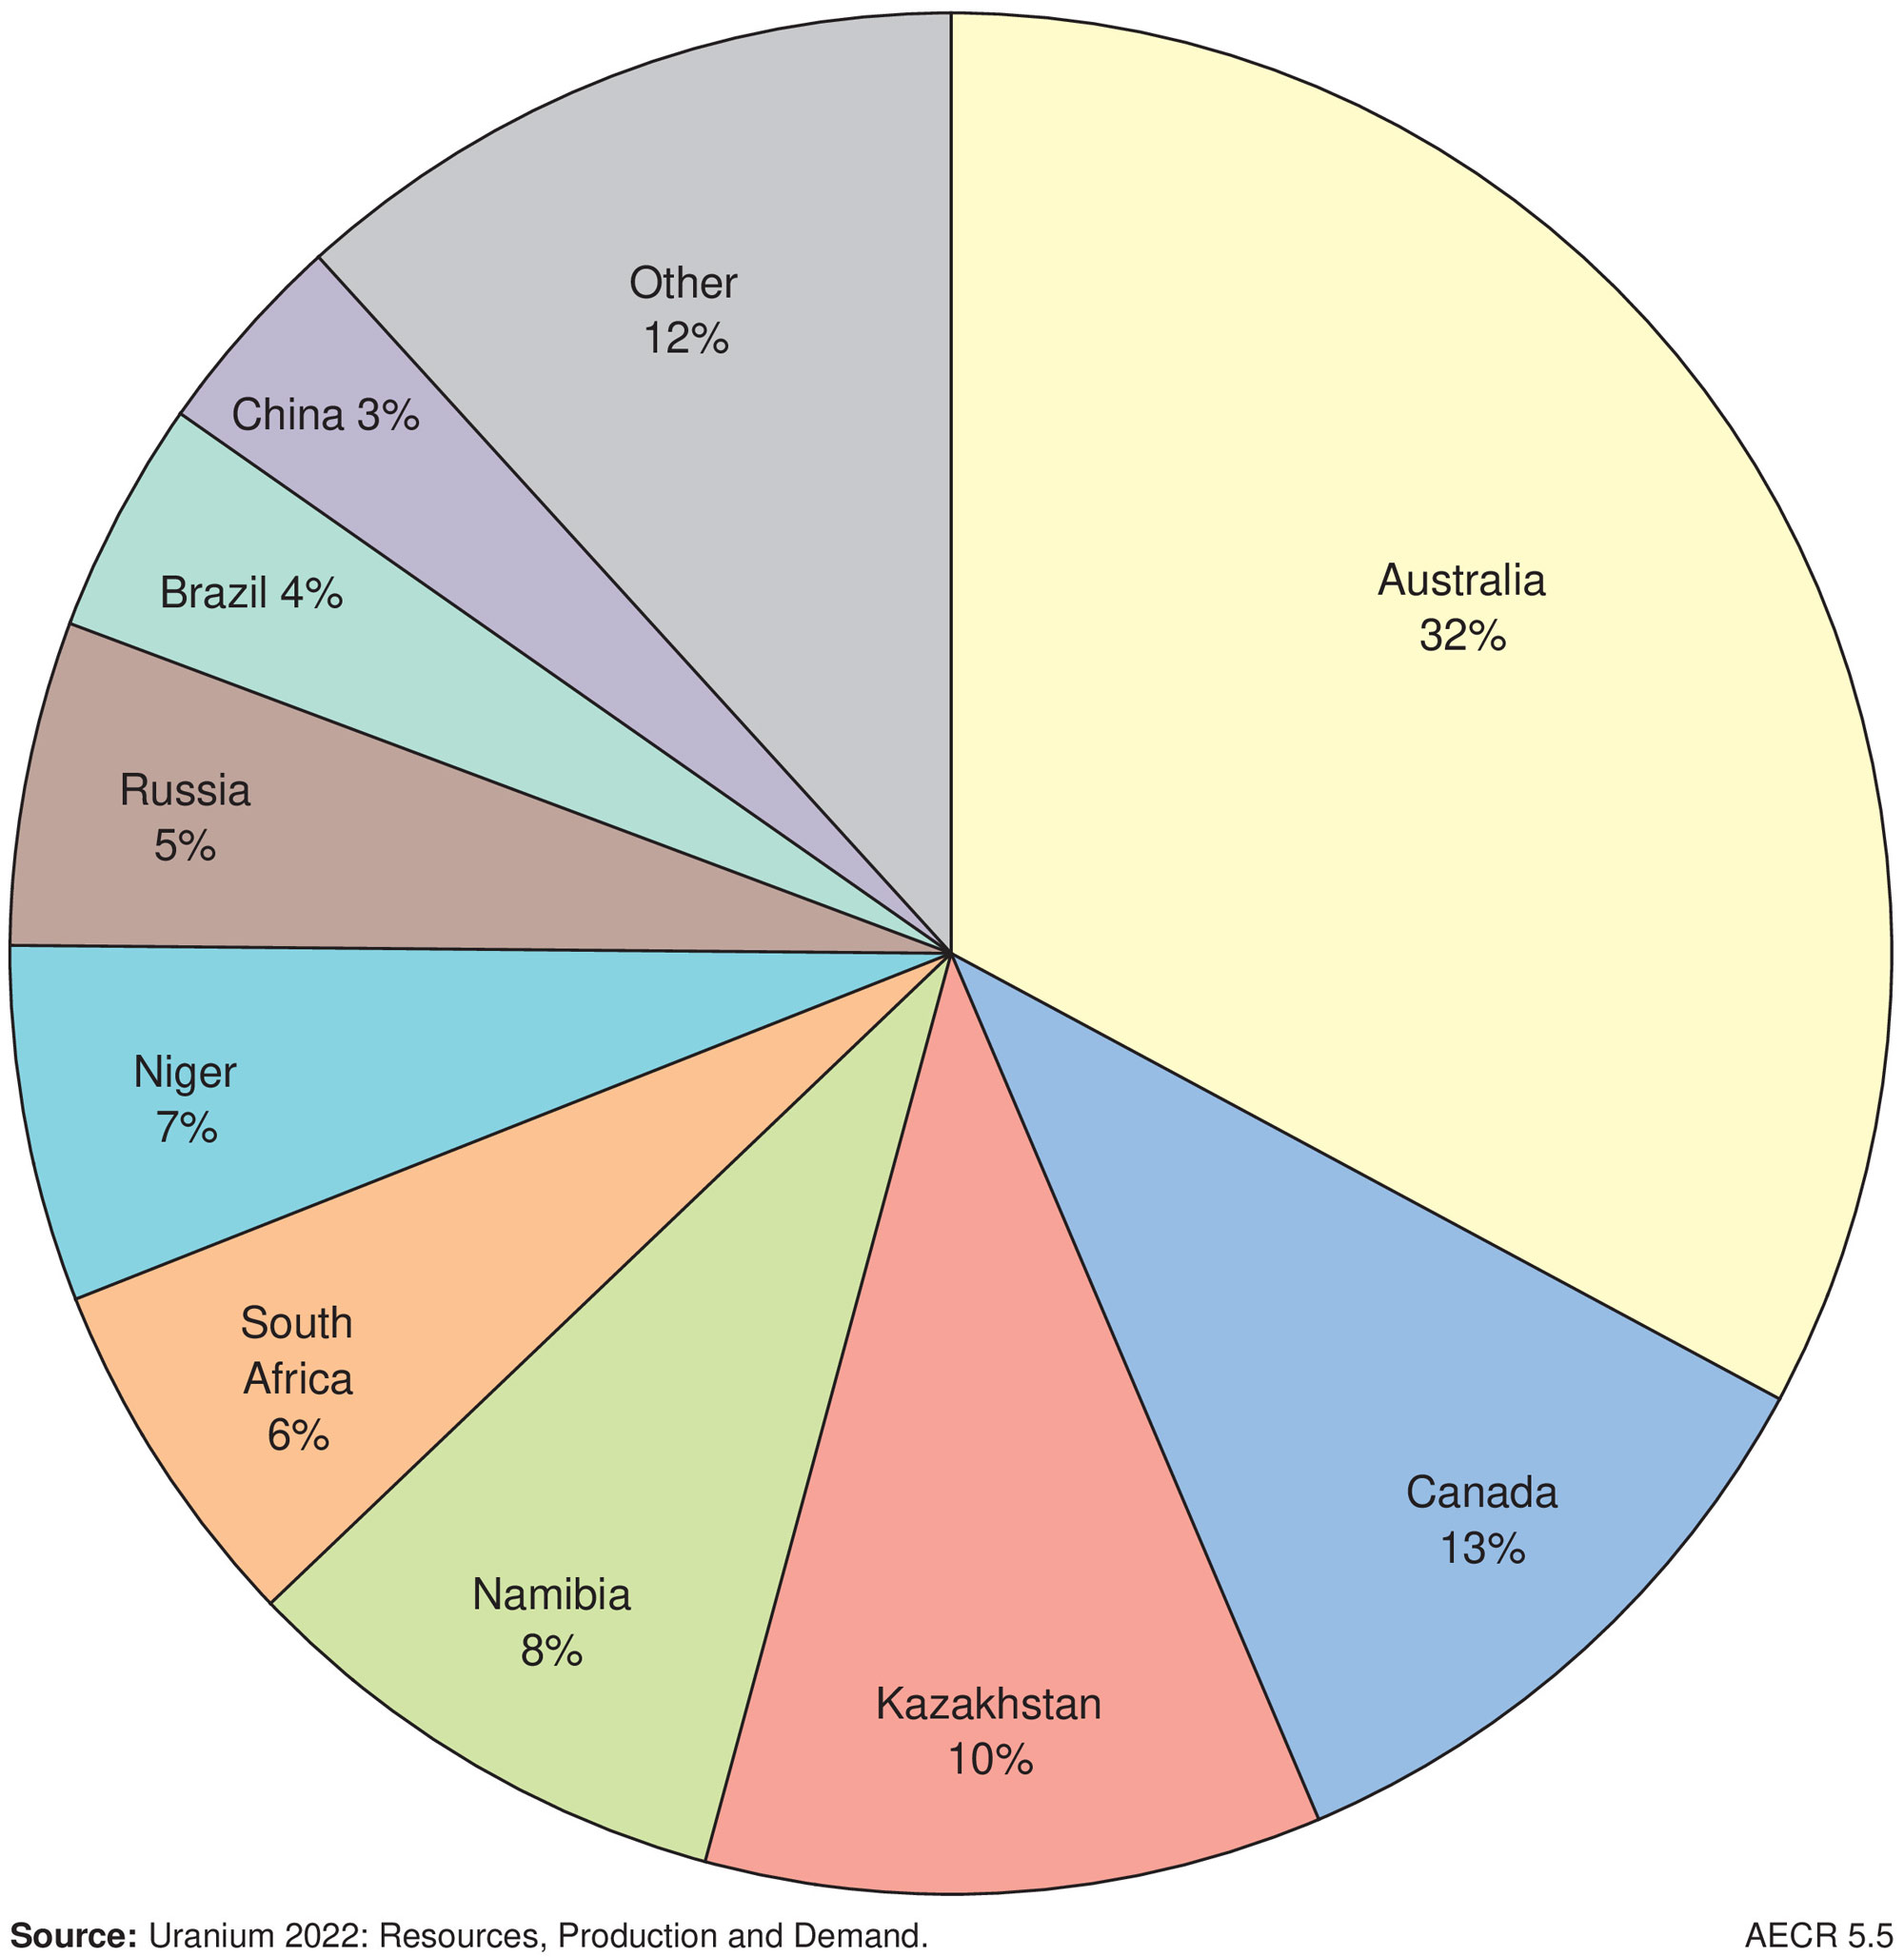
Figure 5.5. Global distribution of Reasonably Assured Resources of uranium (tonnes U < US$130/kgU).
References
References
Australian Safeguards and Non-Proliferation Office (ASNO), 2023. Australian Safeguards and Non-Proliferation Office Annual Report 2022-2023.
Department of Industry, Science and Resources, 2024. Resources and Energy Quarterly: March 2024.
Department of Climate Change, Energy, the Environment and Water, 2023. Australian Energy Update 2023, Table S, September 2023.
Hughes, A, Britt, A., Pheeney, J., Summerfield, D., Senior, A., Hitchman, A., Cross, A., Sexton, M., Colclough, H. and Hill, J., 2023. Australia's Identified Mineral Resources 2022. Geoscience Australia, Canberra.
New Scientist, 2017. Thorium could power the next generation of nuclear reactors (last accessed 26 May 2023).
Organisation for Economic Co-operation and Development, Nuclear Energy Agency, and International Atomic Energy Agency (OECD, NEA and IAEA), 2023. Uranium 2022: Resources, Production and Demand (last accessed 30 April 2024).
Power 2019. Indian-designed nuclear reactor breaks record for continuous operation (last accessed 1 May 2024).
World Nuclear Association 2020. Thorium (last accessed 1 May 2024).
World Nuclear Association 2024a. Nuclear Power in India (last accessed 1 May 2024).
World Nuclear Association 2024b. World Uranium Mining Production for 2022 (last accessed 1 May 2024)
Data download
Data download
Australia's Energy Commodity Resources Data Tables - 2022 reporting period