Australia's Identified Mineral Resources 2024 Commodity Summaries
Page last updated:27 February 2025
On this page
Antimony
Critical Mineral
Operating Mines
1
n.c.
EDR
112.4 kt Sb
19%
Ore Reserves
10.6 kt Sb
46%
Production
1.9 kt Sb
21%
Export Income
n.a.
0%
World Ranking
Resources
6 (5%)
Production
7 (2%)
Major Uses:
Metal alloys, fire retardants, lead batteries, manufacturing solder, sheet and pipe metal, ammunition, bearings, castings and pewter.
Abbreviations
kt Sb – kilotonnes of antimony content; n.a. – not available; n.c. – no change.
Notes
Resource figures are as at 31 December 2023. Operating mines and production are for calendar year 2023. Percentage increases or decreases are in relation to 2022. World rankings are followed by percentage share in brackets.
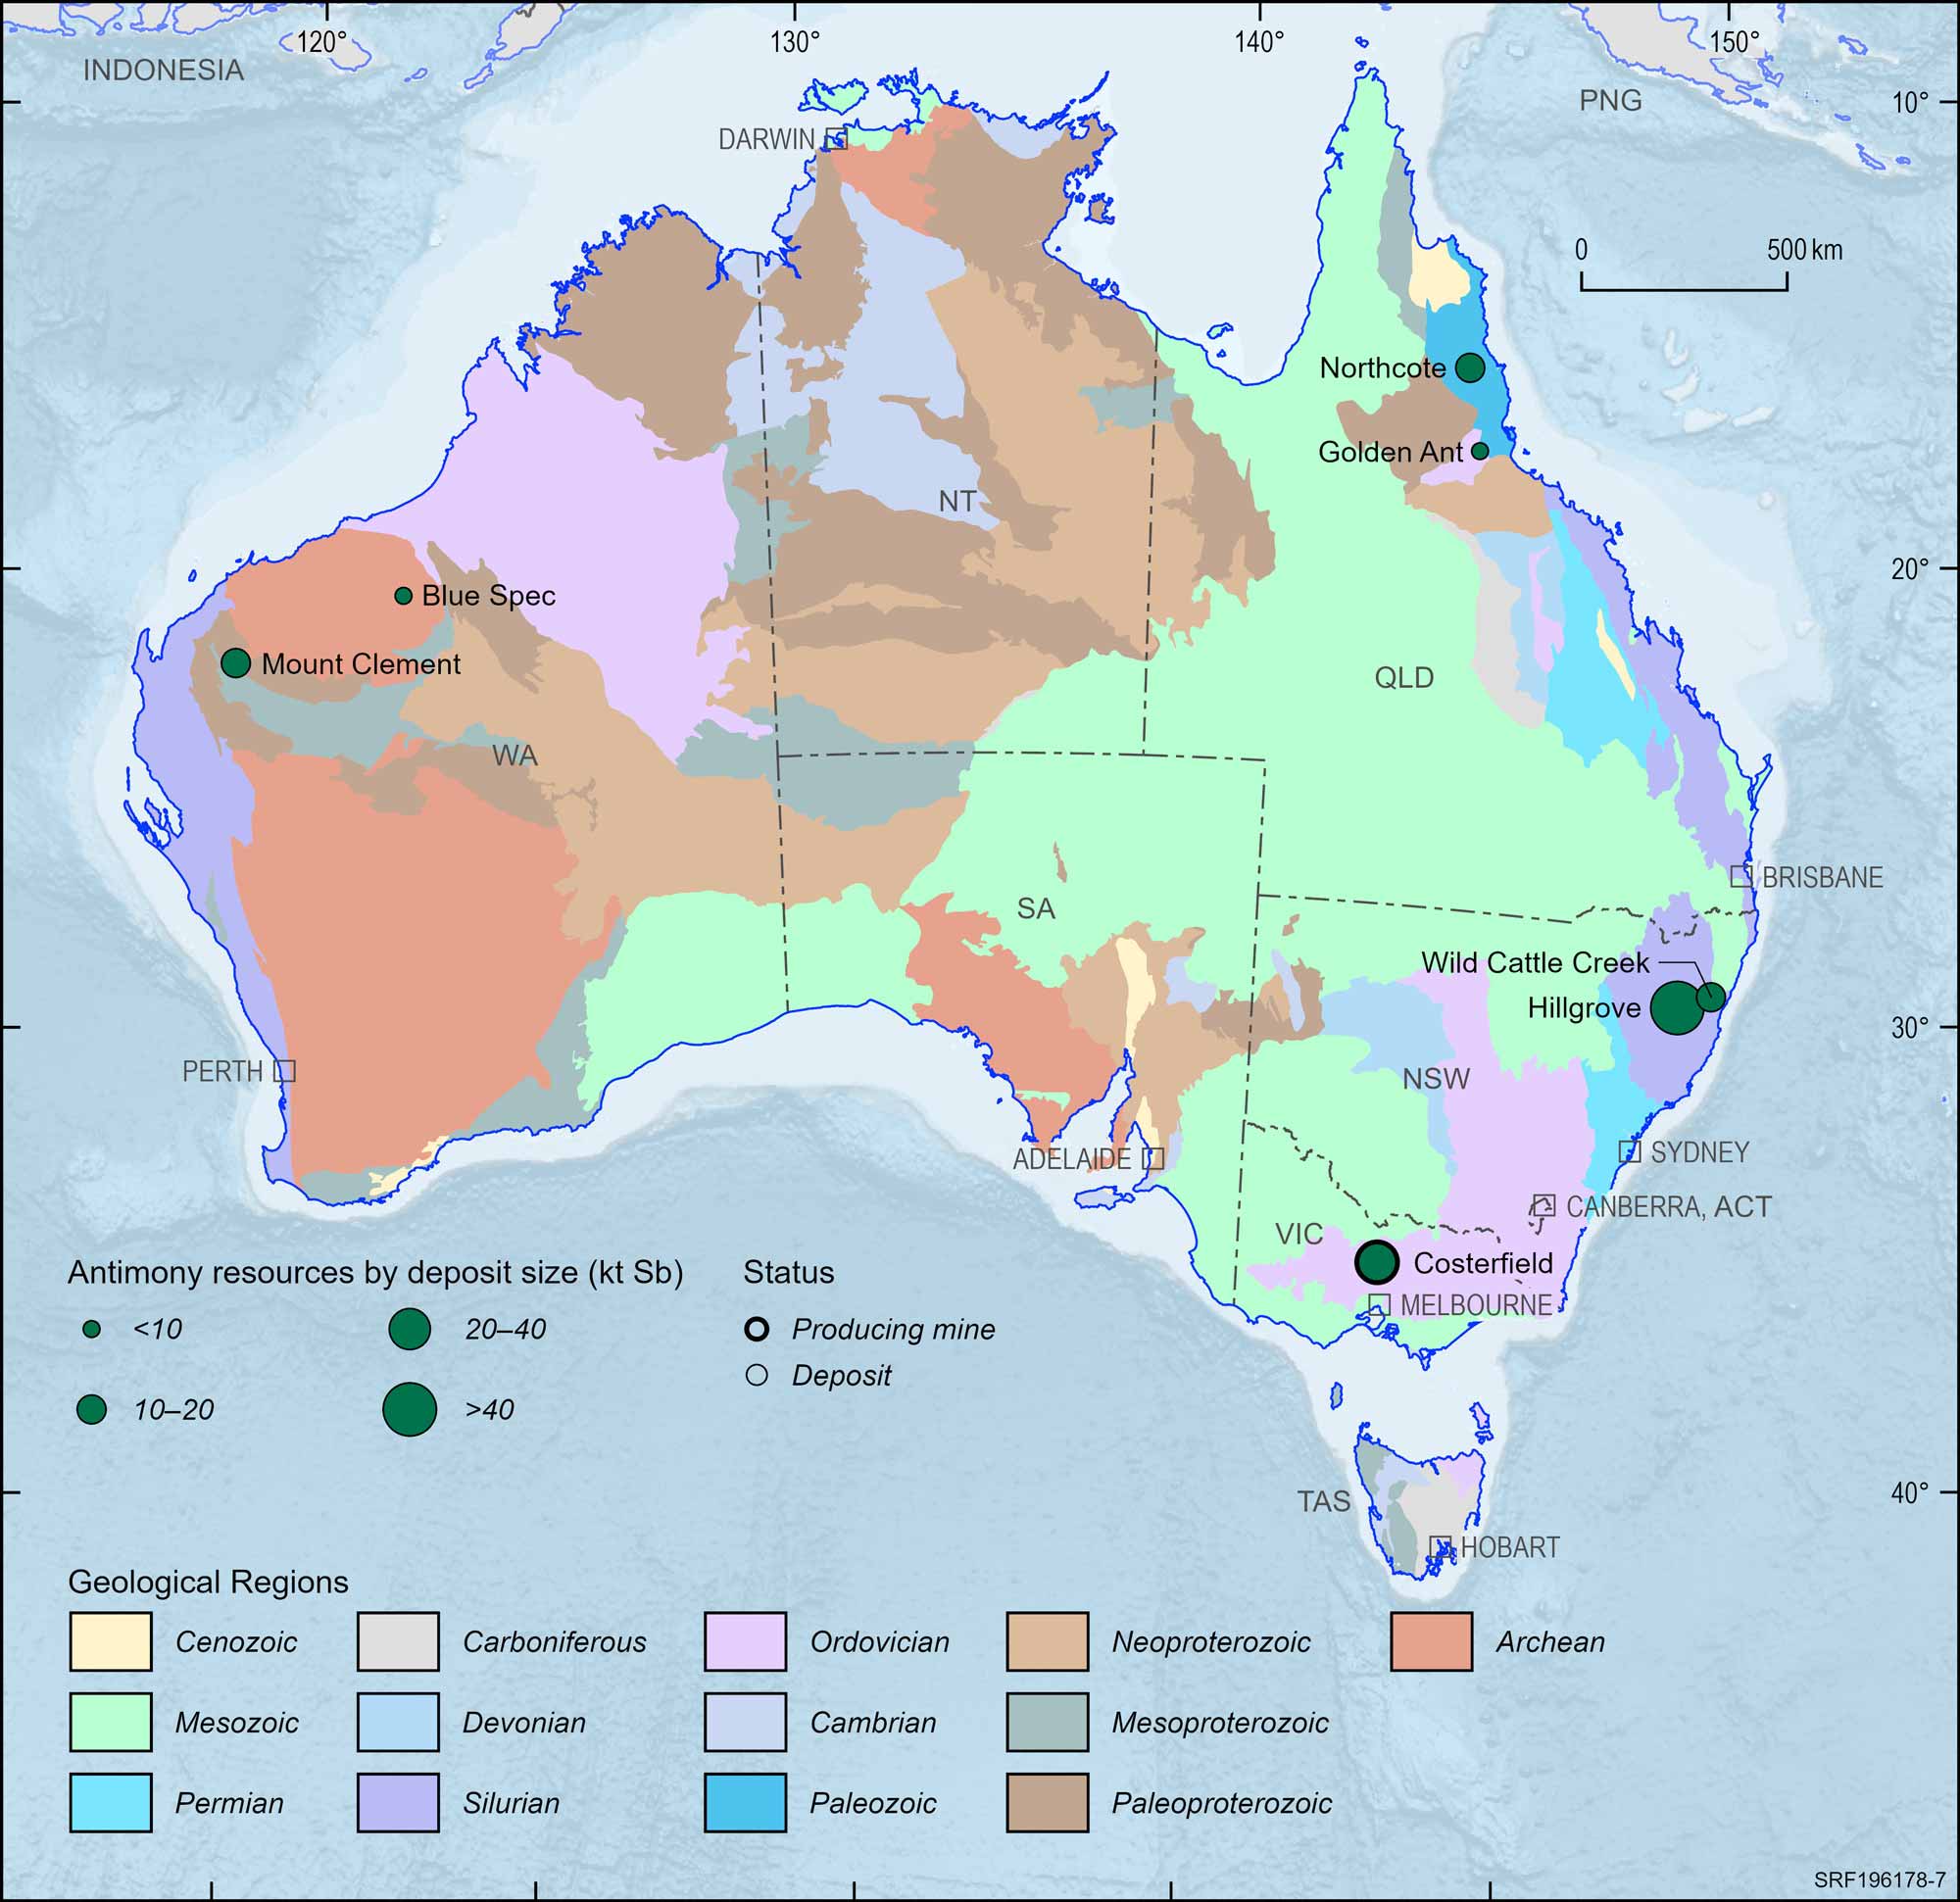
Figure 7. Australian antimony deposits and operating mines, 2023.
Deposit size is based on total resources (EDR + Subeconomic Demonstrated Resources + Inferred).
Bauxite
STRATEGIC MATERIAL
Operating Mines
9
1
EDR
3,714 Mt
5%
Ore Reserves
1,725 Mt
6%
Production
103.8 Mt
1%
Export Income
$15,115 m
4%
World Ranking
Resources
3 (12%)
Production
1 (26%)
Major Uses:
Production of aluminium metal for use in buildings, aeronautics, electric vehicles, whitegoods, power lines, food storage and renewable energy technologies.
Abbreviations
Mt – million tonnes; $m – million dollars (Australian).
Notes
Resource figures are as at 31 December 2023. Operating mines and production are for calendar year 2023. Percentage increases and decreases and changes in the number of mines are in relation to 2022. World rankings are followed by percentage share in brackets. Export income is the sum of bauxite, alumina and aluminum categories, sourced from Office of the Chief Economist, Resources and Energy Quarterly, September 2024.
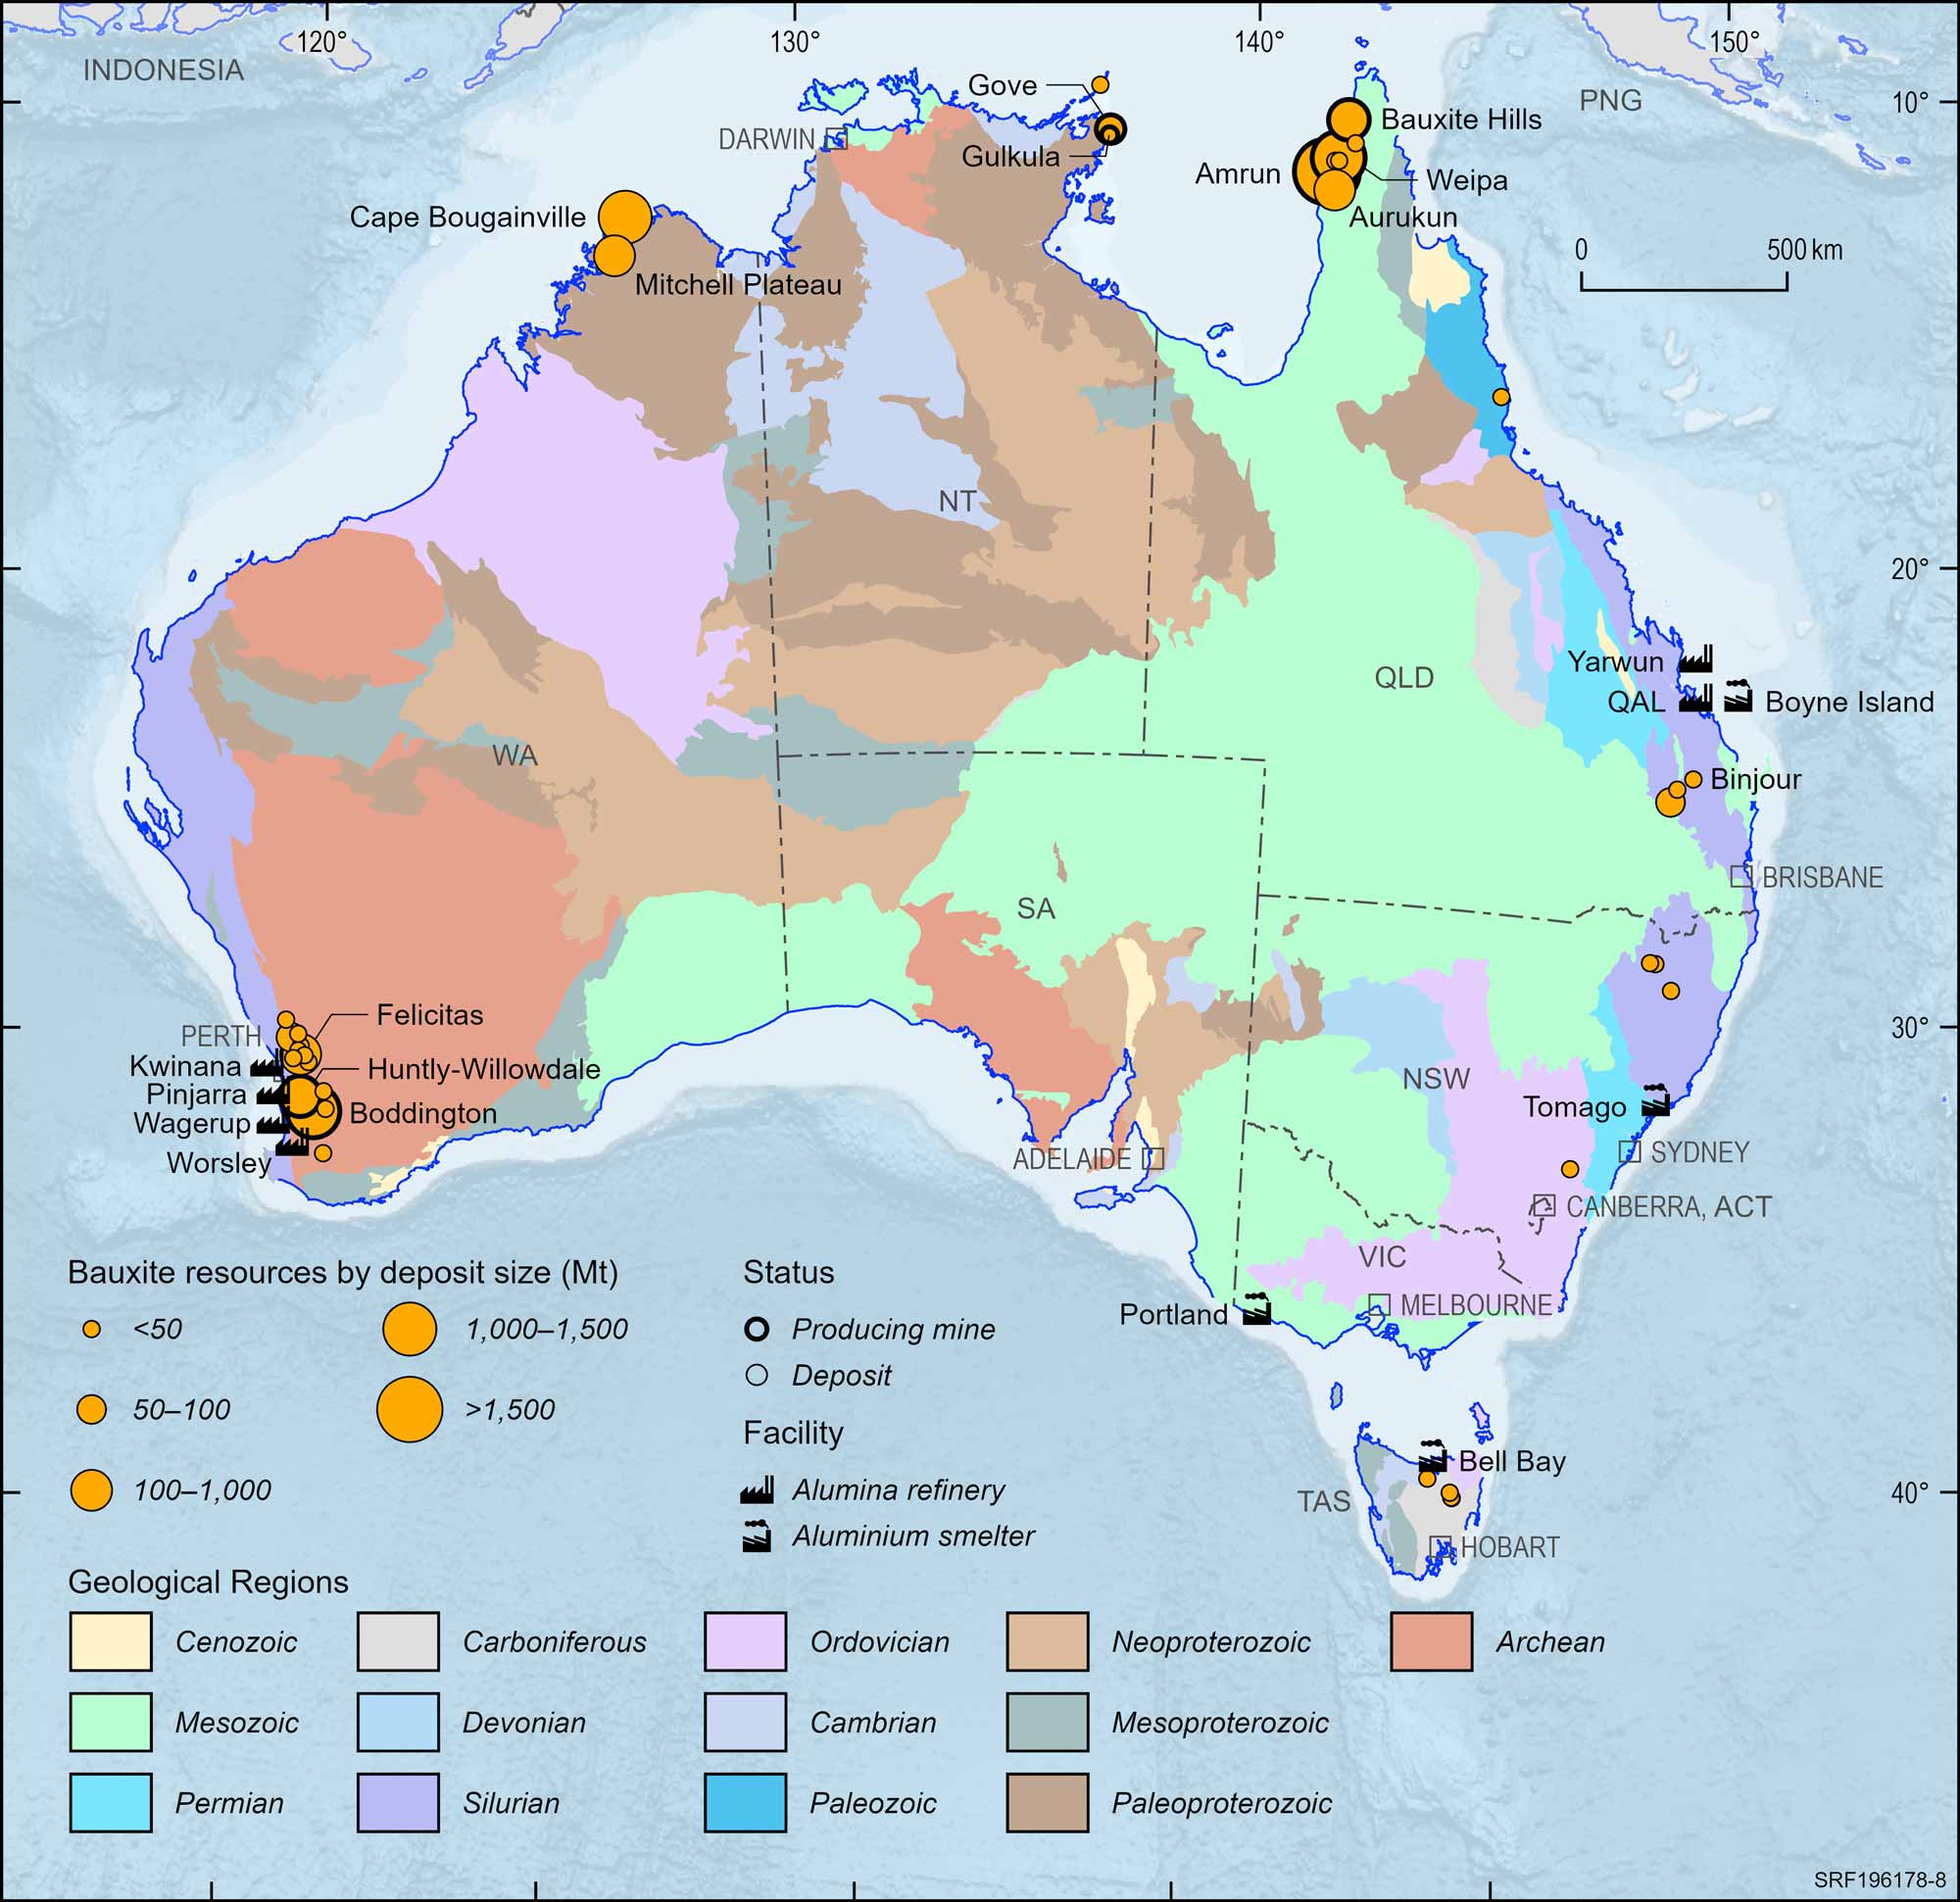
Figure 8. Australian bauxite deposits, operating mines, alumina refineries and aluminium smelters, 2023.
Deposit size is based on total resources (EDR + Subeconomic Demonstrated Resources + Inferred).
For clarity, only major or significant deposits are labelled
Black Coal
Operating Mines
95
2
EDR
72,487 Mt
1%
Ore Reserves
13,912 Mt
8%
Production
428 Mt
2%
Export Income
$103,188 m
28%
World Ranking
Resources
4 (9%)
Production
5 (6%)
Major Uses:
Electricity generation, steel making.
Abbreviations
Mt – million tonnes; $m – million dollars (Australian).
Notes
Resource figures are as at 31 December 2023. Operating mines and production are for calendar year 2023. Percentage increases and decreases and changes in the number of mines are in relation to 2022. World rankings are followed by percentage share in brackets. Export income is the sum of thermal and coking coal categories, sourced from Office of the Chief Economist, Resources and Energy Quarterly, September 2024.
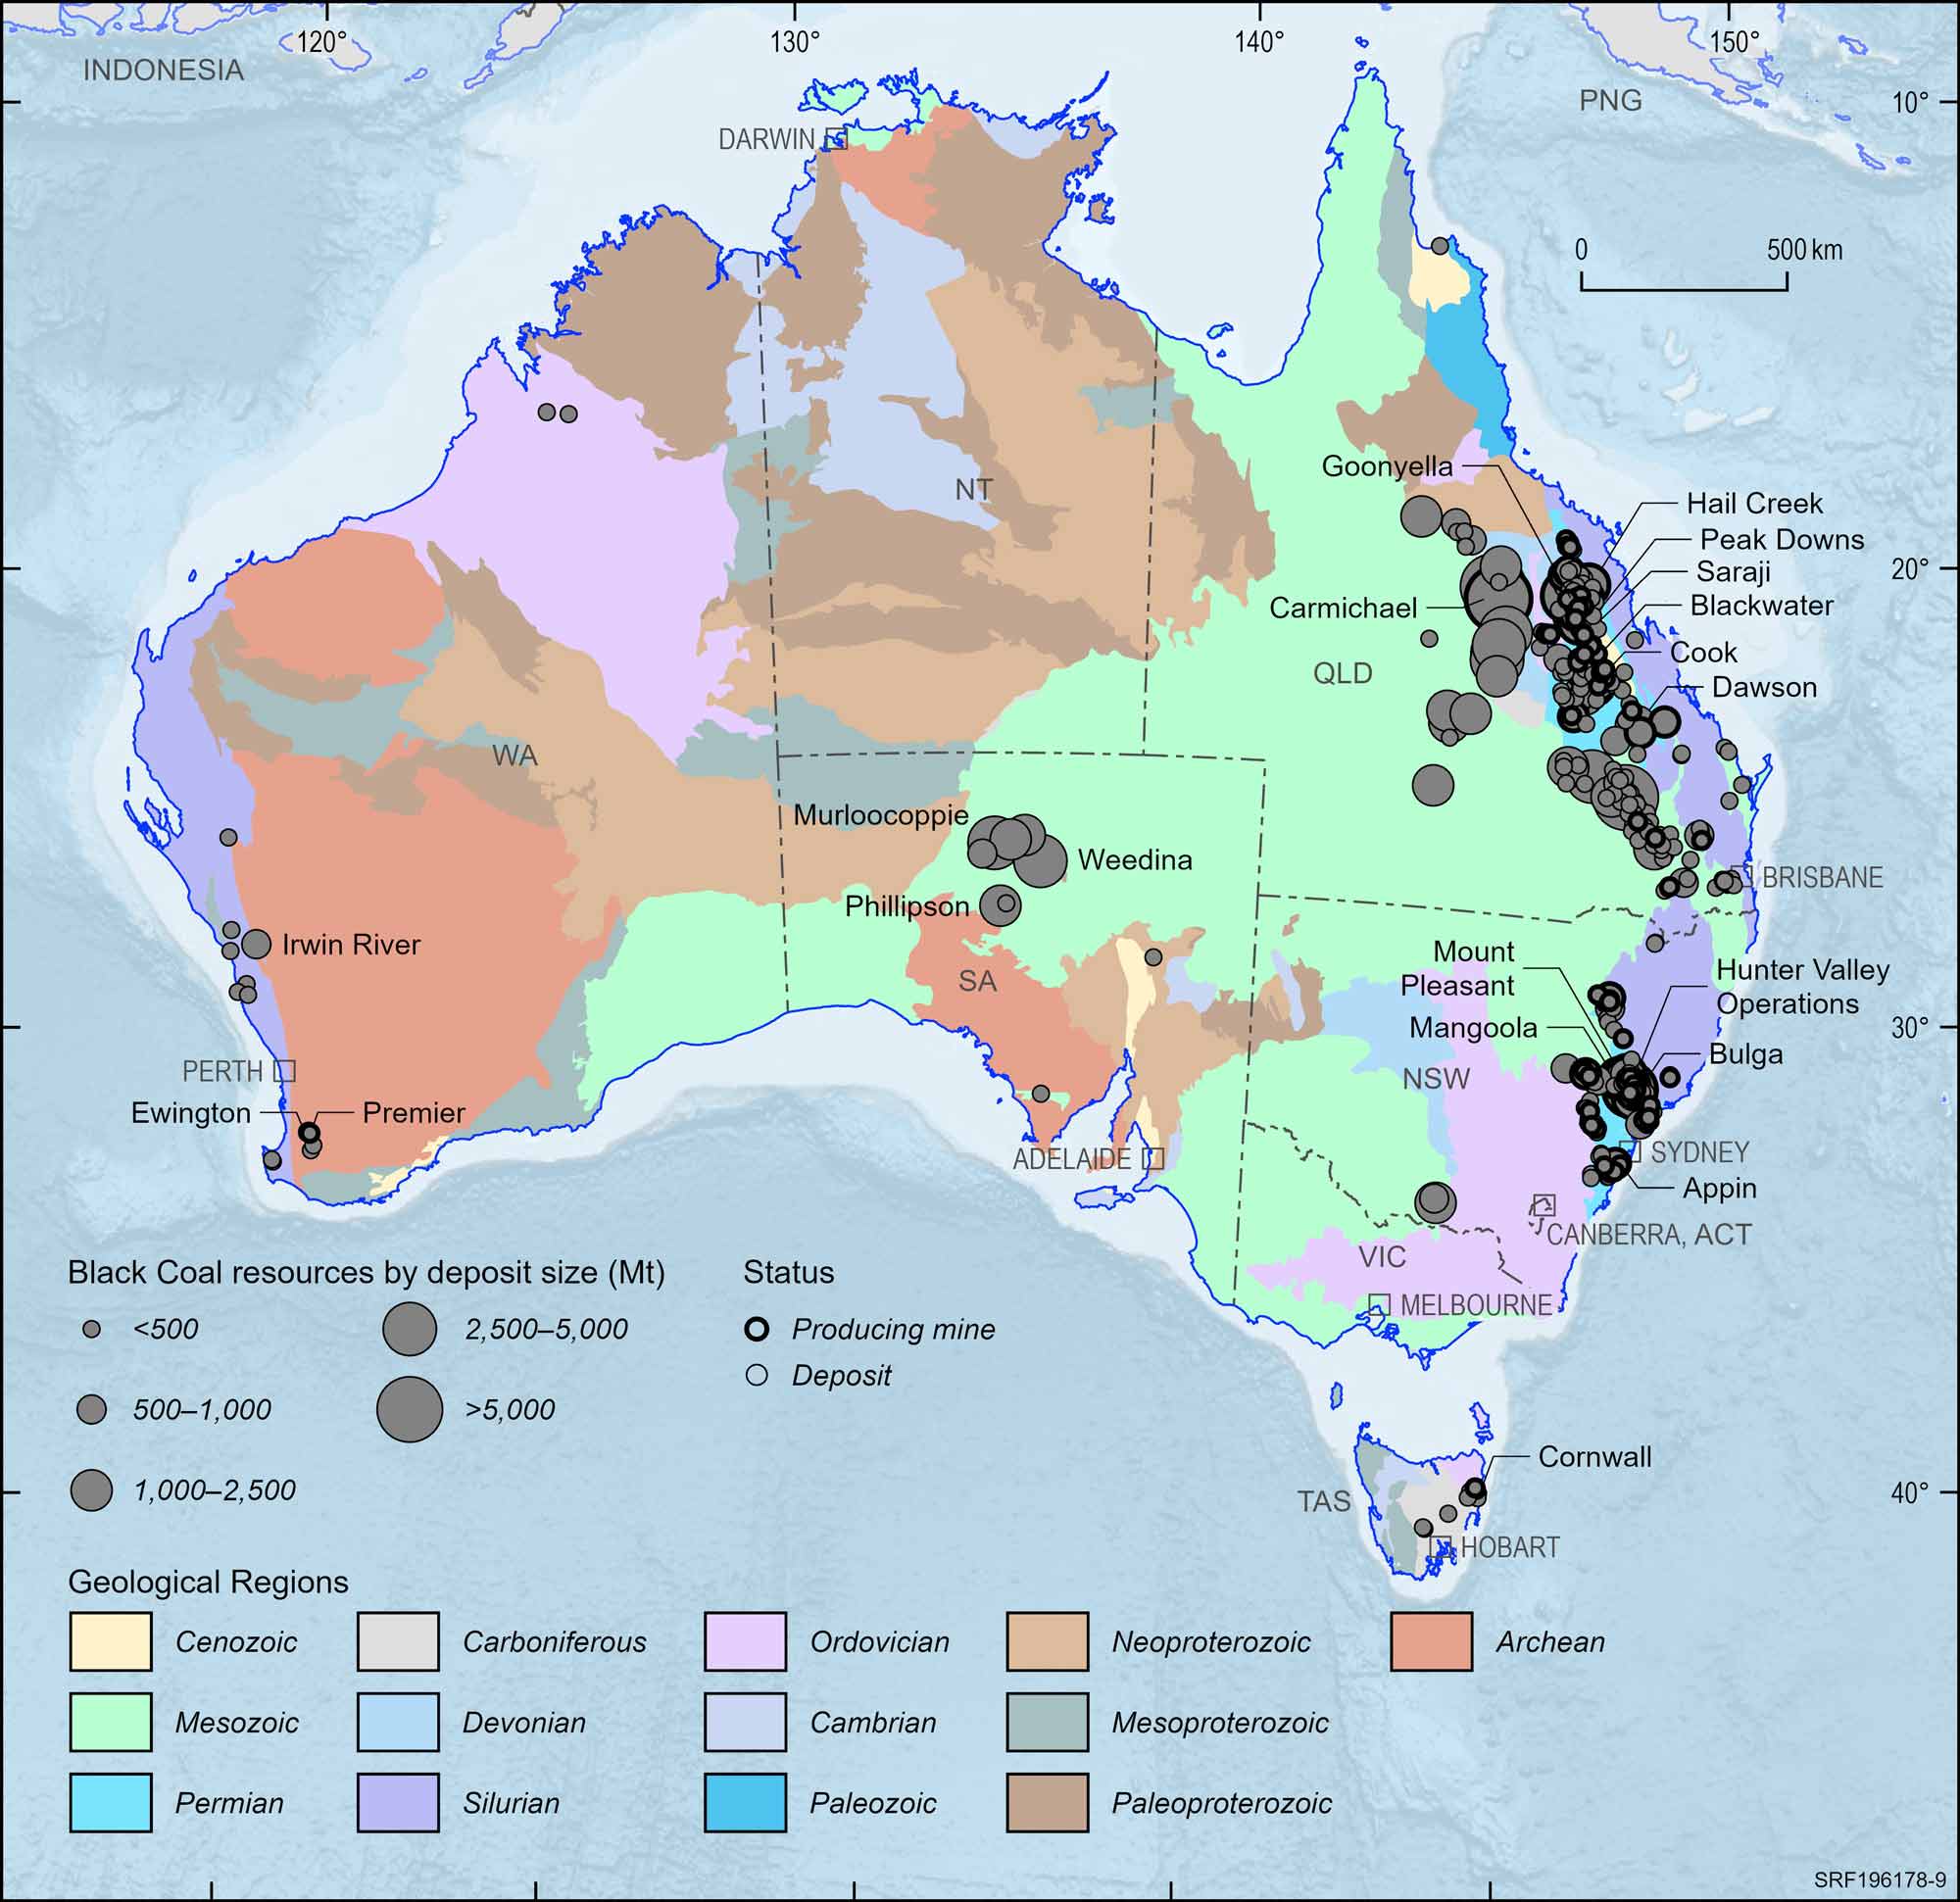
Figure 9. Australian black coal deposits and operating mines, 2023.
Deposit size is based on total recoverable resources (EDR + Subeconomic Demonstrated Resources + Inferred).
For clarity, only major or significant deposits are labelled.
Brown Coal
Operating Mines
3
n.c.
EDR
74,039 Mt
0%
Ore Reserves
n.a.
0%
Production
38.6 Mt
1%
Export Income
n.a.
0%
World Ranking
Resources
2 (23%)
Production
9 (3%)
Major Uses:
Electricity generation.
Abbreviations
Mt – million tonnes; n.a. – not available; n.c. – no change.
Notes
Resource figures are as at 31 December 2023. Operating mines and production are for calendar year 2023. Percentage increases and decreases and changes in the number of mines are in relation to 2022. World rankings are followed by percentage share in brackets.
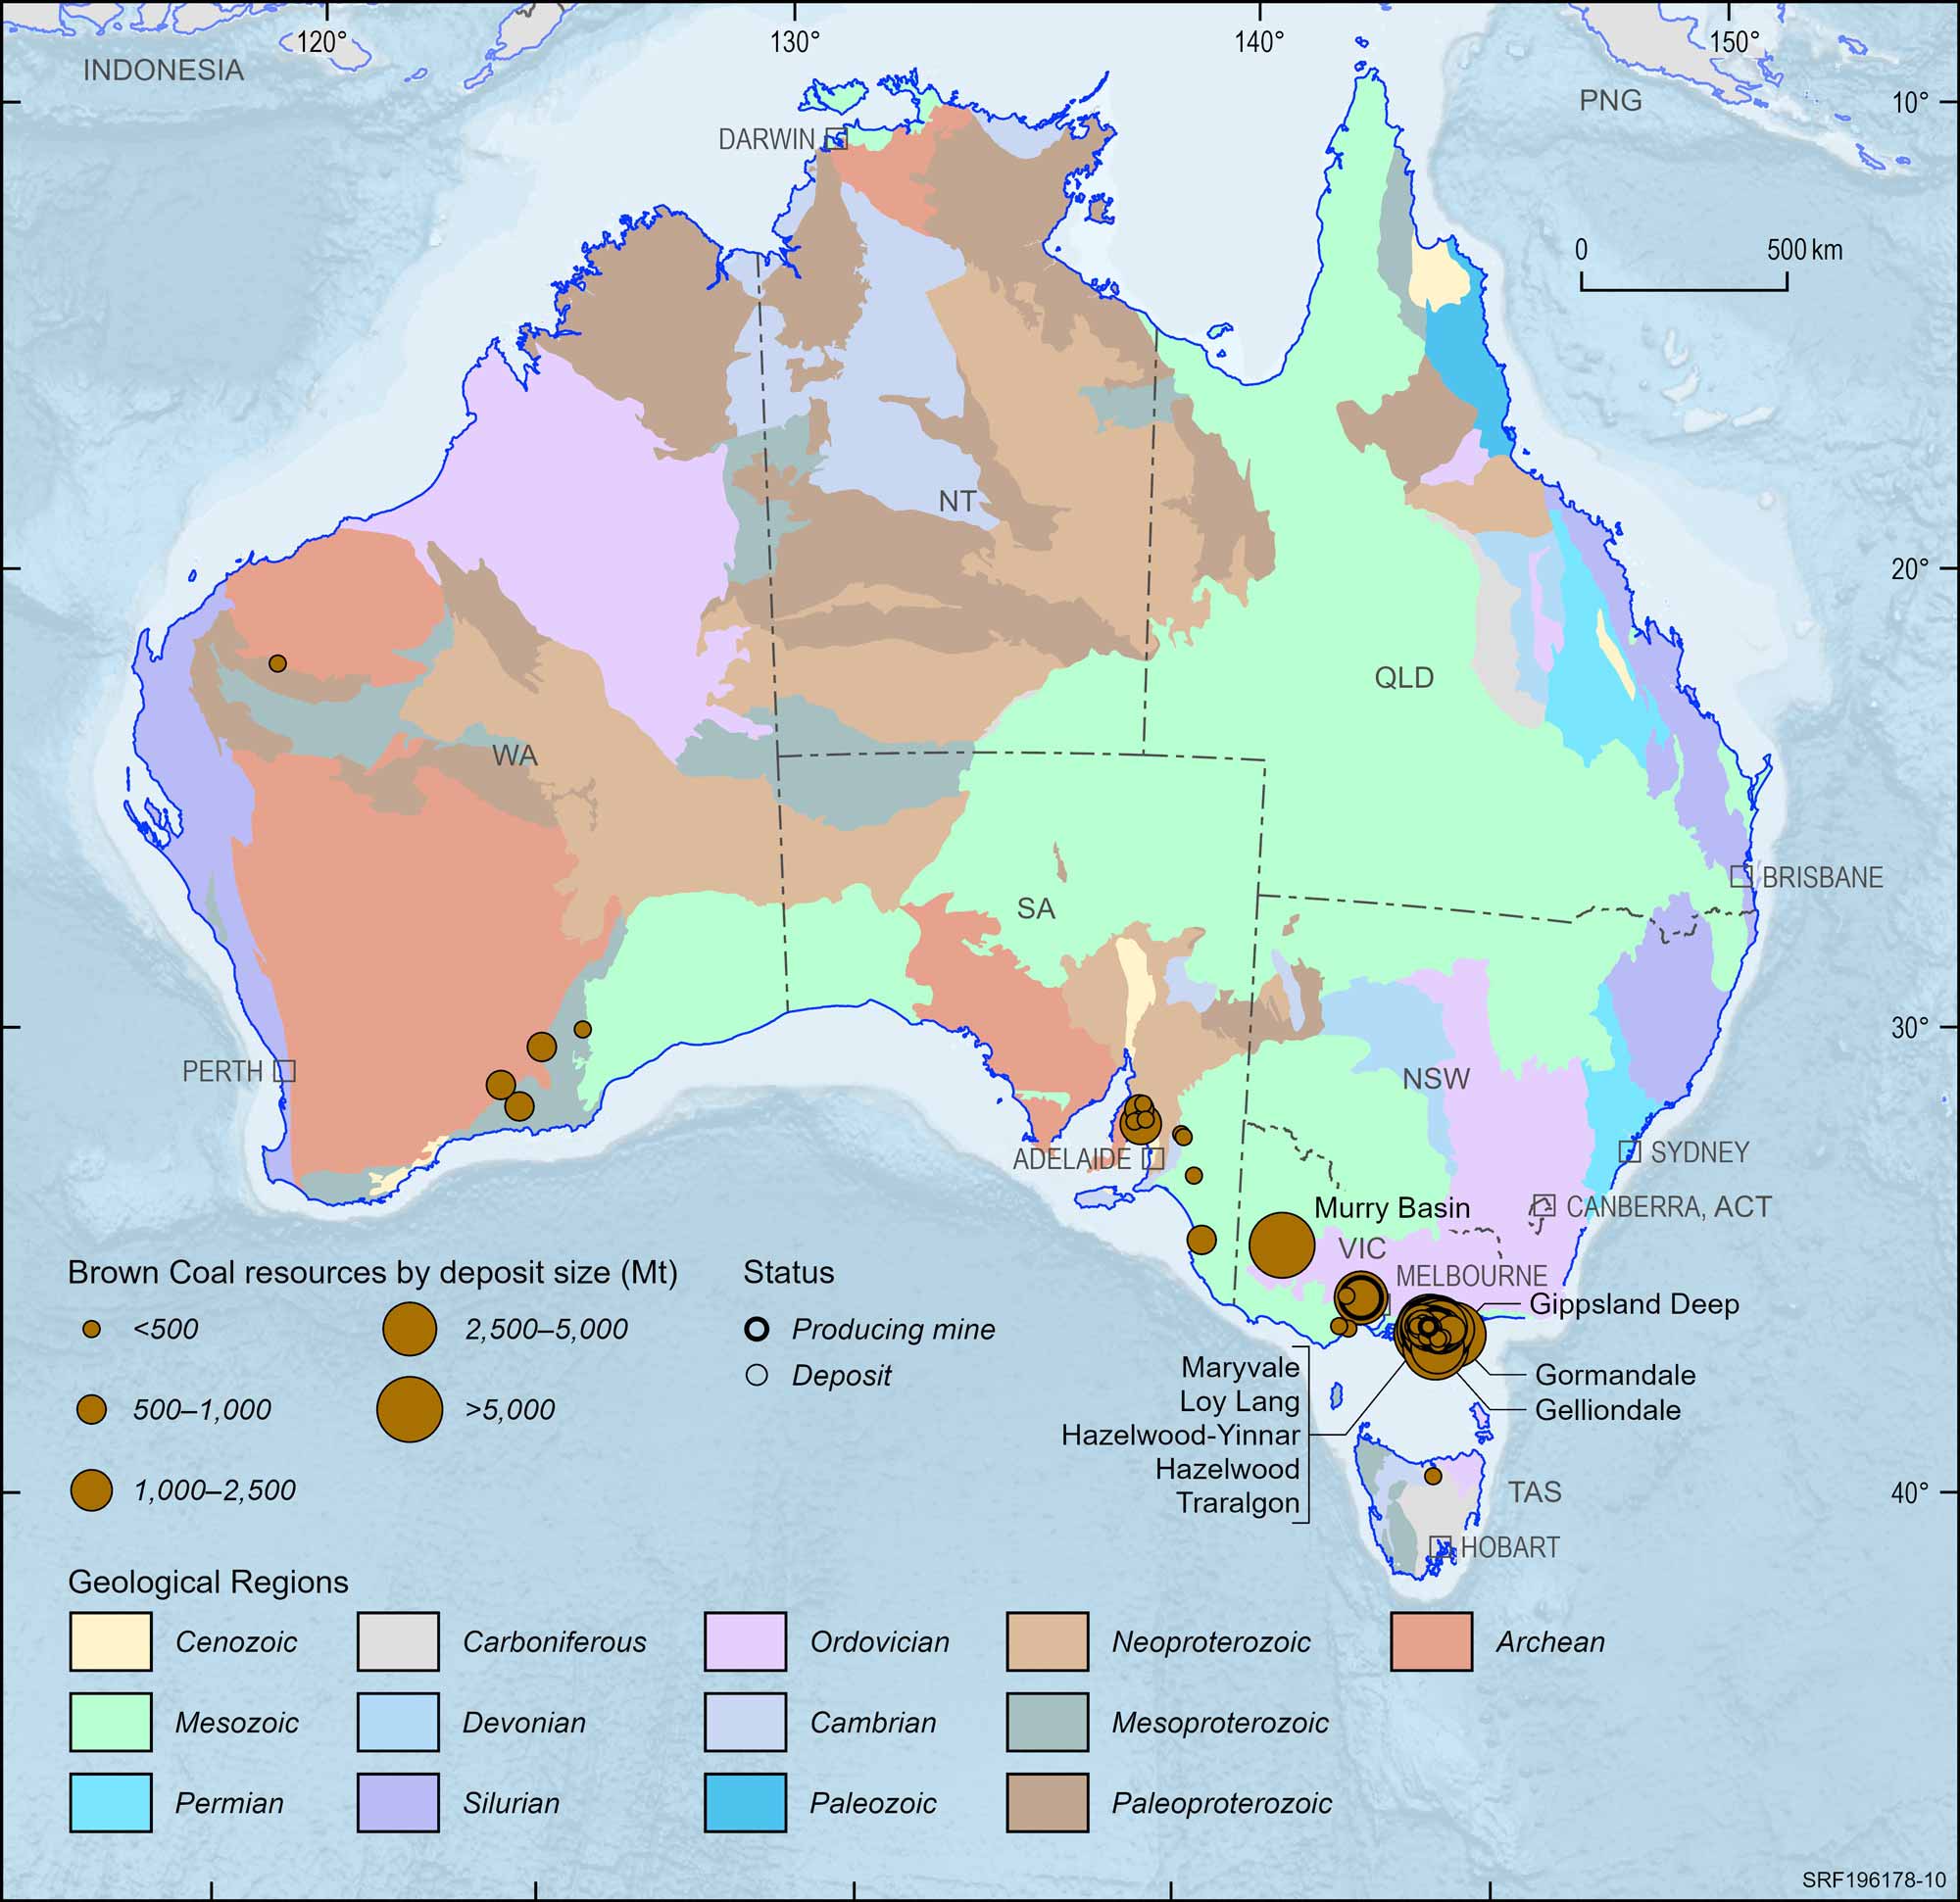
Figure 10. Australian brown coal deposits and operating mines, 2023.
Deposit size is based on total recoverable resources (EDR + Subeconomic Demonstrated Resources + Inferred).
For clarity, only major or significant deposits are labelled.
Cobalt
Critical Mineral
Operating Mines
7
1
EDR
1,690 kt Co
3%
Ore Reserves
678 kt Co
10%
Production
5.3 kt Co
9%
Export Income
258 m
50%
World Ranking
Resources
2 (16%)
Production
4 (2%)
Major Uses:
Rechargeable battery electrodes in lithium-ion batteries, electric vehicles, superalloys, pigments, catalysts and magnets.
Abbreviations
kt Co – kilotonnes of cobalt content; $m – million dollars (Australian).
Notes
Resource figures are as at 31 December 2023. Operating mines and production are for calendar year 2023. Percentage increases and decreases and changes in the number of mines are in relation to 2022. World rankings are followed by percentage share in brackets. Export income sourced from Department of Mines, Industry Regulation and Safety, Western Australian Government 2023 Major Commodities Resource Data File
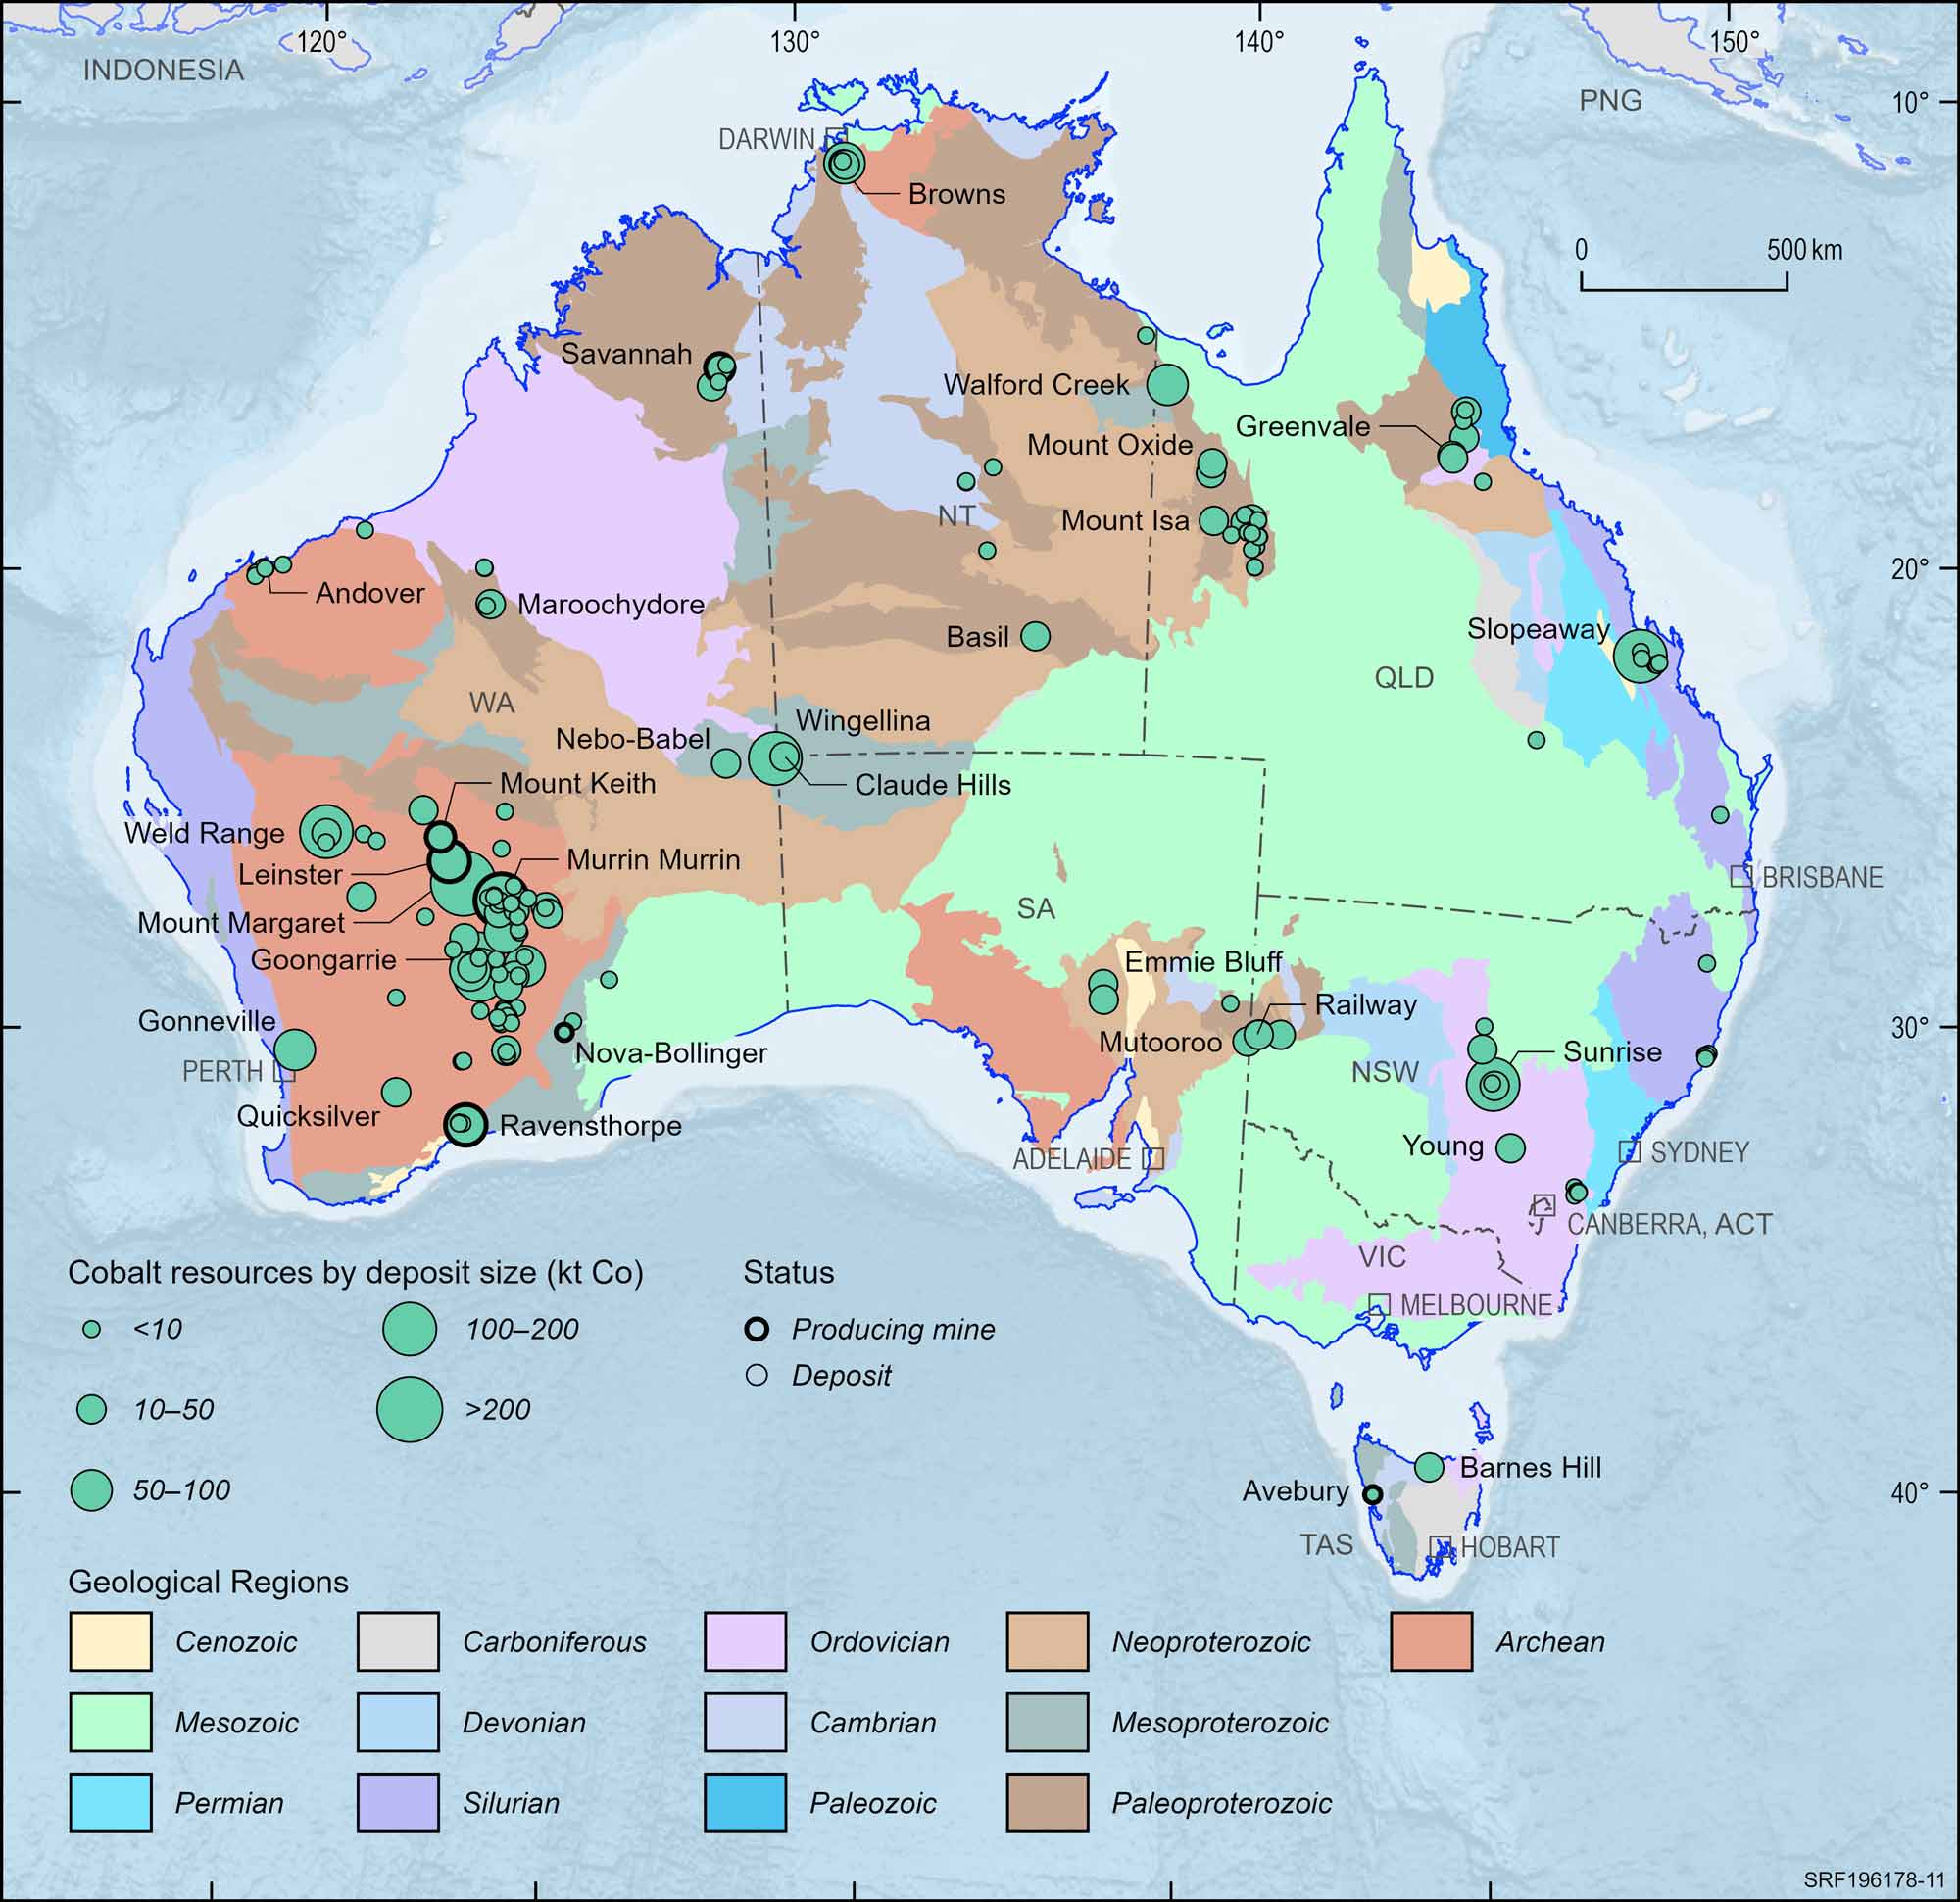
Figure 11. Australian cobalt deposits and operating mines, 2023.
Deposit size is based on total resources (EDR + Subeconomic Demonstrated Resources + Inferred).
For clarity, only major or significant deposits are labelled.
Copper
Strategic Material
Operating Mines
27
8
EDR
104.74 Mt Cu
3%
Ore Reserves
27.36 Mt Cu
0%
Production
0.78 Mt Cu
5%
Export Income
$11,691 m
6%
World Ranking
Resources
3 (10)
Production
8 (4%)
Major Uses:
Electricity distribution, electrical equipment and devices, plumbing, industrial machinery, interior fixtures, wind turbines, solar panels, electromagnets and the transport industry including electric vehicle.
Abbreviations
Mt Cu – million tonnes of copper content; $m – million dollars (Australian).
Notes
Resource figures are as at 31 December 2023. Operating mines and production are for calendar year 2023. Percentage increases or decreases are in relation to 2022. Percentage increases and decreases and changes in the number of mines are in relation to 2022. Export income is the sum of refined and ore/concentrate categories, sourced from Office of the Chief Economist, Resources and Energy Quarterly, September 2024.
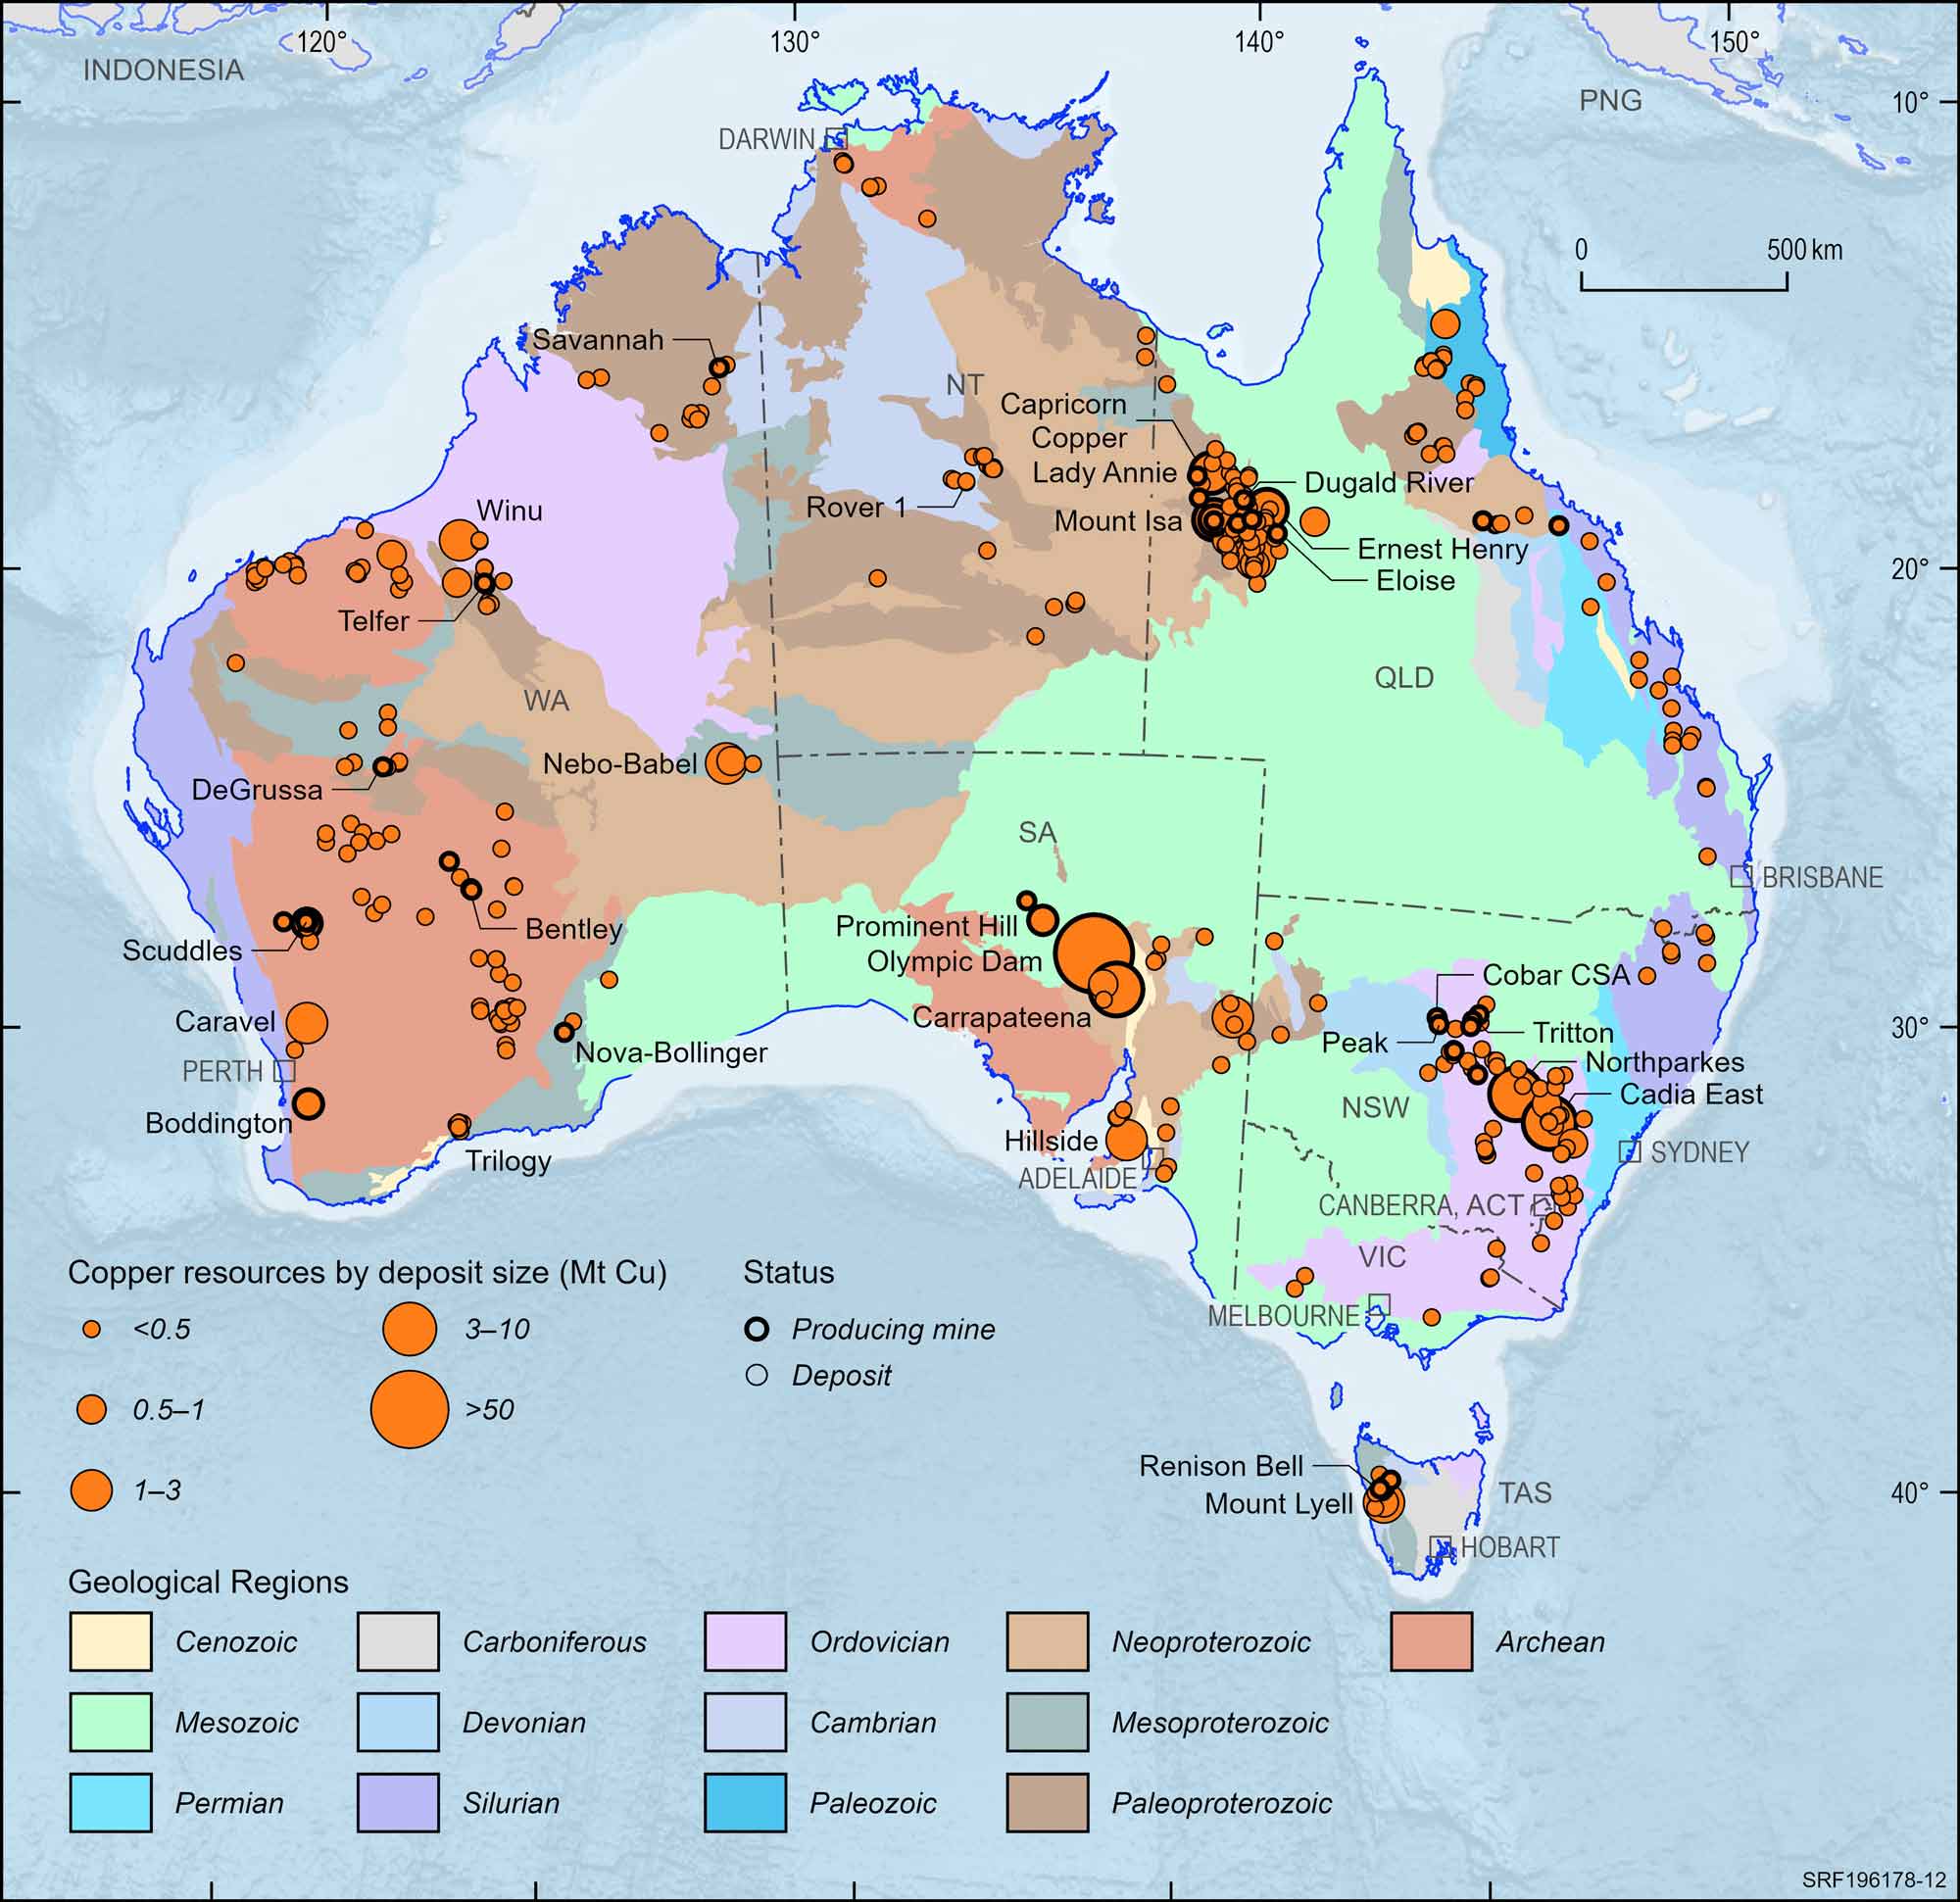
Figure 12. Australian copper deposits and operating mines, 2023.
Deposit size is based on total resources (EDR + Subeconomic Demonstrated Resources + Inferred).
For clarity, only major or significant deposits are labelled.
Diamond
Operating Mines
0
n.c.
EDR
2.81 Mc
0%
Ore Reserves
0 Mc
0%
Production
0 Mc
0%
Export Income
$344 m
123%
World Ranking
Resources
(minor)
Production
n.a. (0%)
Major Uses:
Jewellery, industrial cutting equipment, diamond machine tools, rock drilling bits, diamond polishing powders and compounds.
Abbreviations
Mc – million carats; $m – million dollars (Australian); n.a. – not available; n.c. – no change.
Notes
Resource figures are as at 31 December 2023. Operating mines and production are for calendar year 2023. Percentage increases and decreases and changes in the number of mines are in relation to 2022. World rankings are followed by percentage share in brackets. Export income is the sum of unsorted and gem categories, sourced from Office of the Chief Economist, Resources and Energy Quarterly, September 2024.
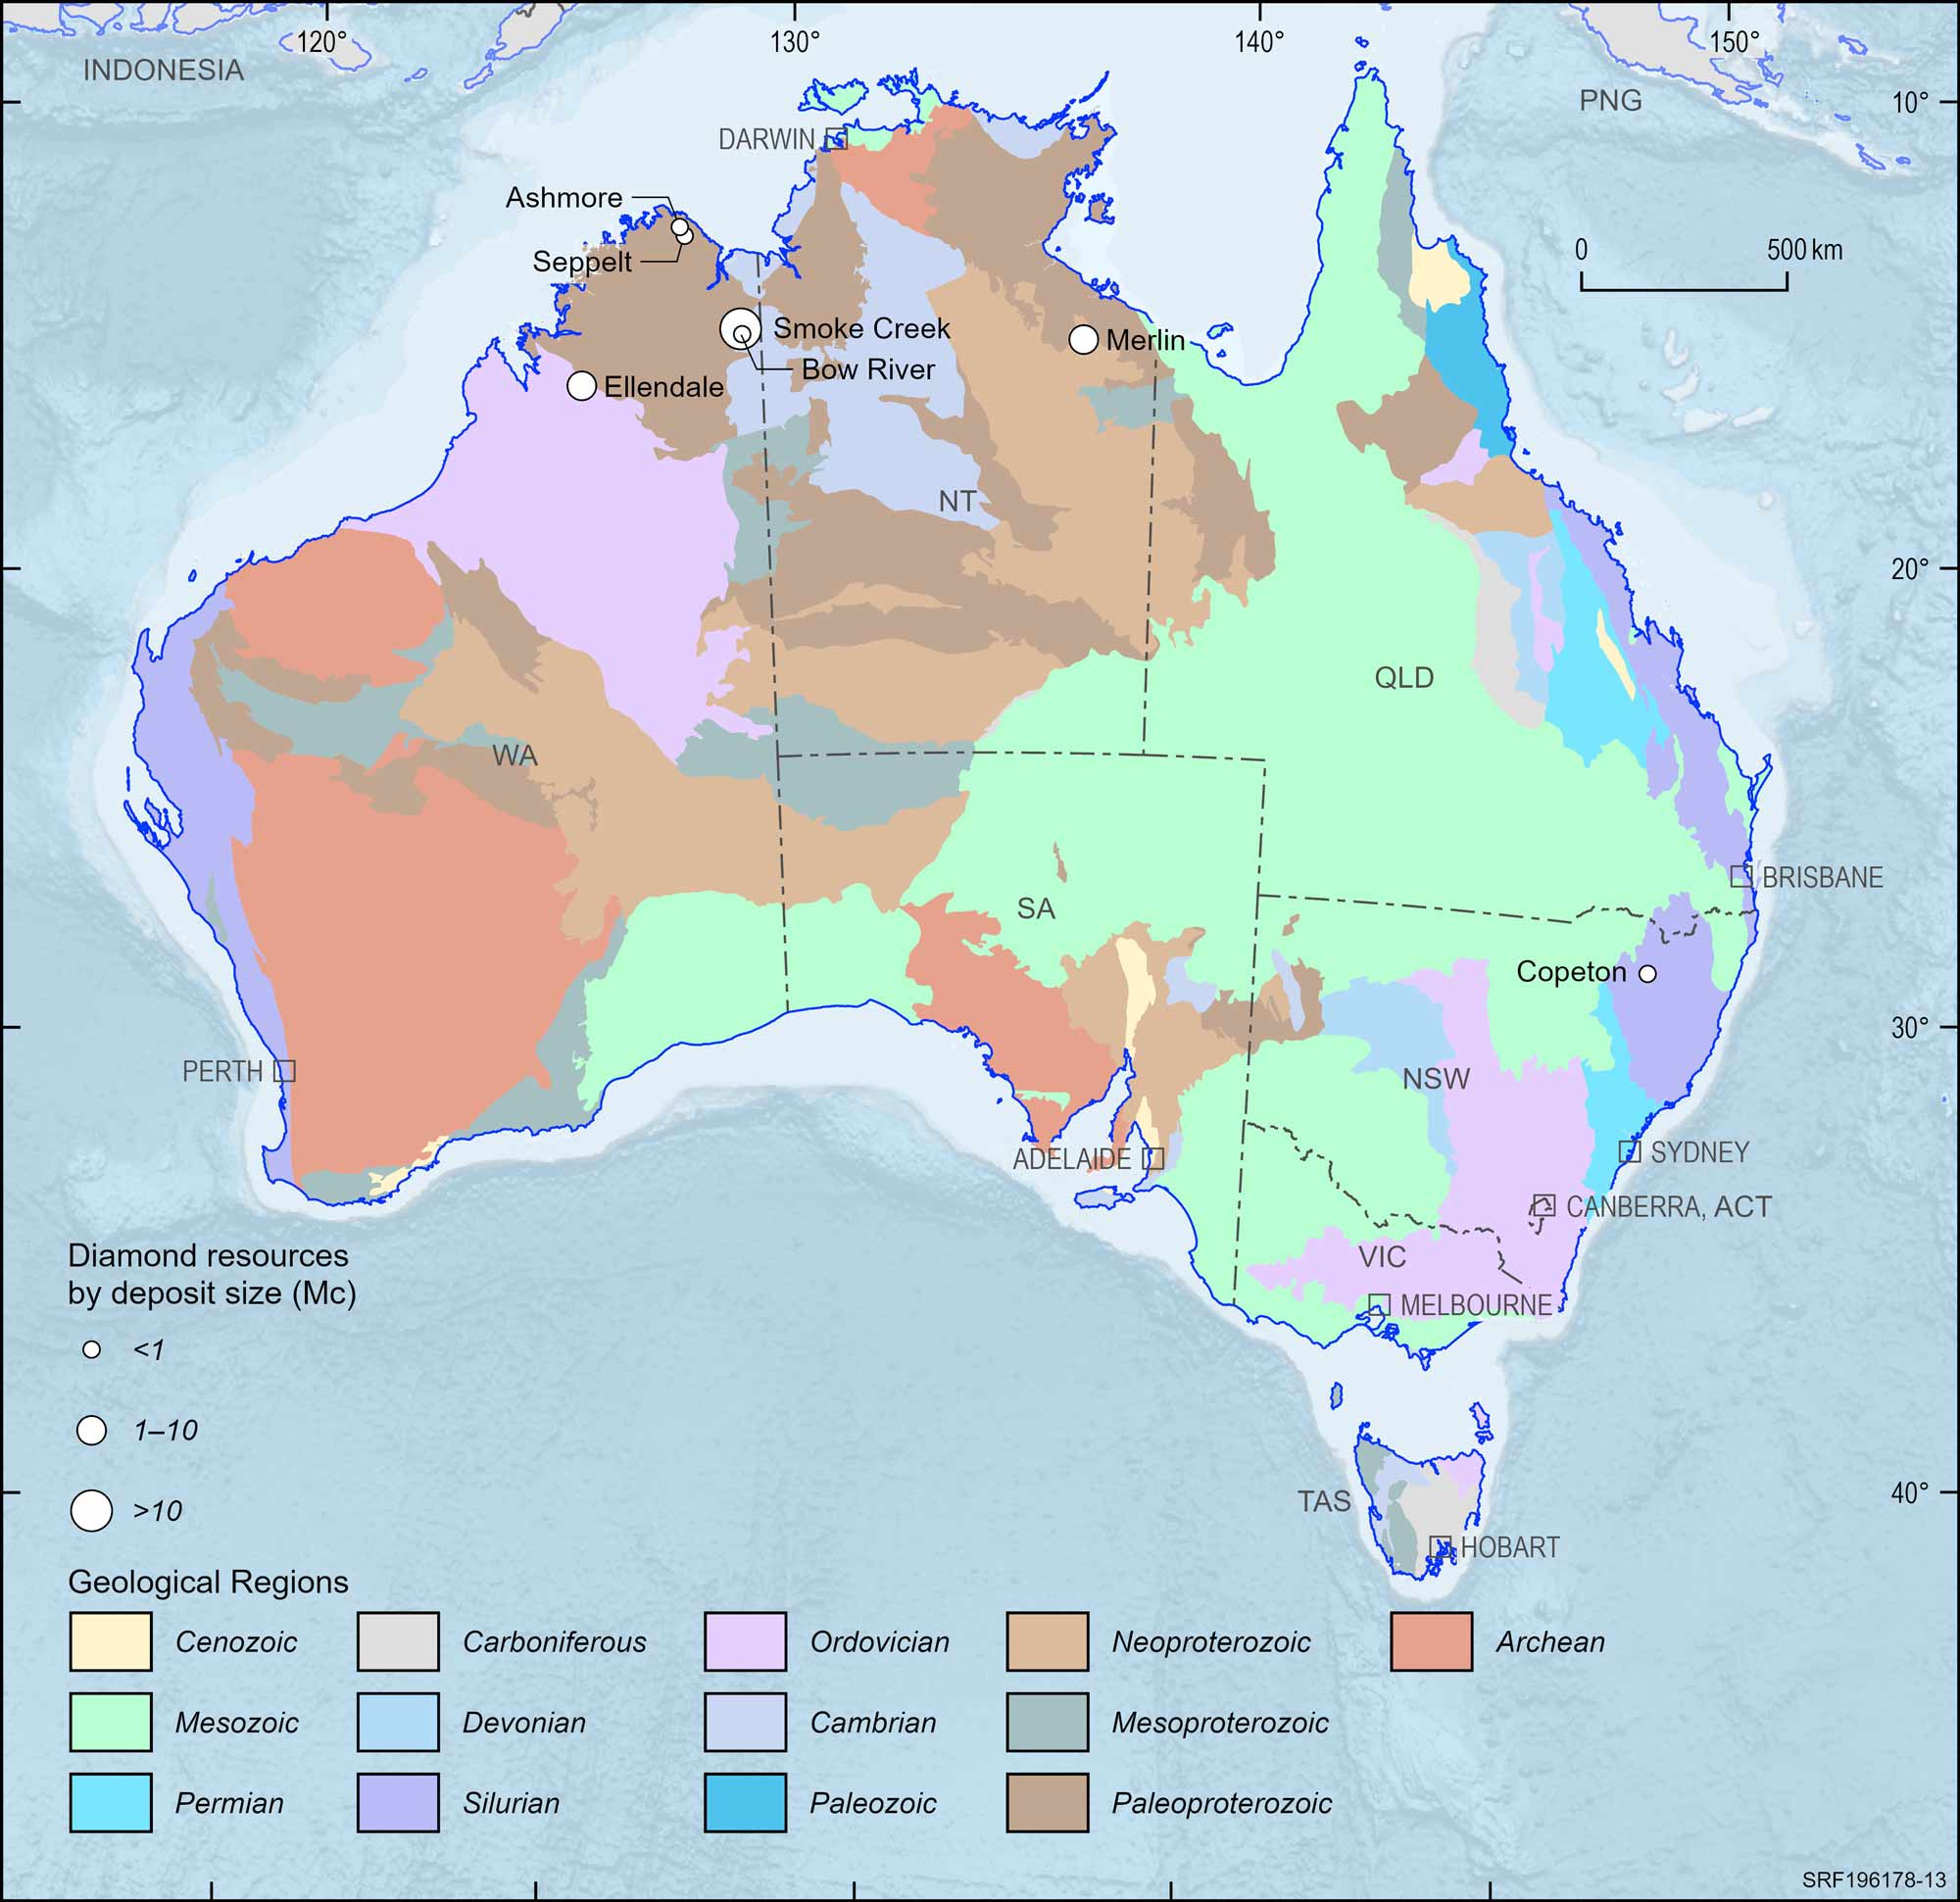
Figure 13. Australian diamond deposits, 2023.
Deposit size is based on total resources (EDR + Subeconomic Demonstrated Resources + Inferred).
Fluorine
Critical Mineral
Operating Mines
0
n.c.
EDR
343 kt F
0%
Ore Reserves
0 kt F
0%
Production
0 kt F
0%
Export Income
n.a.
0%
World Ranking
Resources
8 (minor)
Production
n.a. (0%)
Major Uses:
Welding, the nuclear energy industry, plastics such as Teflon, an additive to water supplies and toothpaste to prevent tooth decay. Used in semiconductor manufacture and solar photovoltaic cells.
Abbreviations
kt F – kilotonnes of fluorine content; $m – million dollars (Australian); n.a. – not available; n.c. – no change.
Notes
Resource figures are as at 31 December 2023. Operating mines and production are for calendar year 2023. Percentage increases and decreases and changes in the number of mines are in relation to 2022. World rankings are followed by percentage share in brackets.
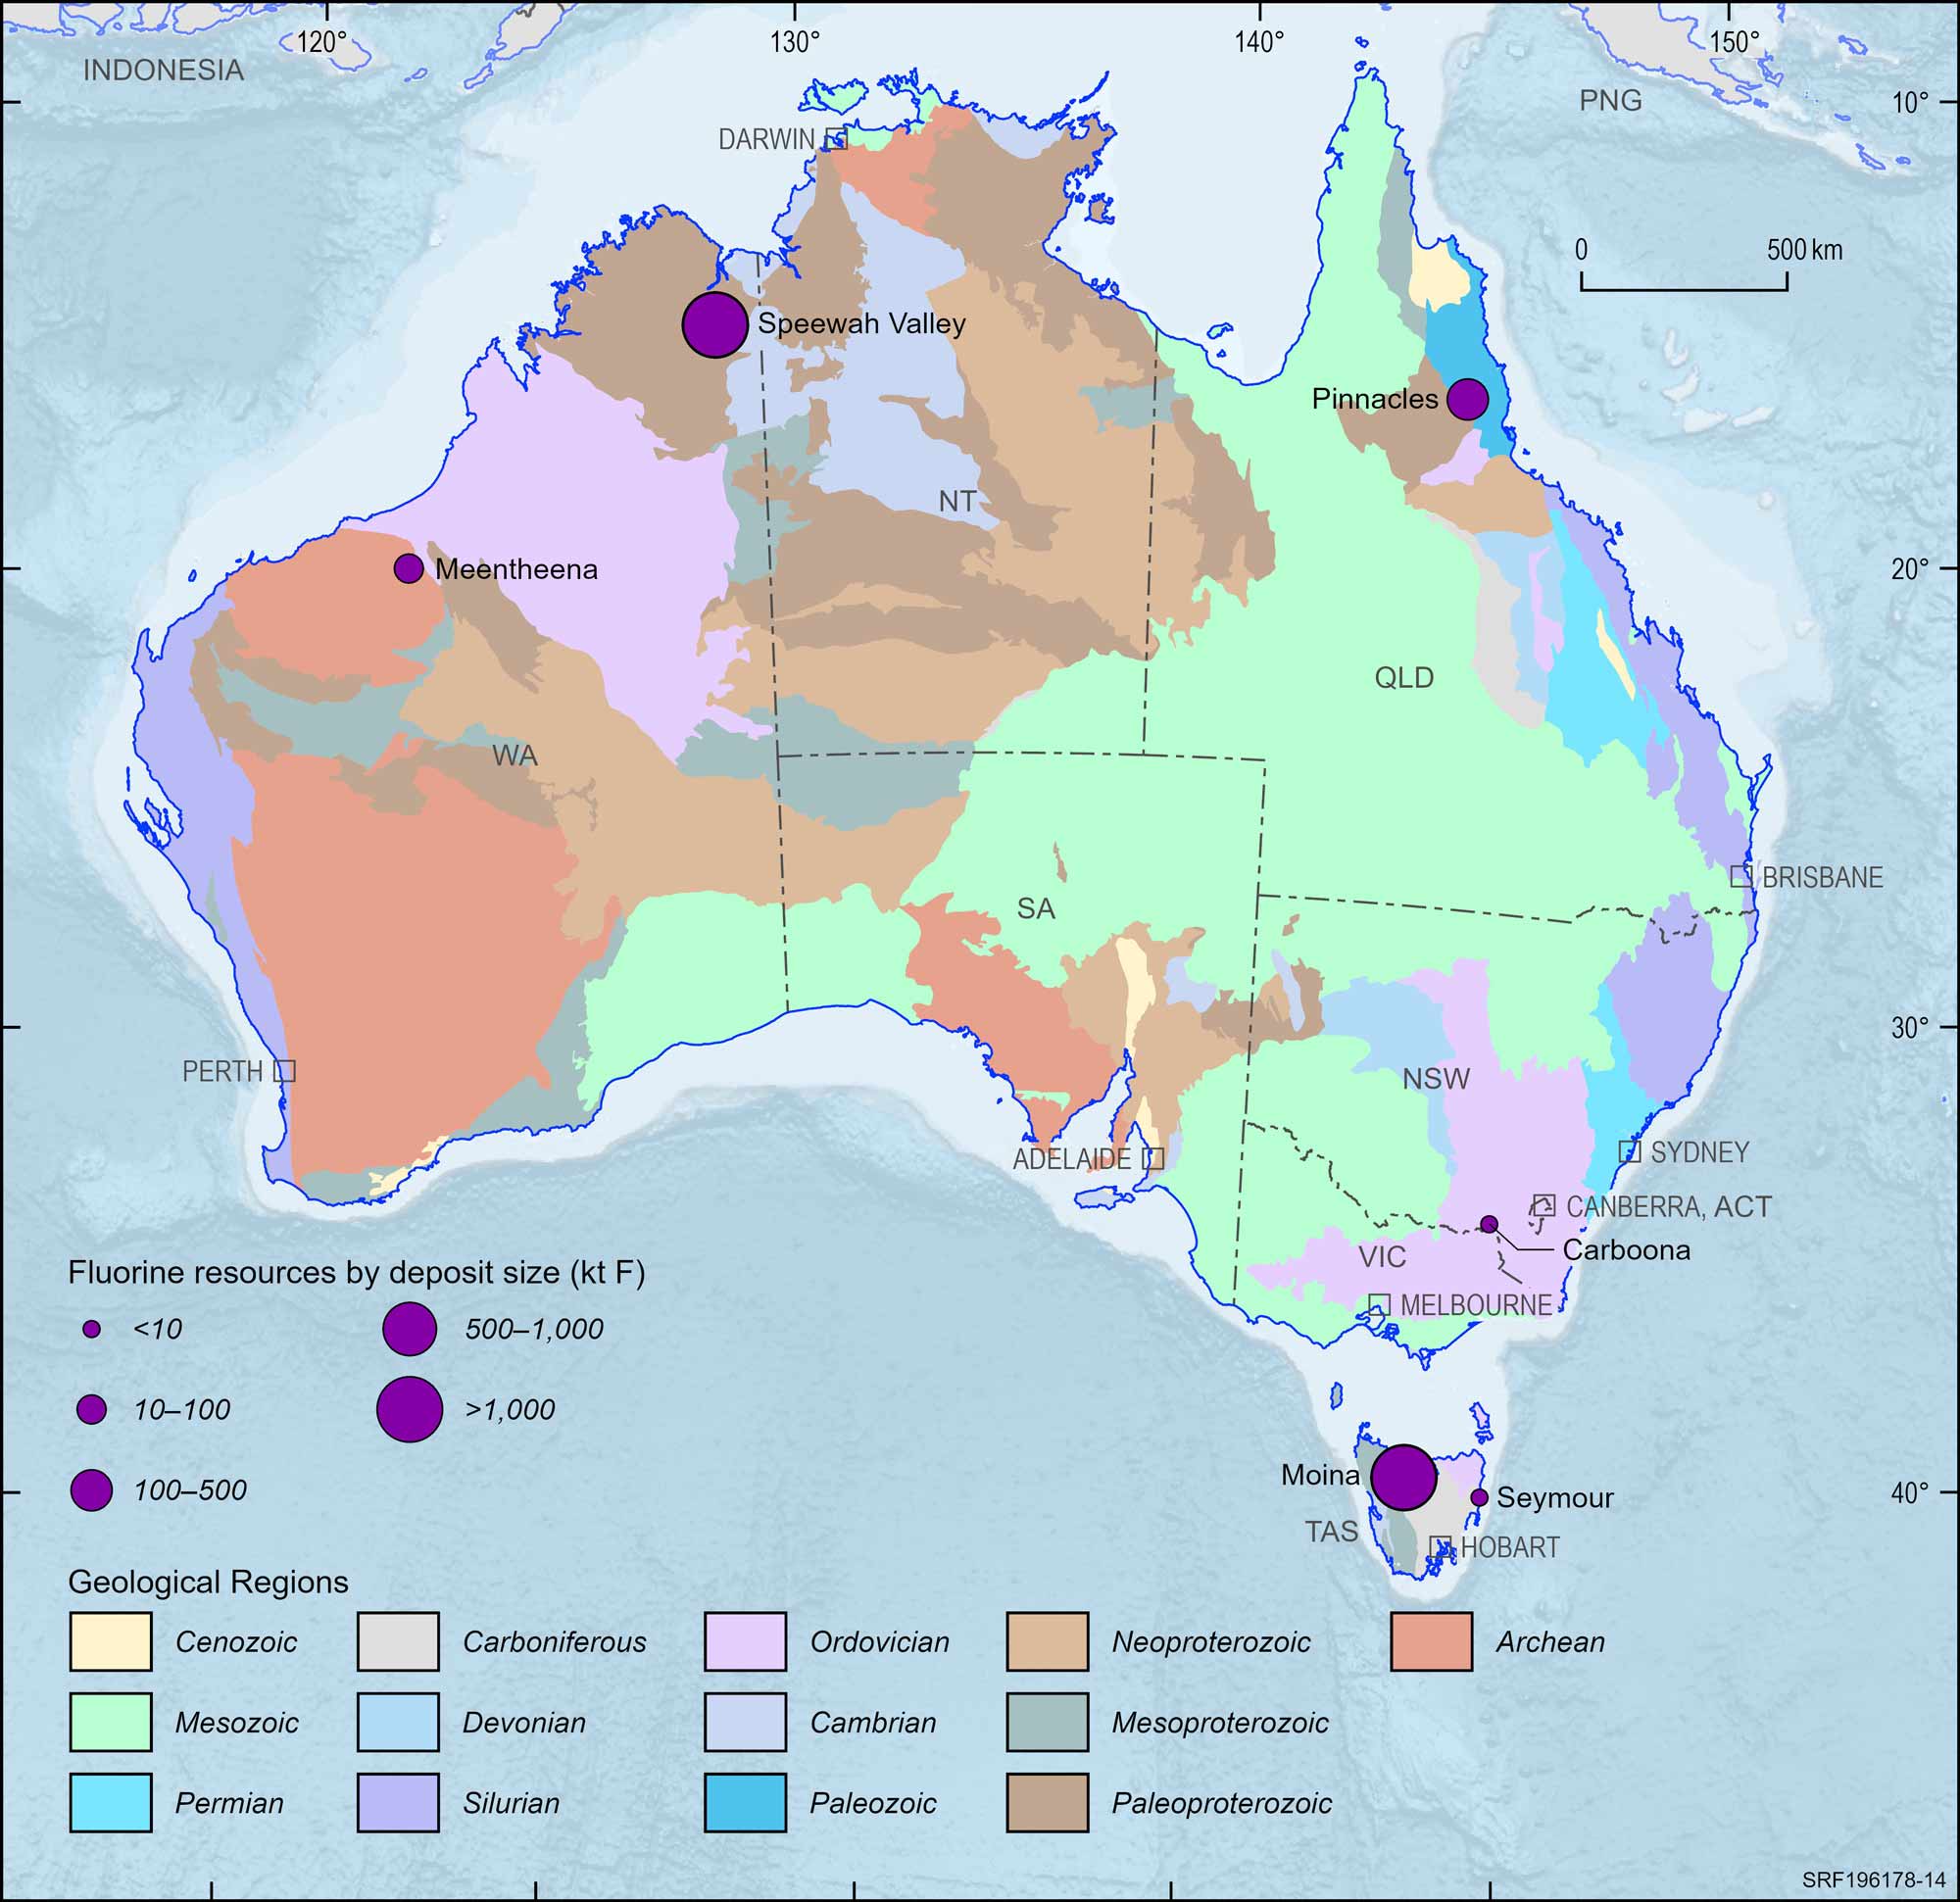
Figure 14. Australian fluorine deposits, 2023.
Deposit size is based on total resources (EDR + Subeconomic Demonstrated Resources + Inferred).
Gold
Operating Mines
157
3
EDR
12,676 t Au
4%
Ore Reserves
4,486 t Au
3%
Production
296 t Au
3%
Export Income
$28,339 m
21%
World Ranking
Resources
1 (21%)
Production
3 (10%)
Major Uses:
Jewellery, storing monetary value, personal electronic devices, computers, dentistry and aerospace industries.
Abbreviations
t Au – tonnes of gold content; $m – million dollars (Australian).
Notes
Resource figures are as at 31 December 2023. Operating mines and production are for calendar year 2023. Percentage increases and decreases and changes in the number of mines are in relation to 2022. World rankings are followed by percentage share in brackets. Export income sourced from Office of the Chief Economist, Resources and Energy Quarterly, September 2024
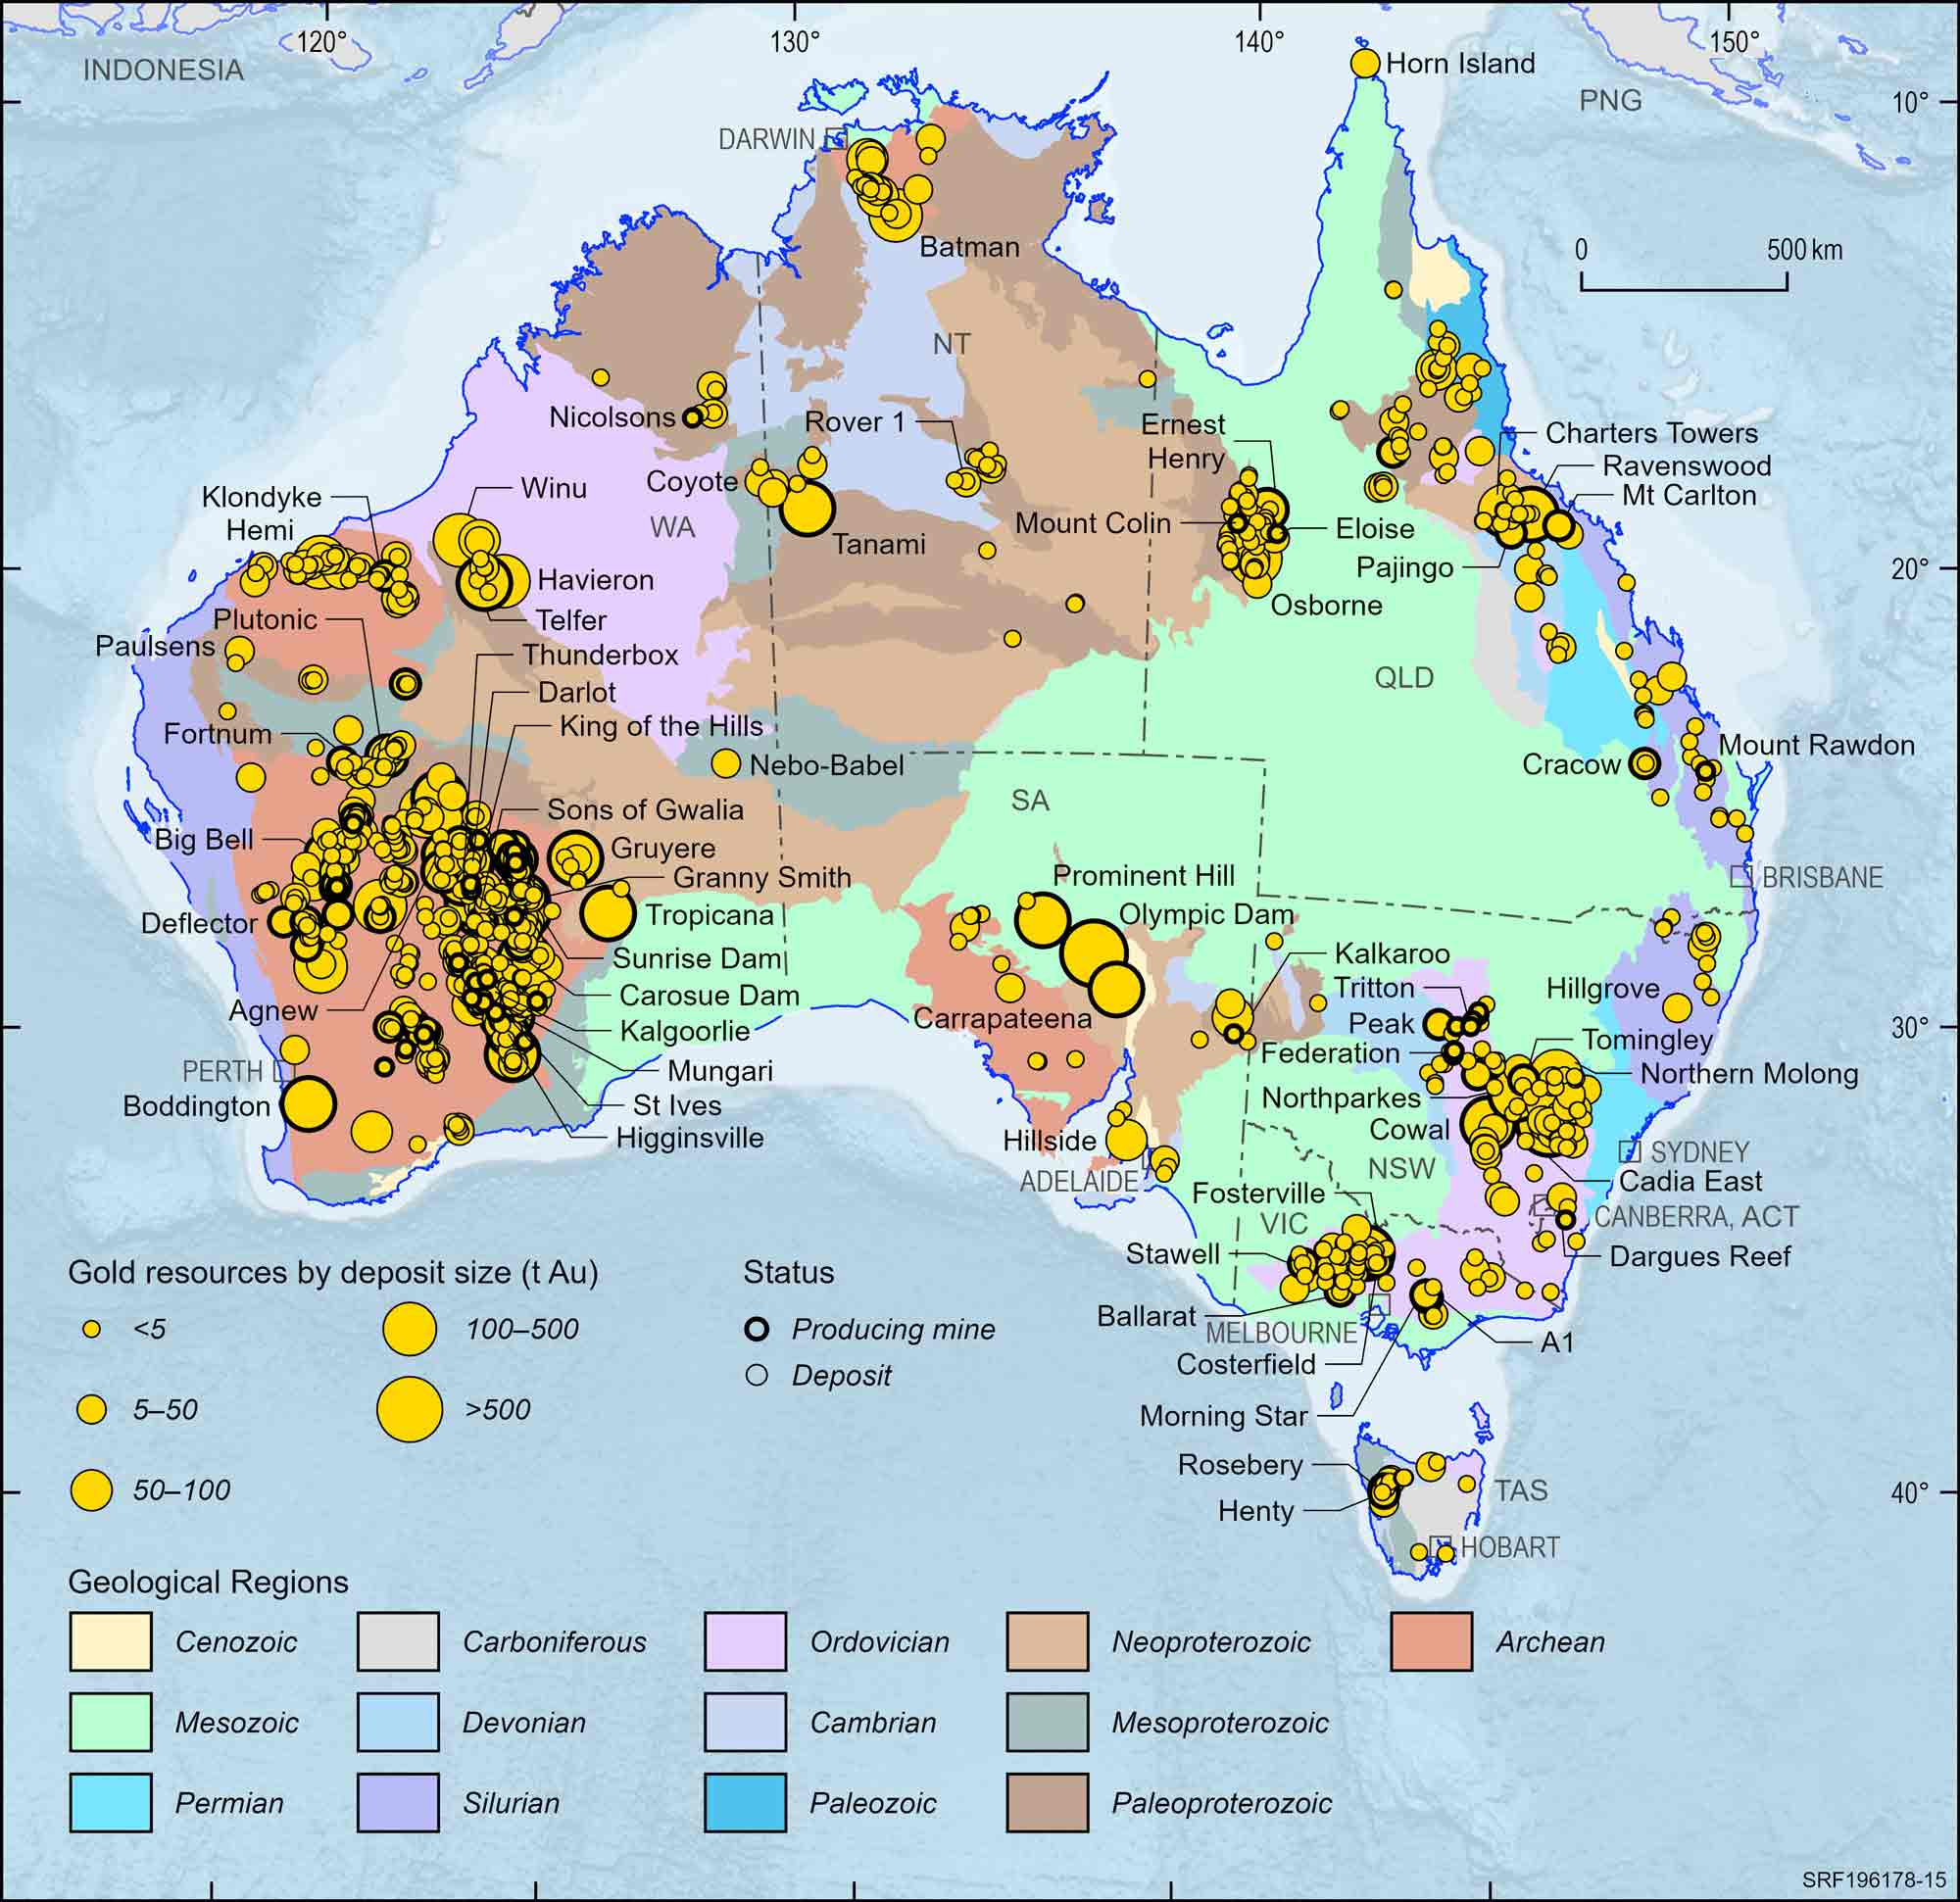
Figure 15. Australian gold deposits and operating mines, 2023.
Deposit size is based on total resources (EDR + Subeconomic Demonstrated Resources + Inferred).
For clarity, only major or significant deposits are labelled.
Graphite
Critical Mineral
Operating Mines
0
n.c.
EDR
10.8 Mt
27%
Ore Reserves
5.4 Mt
8%
Production
0 Mt
0%
Export Income
n.a.
0%
World Ranking
Resources
8 (4%)
Production
n.a. (0%)
Major Uses:
Anode component of lithium-ion batteries, refractory materials, lubricants and pencils.
Abbreviations
Mt – million tonnes; $m – million dollars (Australian); n.a. – not available; n.c. – no change.
Notes
Resource figures are as at 31 December 2023. Operating mines and production are for calendar year 2023. Percentage increases and decreases and changes in the number of mines are in relation to 2022. World rankings are followed by percentage share in brackets.
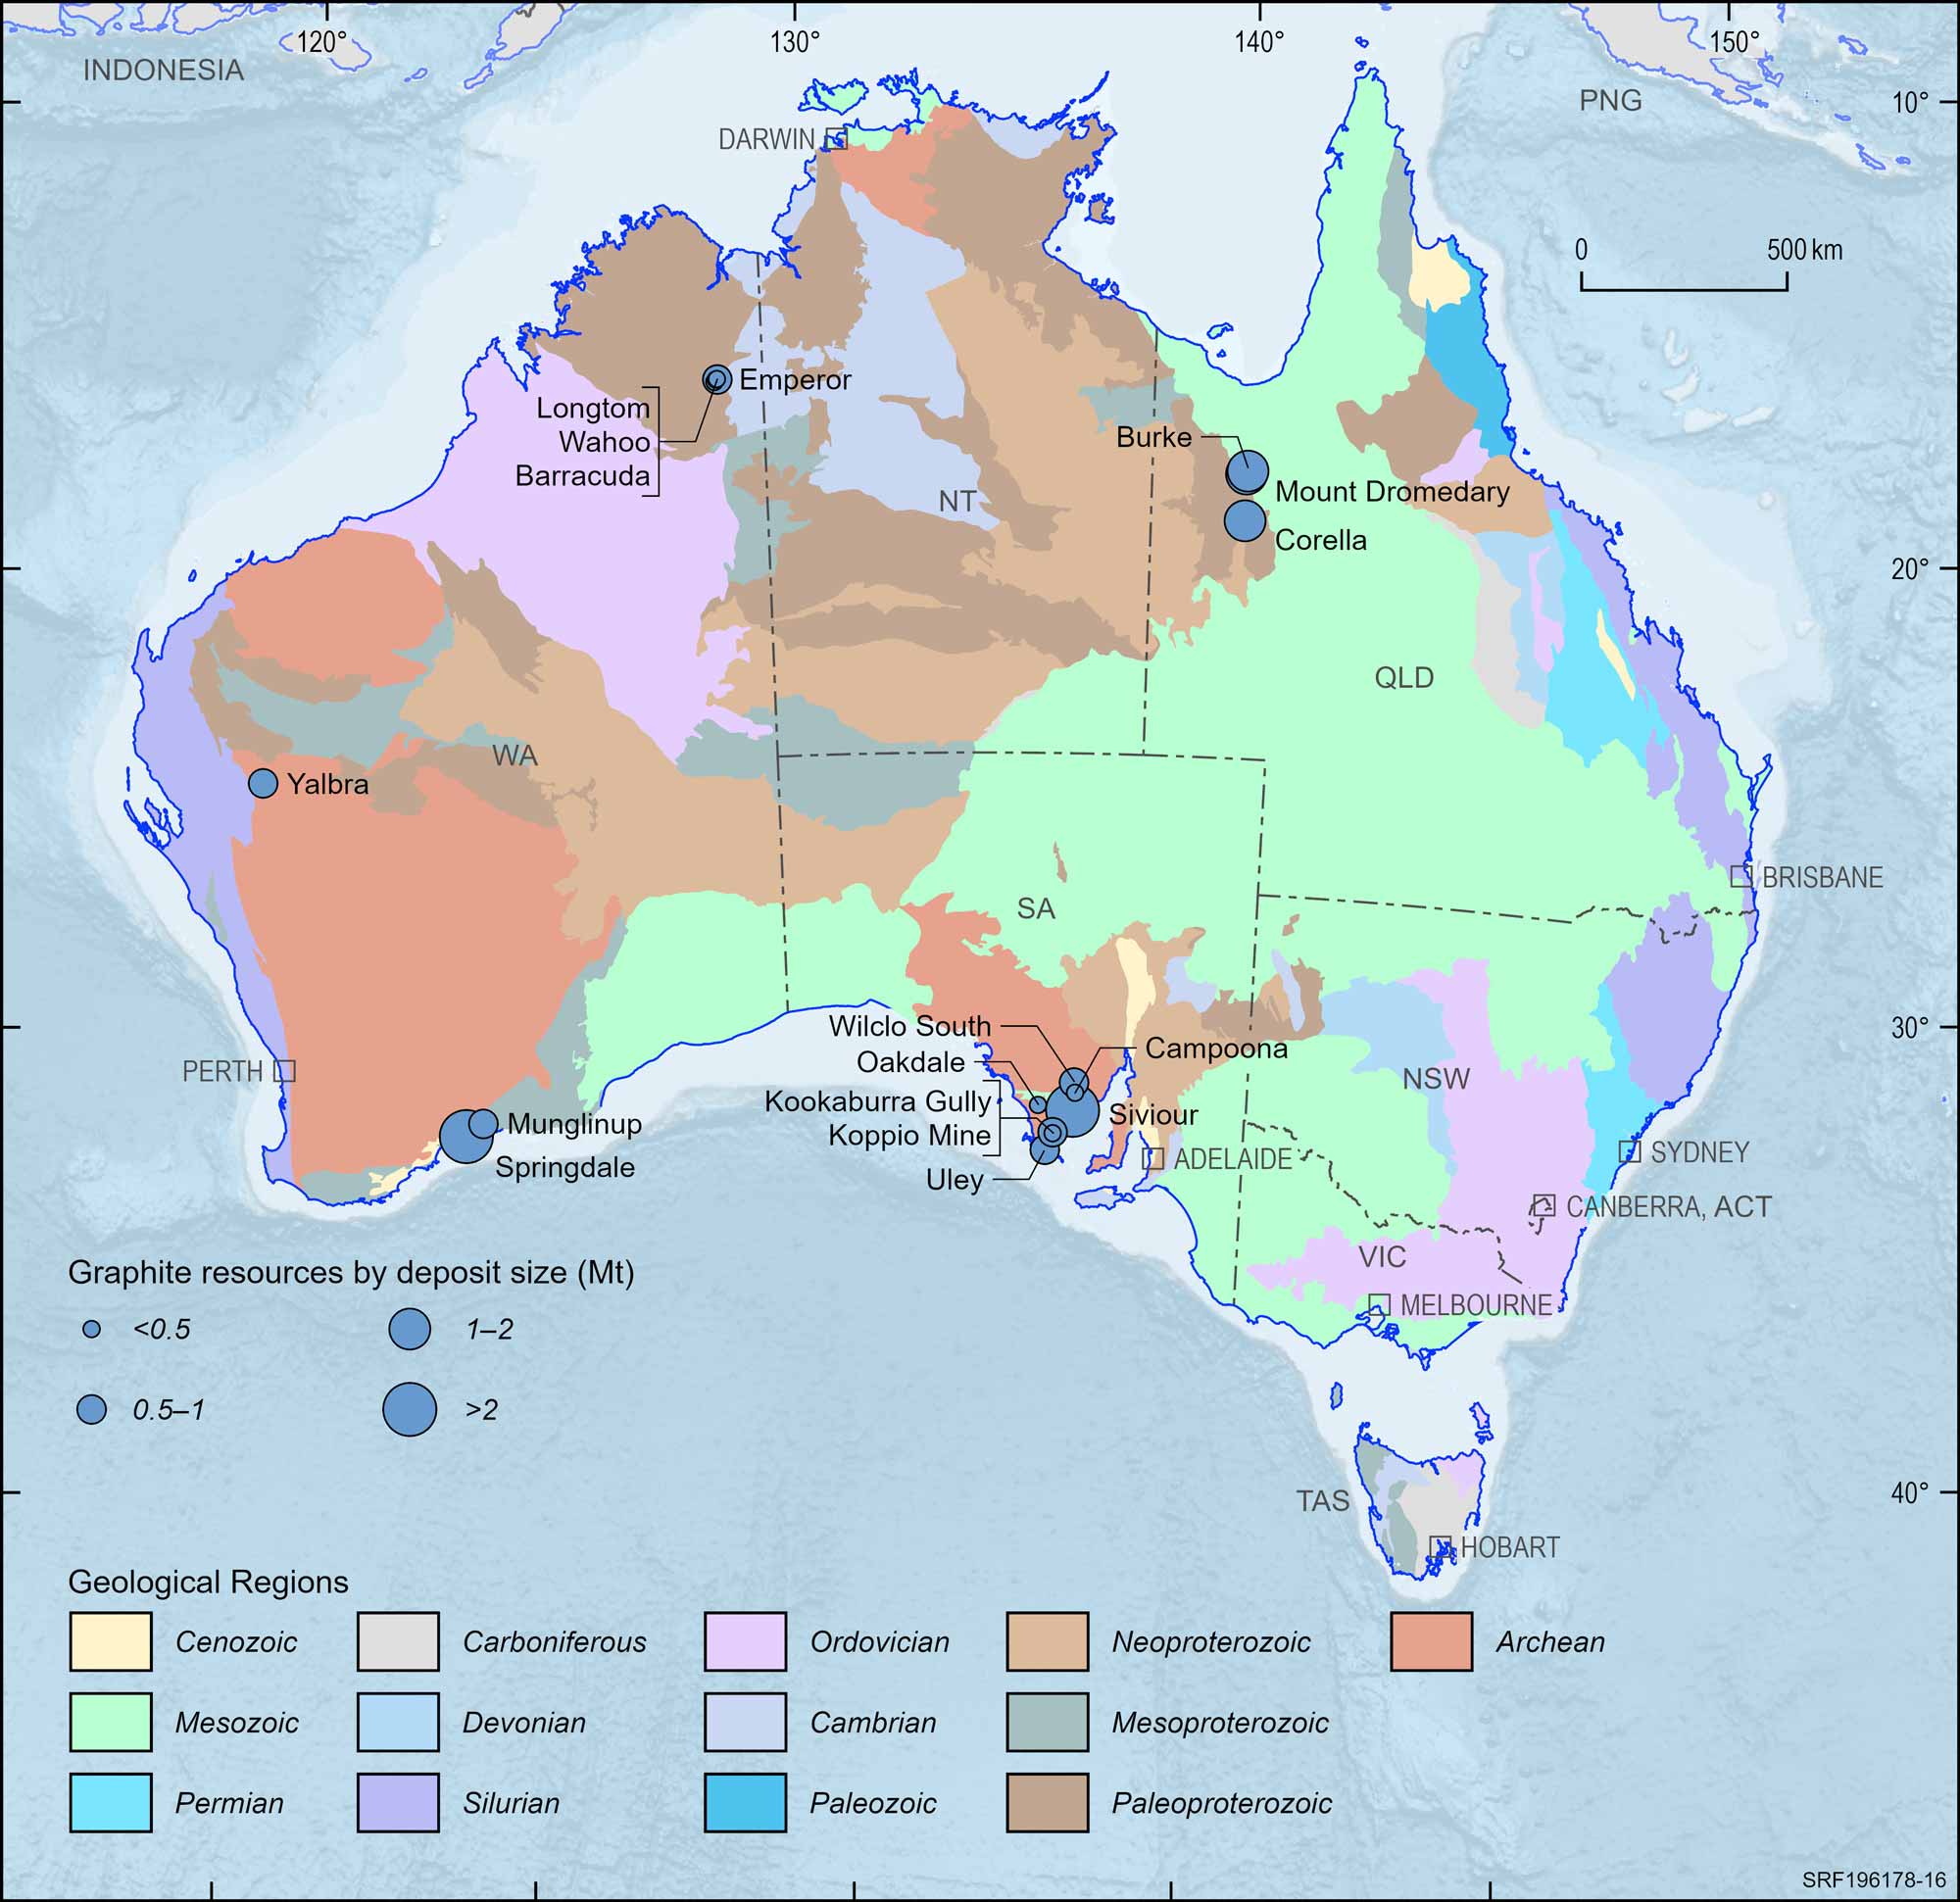
Figure 16. Australian graphite deposits, 2023.
Deposit size is based on total resources (EDR + Subeconomic Demonstrated Resources + Inferred).
High Purity Alumina Ore
Critical Mineral
Operating Mines
0
n.c.
EDR
19.1 Mt
14%
Ore Reserves
1.2 Mt
0%
Production
0 Mt
0%
Export Income
n.a.
0%
World Ranking
Resources
unknown
Production
n.a. (0%)
Major Uses:
High-purity alumina ore is characterised by its purity levels (i.e. ≥99.99% Al2O3). It is used in electronics and lithium-ion batteries by the automotive and aerospace sectors.
Abbreviations
Mt – million tonnes; $m – million dollars (Australian); n.a. – not available; n.c. – no change.
Notes
Resource figures are as at 31 December 2023. Operating mines and production are for calendar year 2023. Percentage increases and decreases and changes in the number of mines are in relation to 2022. World rankings are followed by percentage share in brackets.
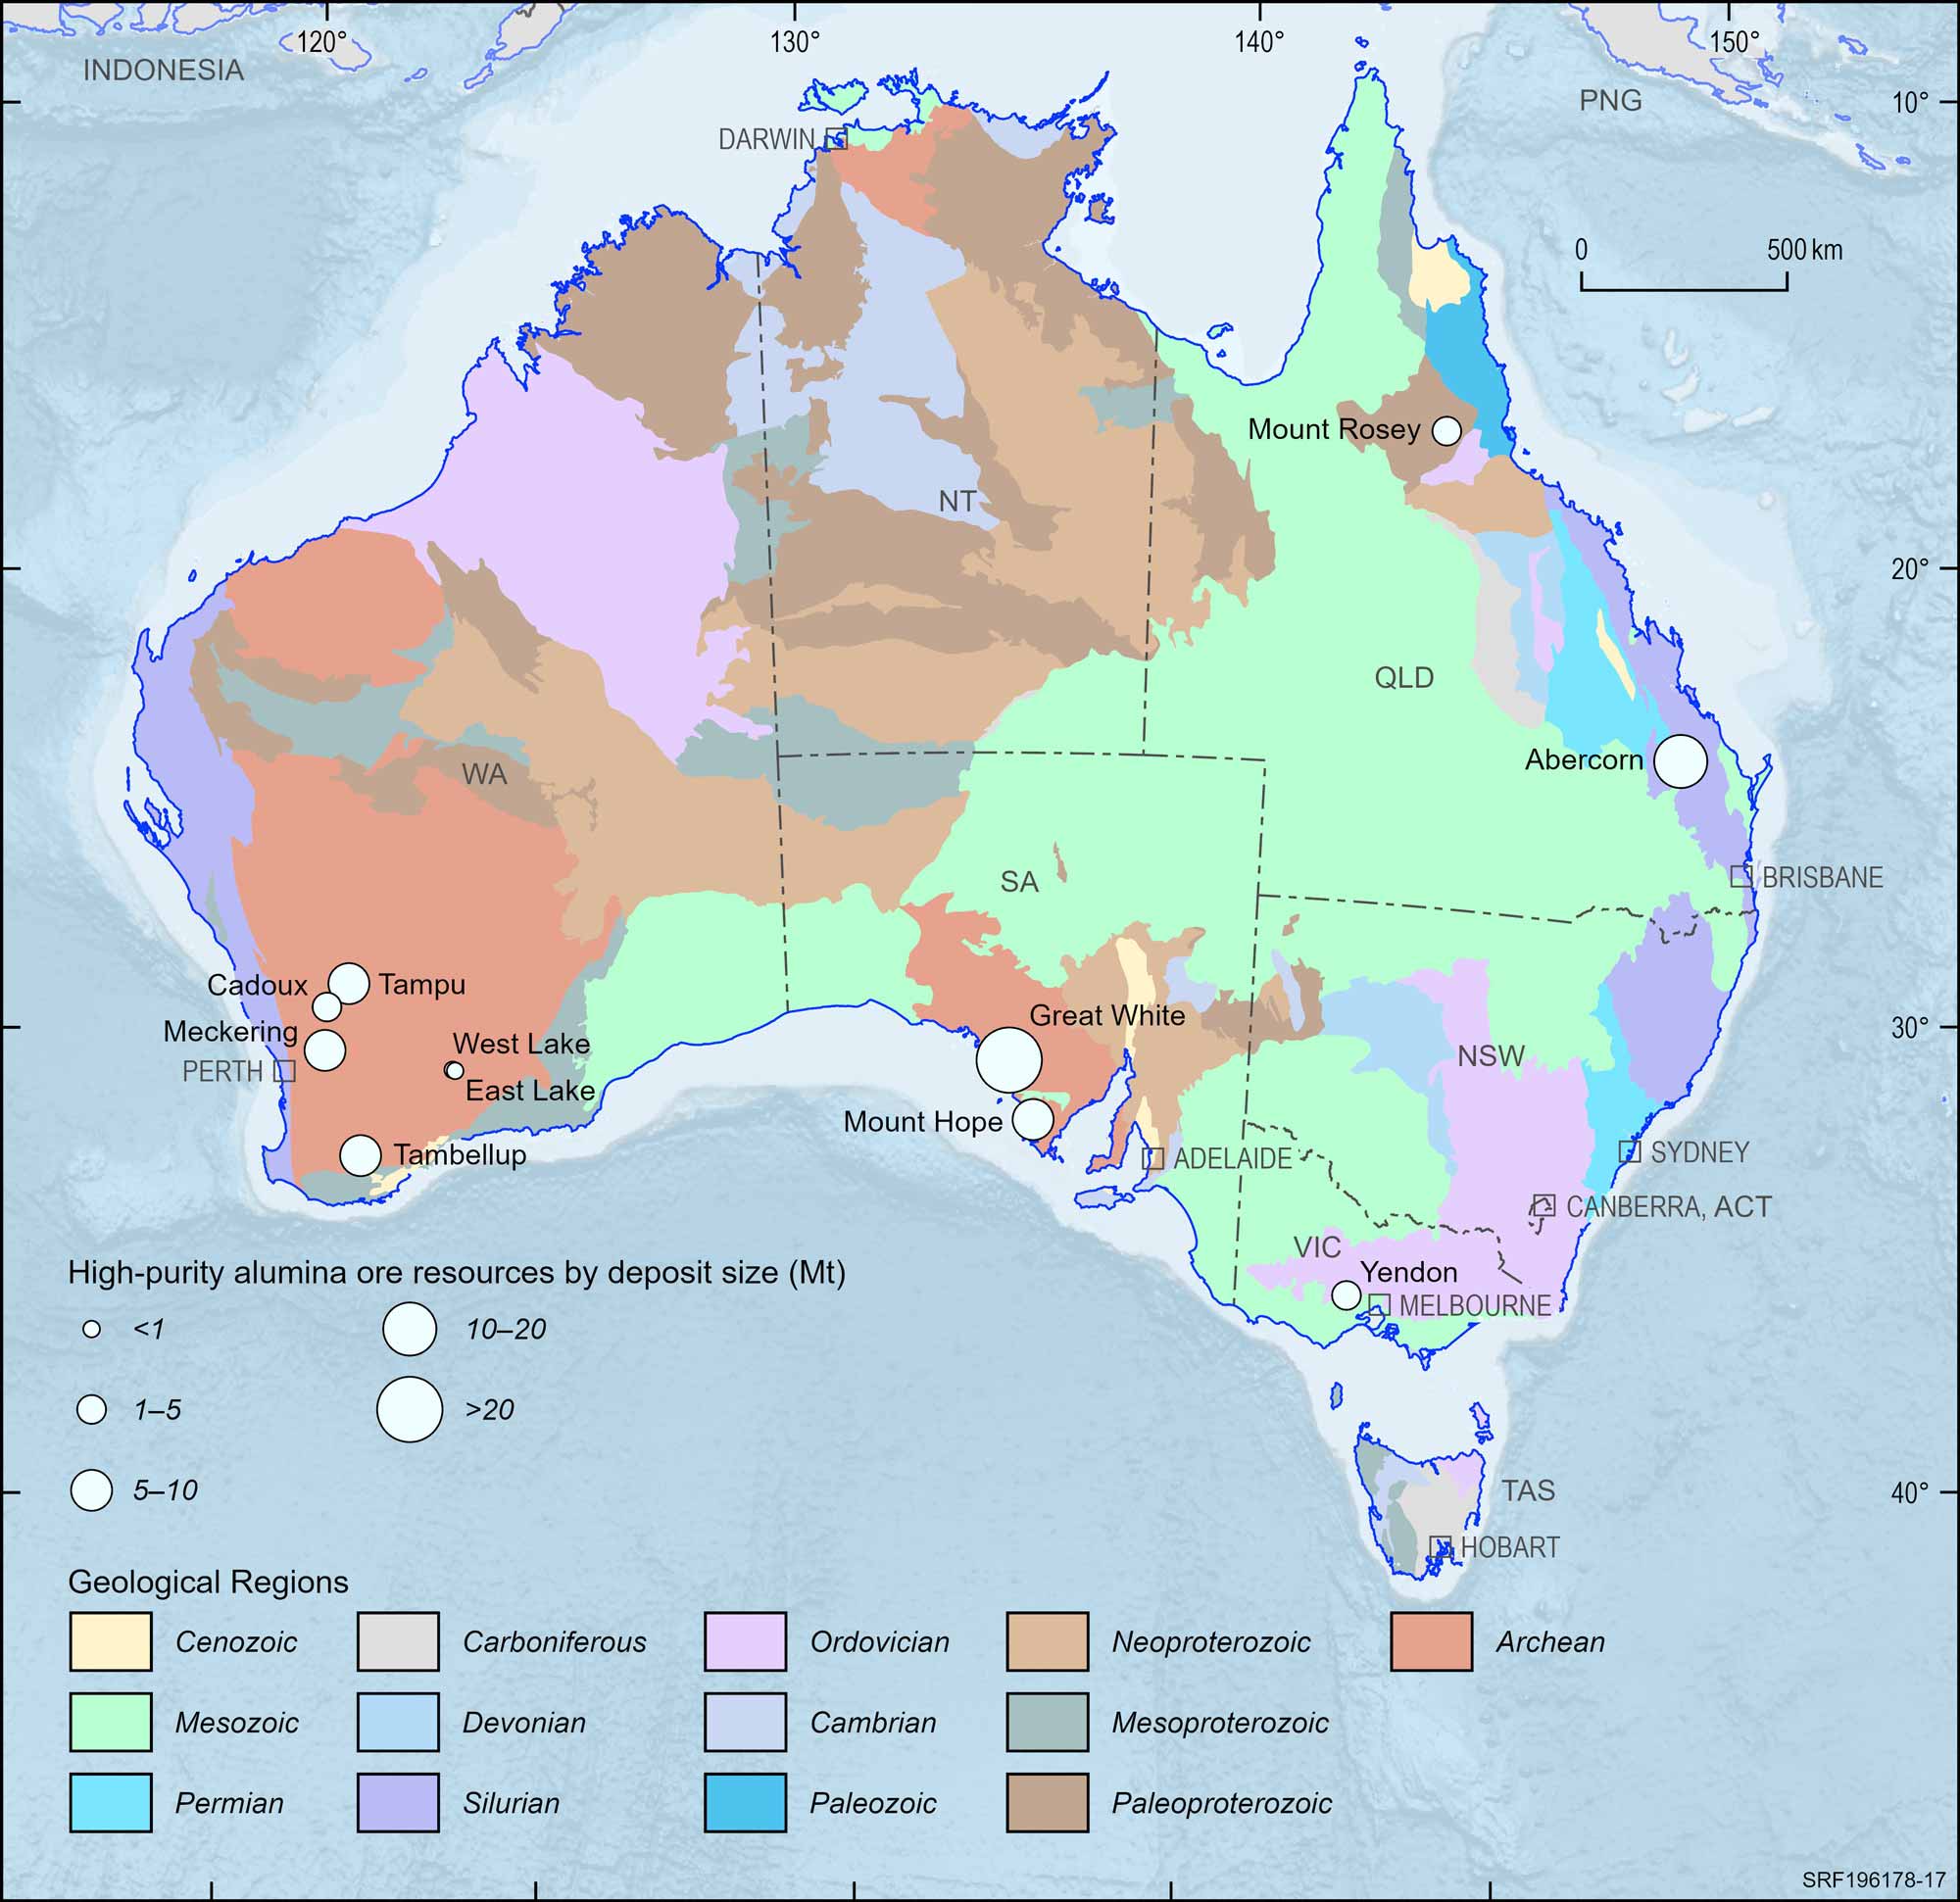
Figure 17. Australian high-purity alumina ore deposits, 2023.
Deposit size is based on total resources (EDR + Subeconomic Demonstrated Resources + Inferred).
Iron Ore
Operating Mines
46
5
EDR
58,622 Mt
1%
Ore Reserves
24,405 Mt
7%
Production
953 Mt
1%
Export Income
$136,257 m
10%
World Ranking
Resources
1 (31%)
Production
1 (38%)
Major Uses:
Steel and stainless steel manufacture, civil engineering, transport, cast iron, magnets and alloys.
Abbreviations
Mt – million tonnes; $m – million dollars (Australian).
Notes
Resource figures are as at 31 December 2023. Operating mines and production are for calendar year 2023. Percentage increases and decreases and changes in the number of mines are in relation to 2022. World rankings are followed by percentage share in brackets. Export income is the sum of ore, crude steel and scrap categories, sourced from Office of the Chief Economist, Resources and Energy Quarterly, September 2024.
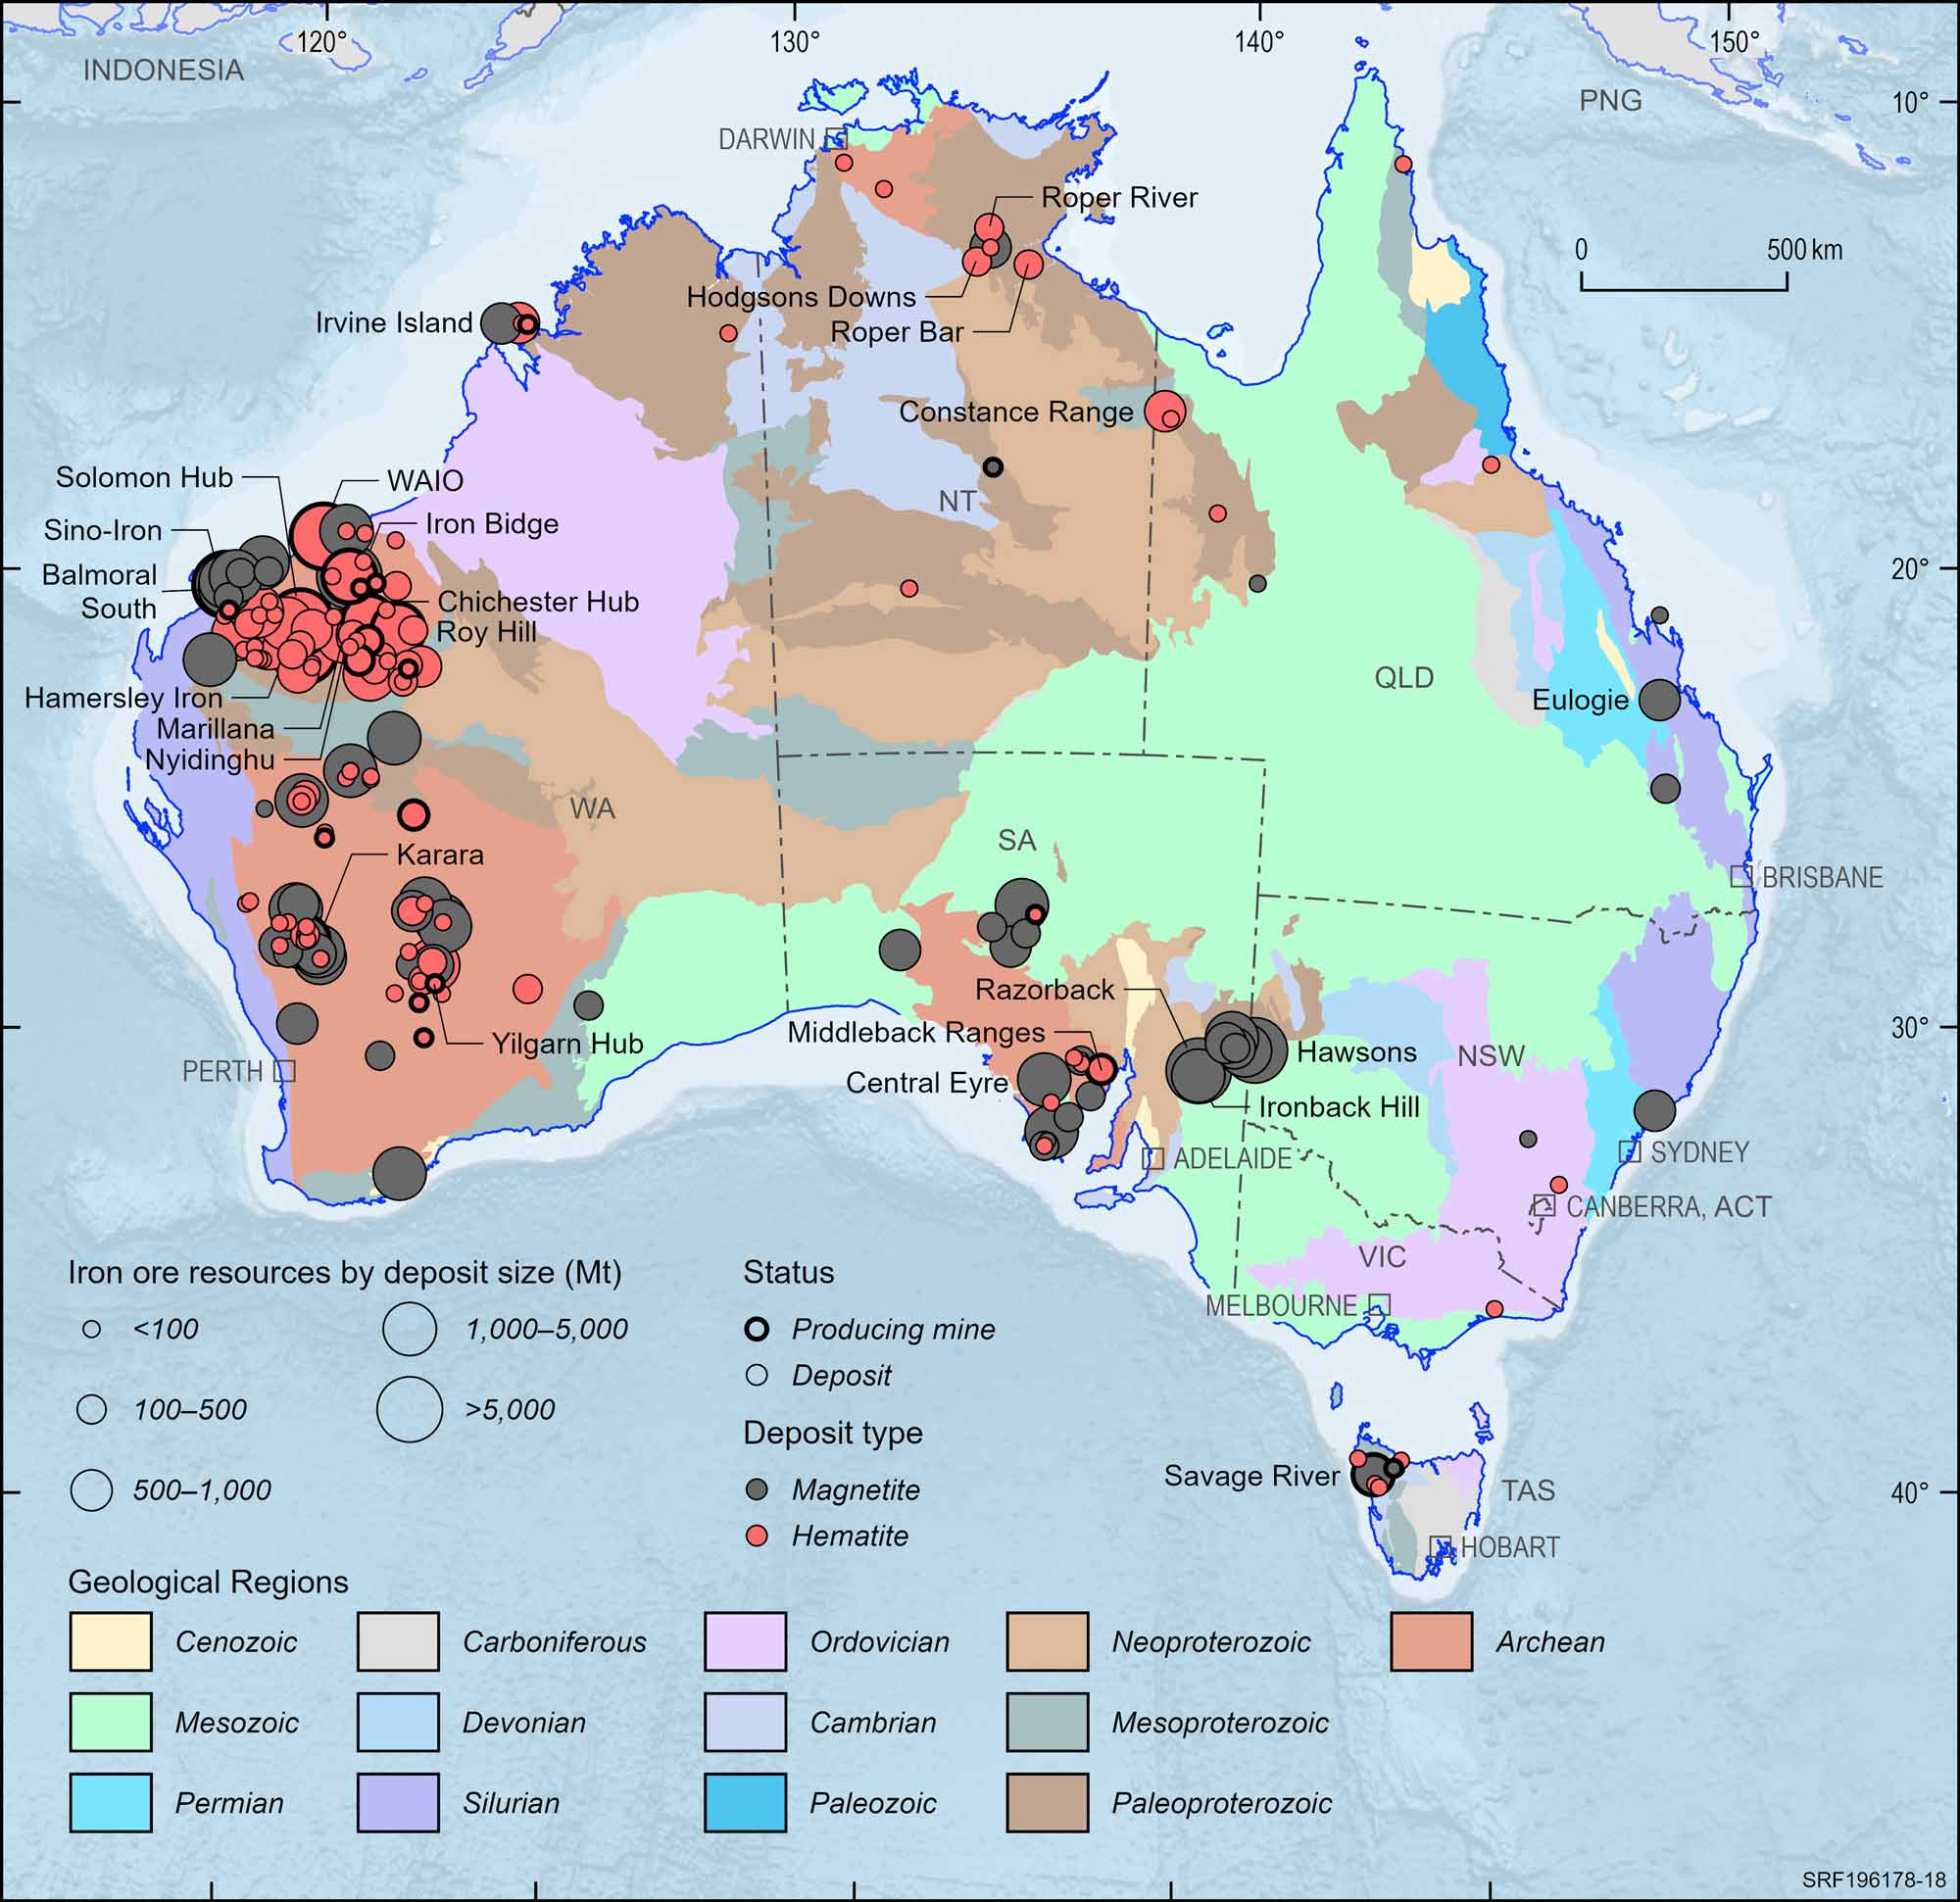
Figure 18. Australian iron ore deposits and operating mines, 2023.
Deposit size is based on total resources (EDR + Subeconomic Demonstrated Resources + Inferred).
For clarity, only major or significant deposits are labelled.
Lead and Zinc
Lead
Operating Mines
14
1
EDR
34.28 Mt Pb
2%
Ore Reserves
10.14 Mt Pb
1%
Production
0.47 Mt Pb
7%
Export Income
$1,769 m
0.3%
World Ranking
Resources
1 (37%)
Production
2 (10%)
Major Uses:
Batteries, underwater cable sheathing, solder, casting alloys, chemical compounds, weighting and radiation protection.
Abbreviations
Mt Pb – million tonnes of lead content; $m – million dollars (Australian).
Notes
Resource figures are as at 31 December 2023. Operating mines and production are for calendar year 2023. Percentage increases and decreases and changes in the number of mines are in relation to 2022. World rankings are followed by percentage share in brackets. Export income is the sum of bullion, refined and concentrate categories, sourced from Office of the Chief Economist, Resources and Energy Quarterly, September 2024.
Zinc
STRATEGIC MATERIAL
Operating Mines
14
1
EDR
63.66 Mt Zn
1%
Ore Reserves
18.79 Mt Zn
11%
Production
1.10 Mt Zn
11%
Export Income
$4,039 m
16%
World Ranking
Resources
1 (28%)
Production
3 (9%)
Major Uses:
Galvanised steel for construction and transport industries, die-casts, brass, chemicals, cosmetics, pharmaceuticals and electrical equipment.
Abbreviations
Mt Zn – million tonnes of zinc content; $m – million dollars (Australian).
Notes
Resource figures are as at 31 December 2023. Operating mines and production are for calendar year 2023. Percentage increases and decreases and changes in the number of mines are in relation to 2022. World rankings are followed by percentage share in brackets. Export income is the sum of refined and ore/concentrate categories, sourced from Office of the Chief Economist, Resources and Energy Quarterly, September 2024.
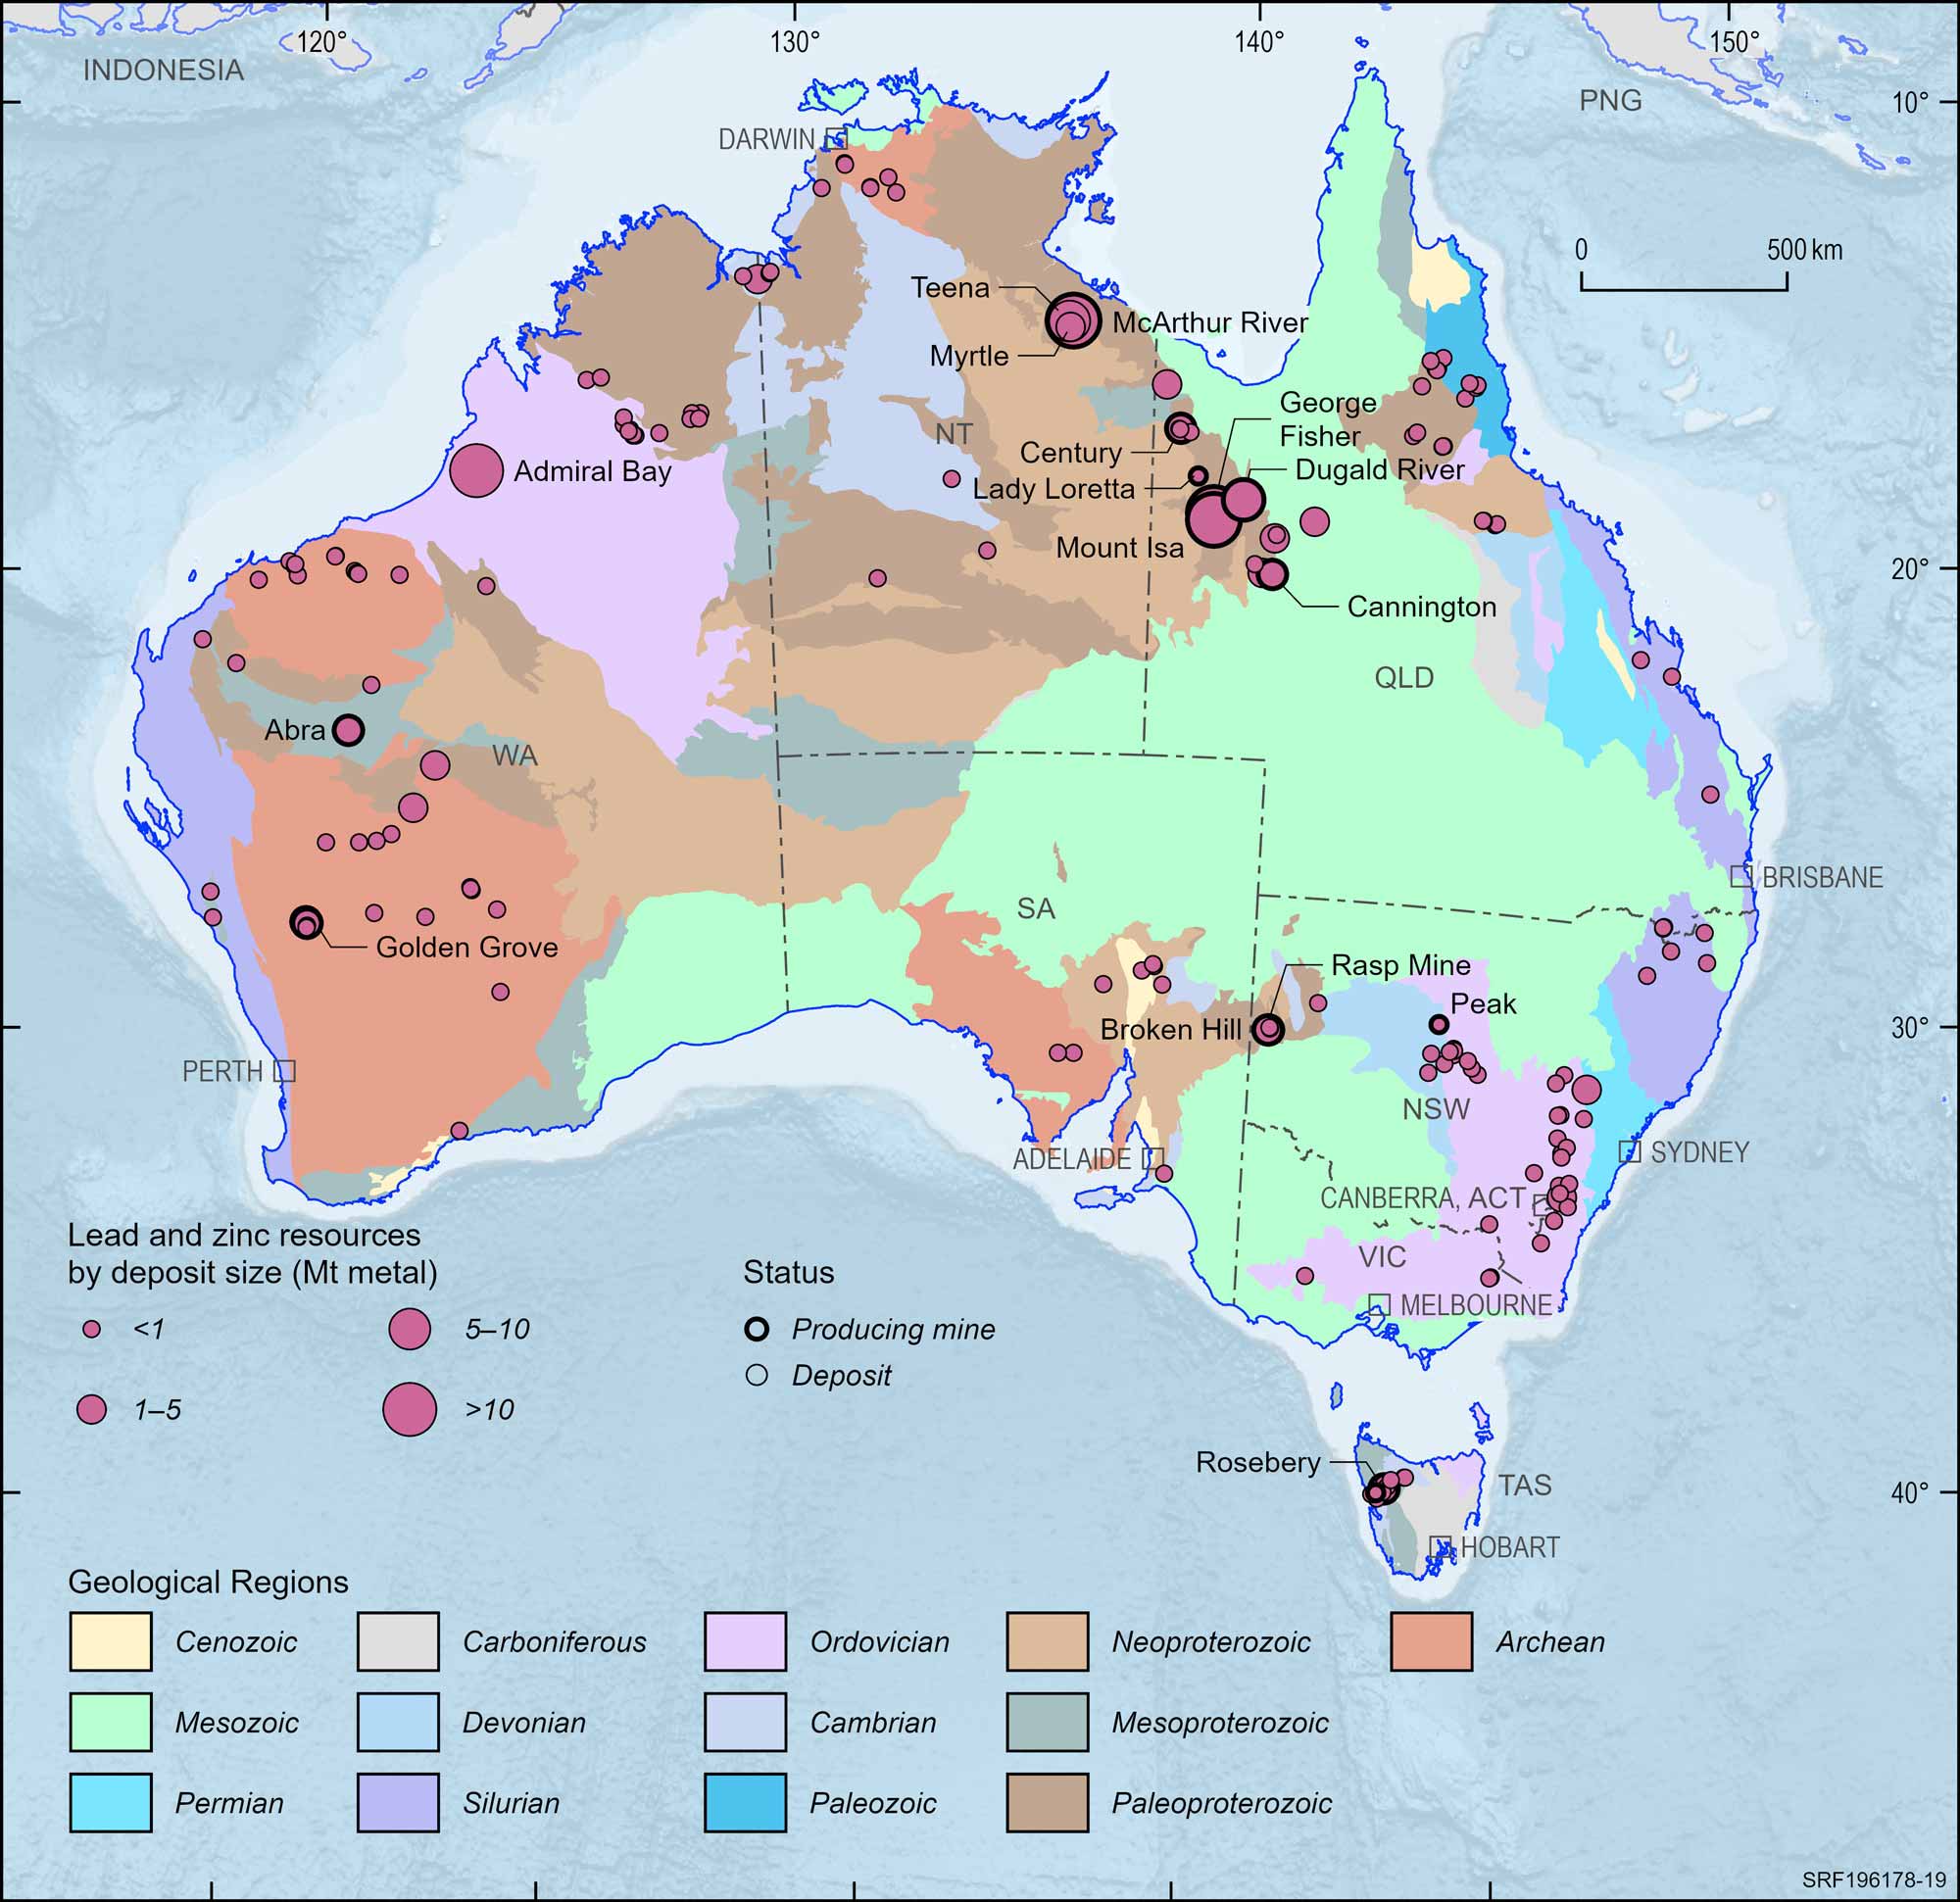
Figure 19. Australian lead and zinc deposits and operating mines, 2023.
Deposit size is based on total resources (EDR + Subeconomic Demonstrated Resources + Inferred).
For clarity, only major or significant deposits are labelled.
Lithium, Tantalum and Niobium
Lithium
Critical Mineral
Operating Mines
7
n.c.
EDR
8,440 kt Li
20%
Ore Reserves
5,051 kt Li
5%
Production
95 kt Li
27%
Export Income
$18,820 m
55%
World Ranking
Resources
2 (28%)
Production
1 (49%)
Major Uses:
Lithium-ion batteries in electric vehicles and mobile devices, ceramics and glass.
Abbreviations
kt Li – kilotonnes of lithium content; $m – million dollars (Australian); n.c. – no change.
Notes
Resource figures are as at 31 December 2023. Operating mines and production are for calendar year 2023. Percentage increases and decreases and changes in the number of mines are in relation to 2022. World rankings are followed by percentage share in brackets. Export income is the sum of spodumene ore and concentrate sourced from Office of the Chief Economist, Resources and Energy Quarterly, September 2024.
Tantalum
Critical Mineral
Operating Mines
0
2
EDR
120.8 kt Ta
10%
Ore Reserves
32.9 kt Ta
18%
Production
0.2 kt Ta
14%
Export Income
n.a.
0%
World Ranking
Resources
unknown
Production
4 (6%)
Major Uses:
Capacitors for the electronics and telecommunications industry, resistors, semiconductors, alloys and superalloys, medical and dental applications and chemical process industries.
Abbreviations
kt Ta – kilotonnes of tantalum content; $m – million dollars (Australian). n.a. – not available.
Notes
Resource figures are as at 31 December 2022. Operating mines and production are for calendar year 2022. Percentage increases or decreases are in relation to 2021. World rankings are followed by percentage share in brackets. Export income sourced from Department of Mines, Industry Regulation and Safety, Western Australian Government 2022 Major Commodities Resource Data File.
Niobium
Critical Mineral
Operating Mines
0
n.c.
EDR
255 kt Nb
18%
Ore Reserves
58 kt Nb
0%
Production
n.a.
0%
Export Income
n.a.
0%
World Ranking
Resources
unknown
Production
unknown
Major Uses:
Micro alloy with iron for use in the construction and automotive industries, superalloys used in aeronautics and energy industries, magnetic resonance imaging (MRI) scanners, nuclear magnetic resonance (NMR) equipment, glass, jewellery, prosthetics and medical implants.
Abbreviations
kt Nb – kilotonnes of niobium content; n.a. – not available; n.c. – no change.
Notes
Resource figures are as at 31 December 2023. Operating mines and production are for calendar year 2023. Percentage increases and decreases and changes in the number of mines are in relation to 2022. World rankings are followed by percentage share in brackets. Export income sourced from Department of Mines, Industry Regulation and Safety, Western Australian Government 2023 Major Commodities Resource Data File.
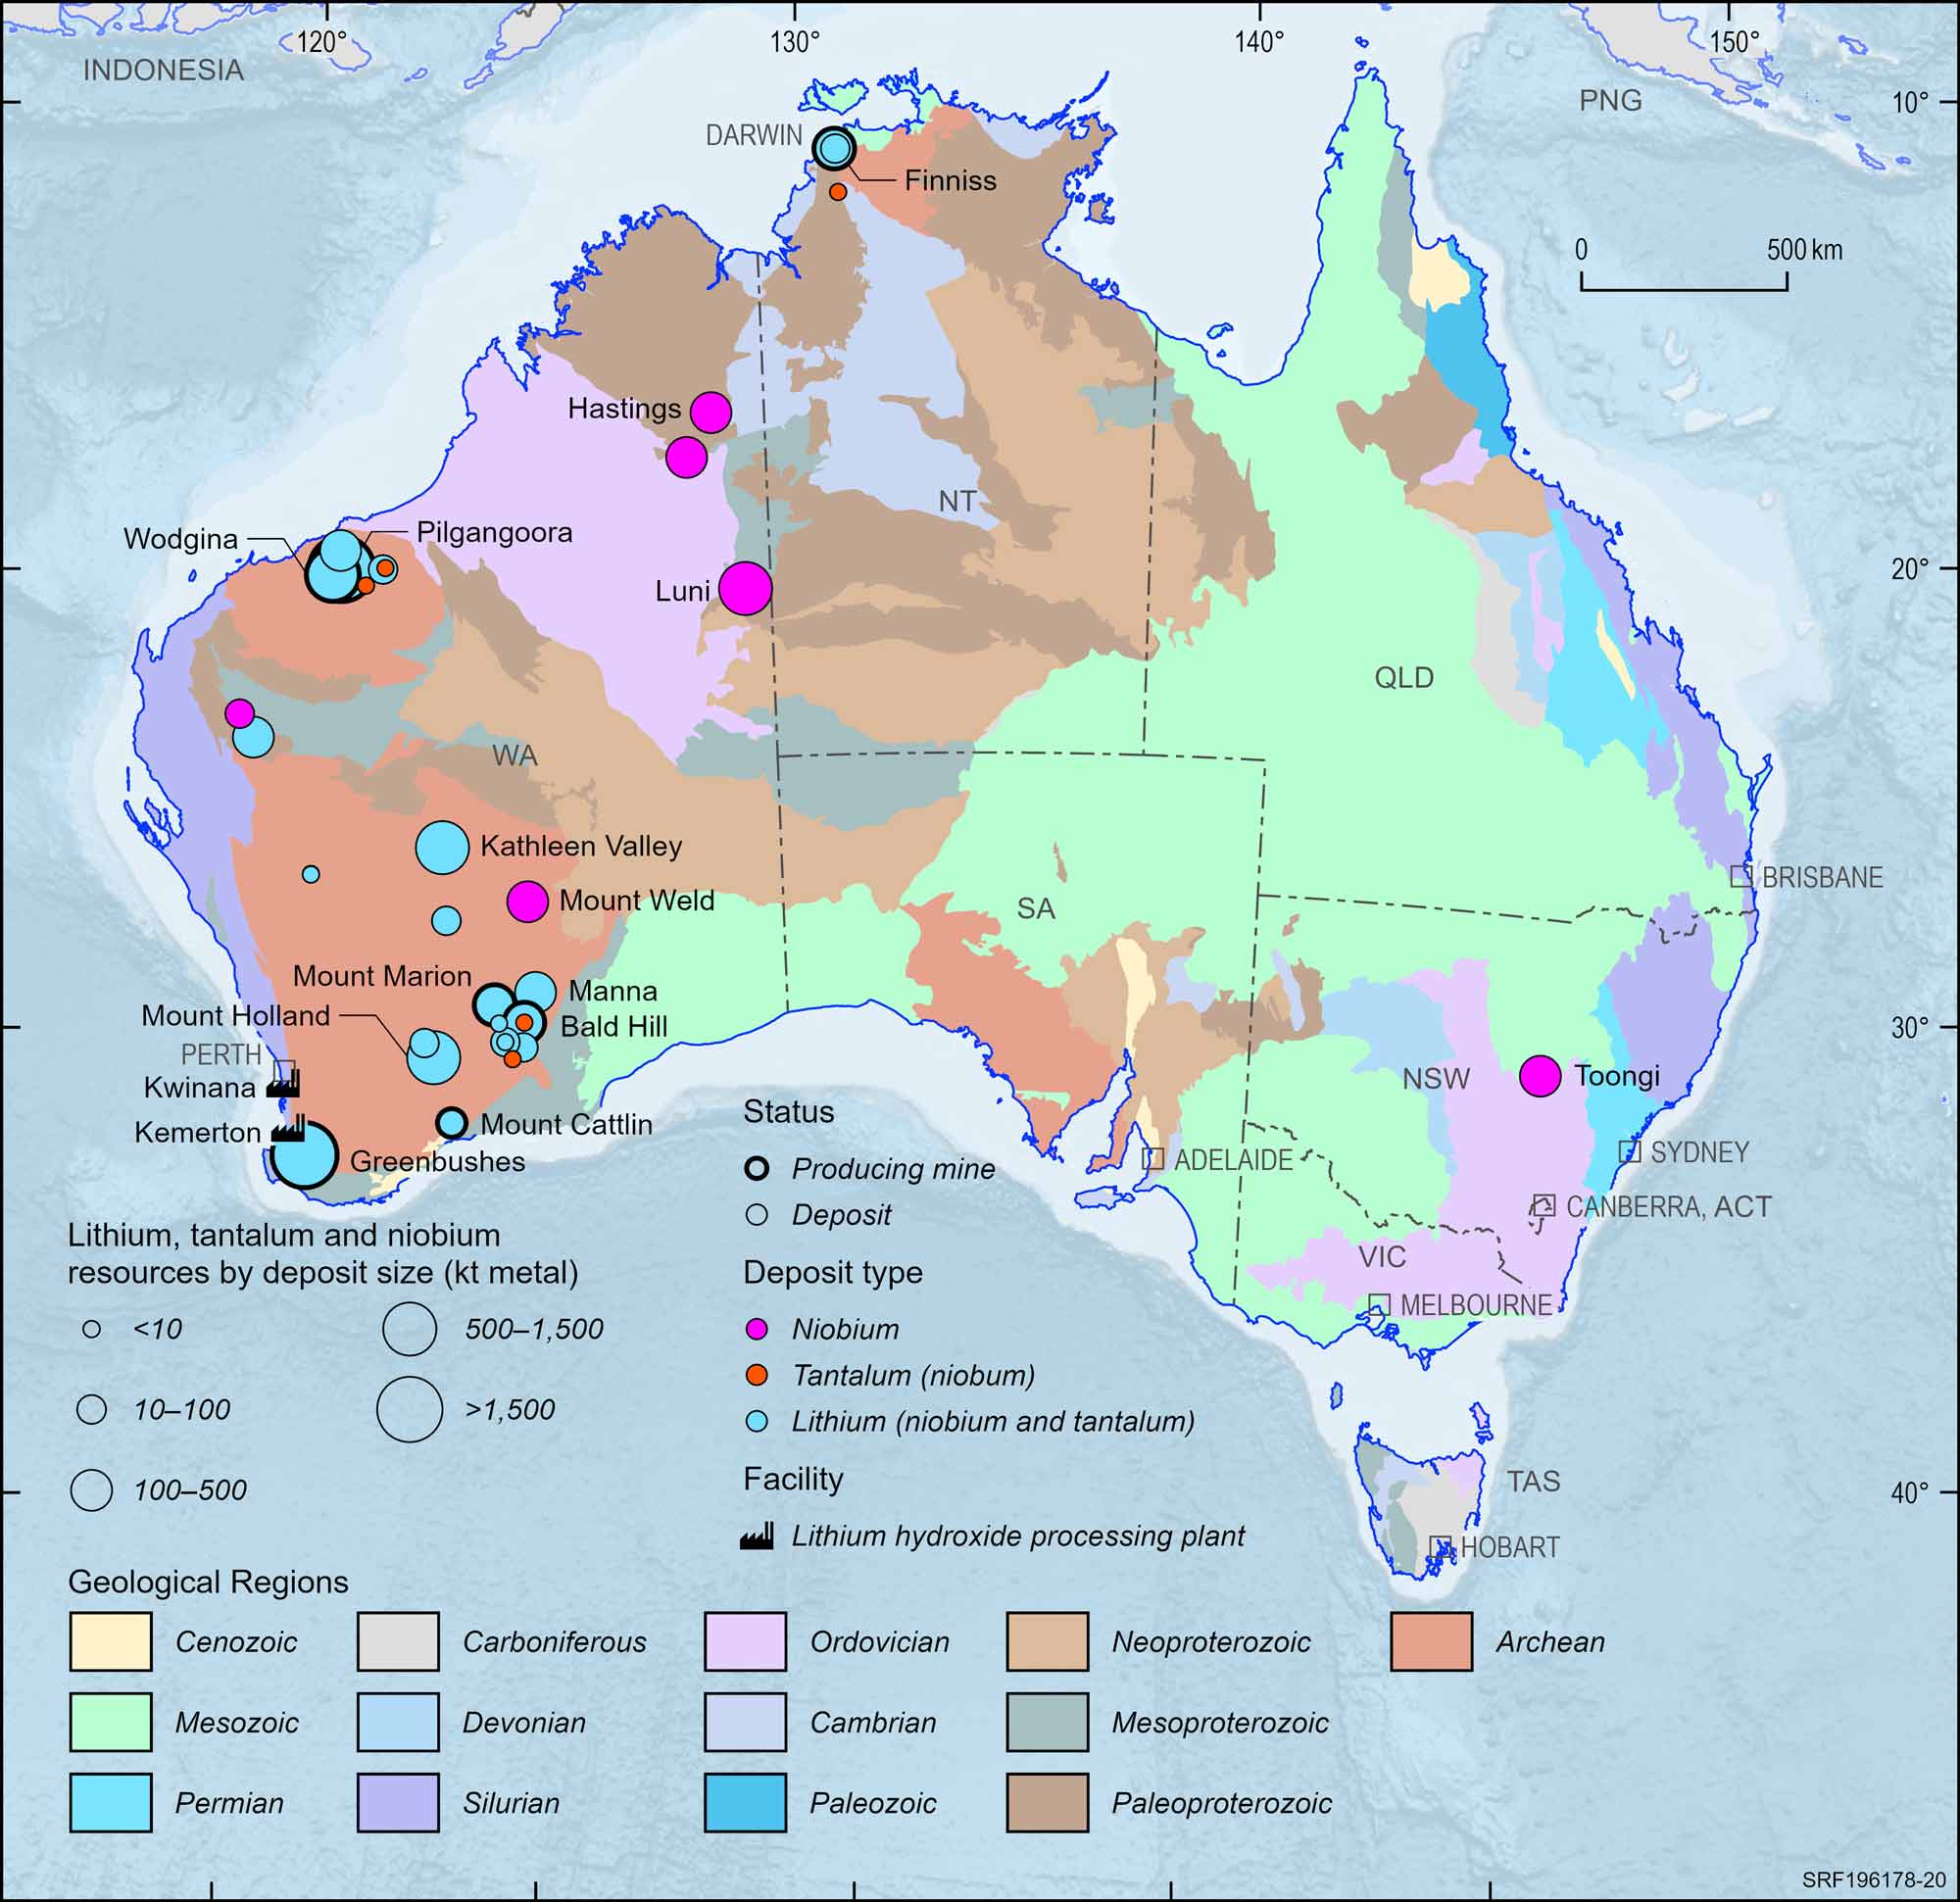
Figure 20. Australian lithium, tantalum and niobium deposits and operating mines, 2023.
Deposit size is based on total resources (EDR + Subeconomic Demonstrated Resources + Inferred).
For clarity, only major or significant deposits are labelled.
Magnesite
Critical Mineral
Operating Mines
4
n.c.
EDR
284 Mt MgCO3
0%
Ore Reserves
37 Mt MgCO3
0%
Production
0.4 Mt MgCO3
6%
Export Income
>$0.323 m
n.a.
World Ranking
Resources
4 (4%)
Production
9 (2%)
Major Uses:
Used to produce magnesium oxide (MgO) for use as a refractory material in the steel industry, animal feeds and fertilisers, flooring compounds, flame retardants and the pharmaceutical industry.
Abbreviations
Mt MgCO3 – million tonnes of magnesium carbonate (magnesite) content; $m – million dollars (Australian); n.a.– not available; n.c. – no change.
Notes
Resource figures are as at 31 December 2023. Operating mines and production are for calendar year 2023. Percentage increases and decreases and changes in the number of mines are in relation to 2022. World rankings are followed by percentage share in brackets. Export income from the South Australia Department for Energy and Mining (Report Book 2024/00024) and confidential data from the Queensland Department of Natural Resources and Mines.
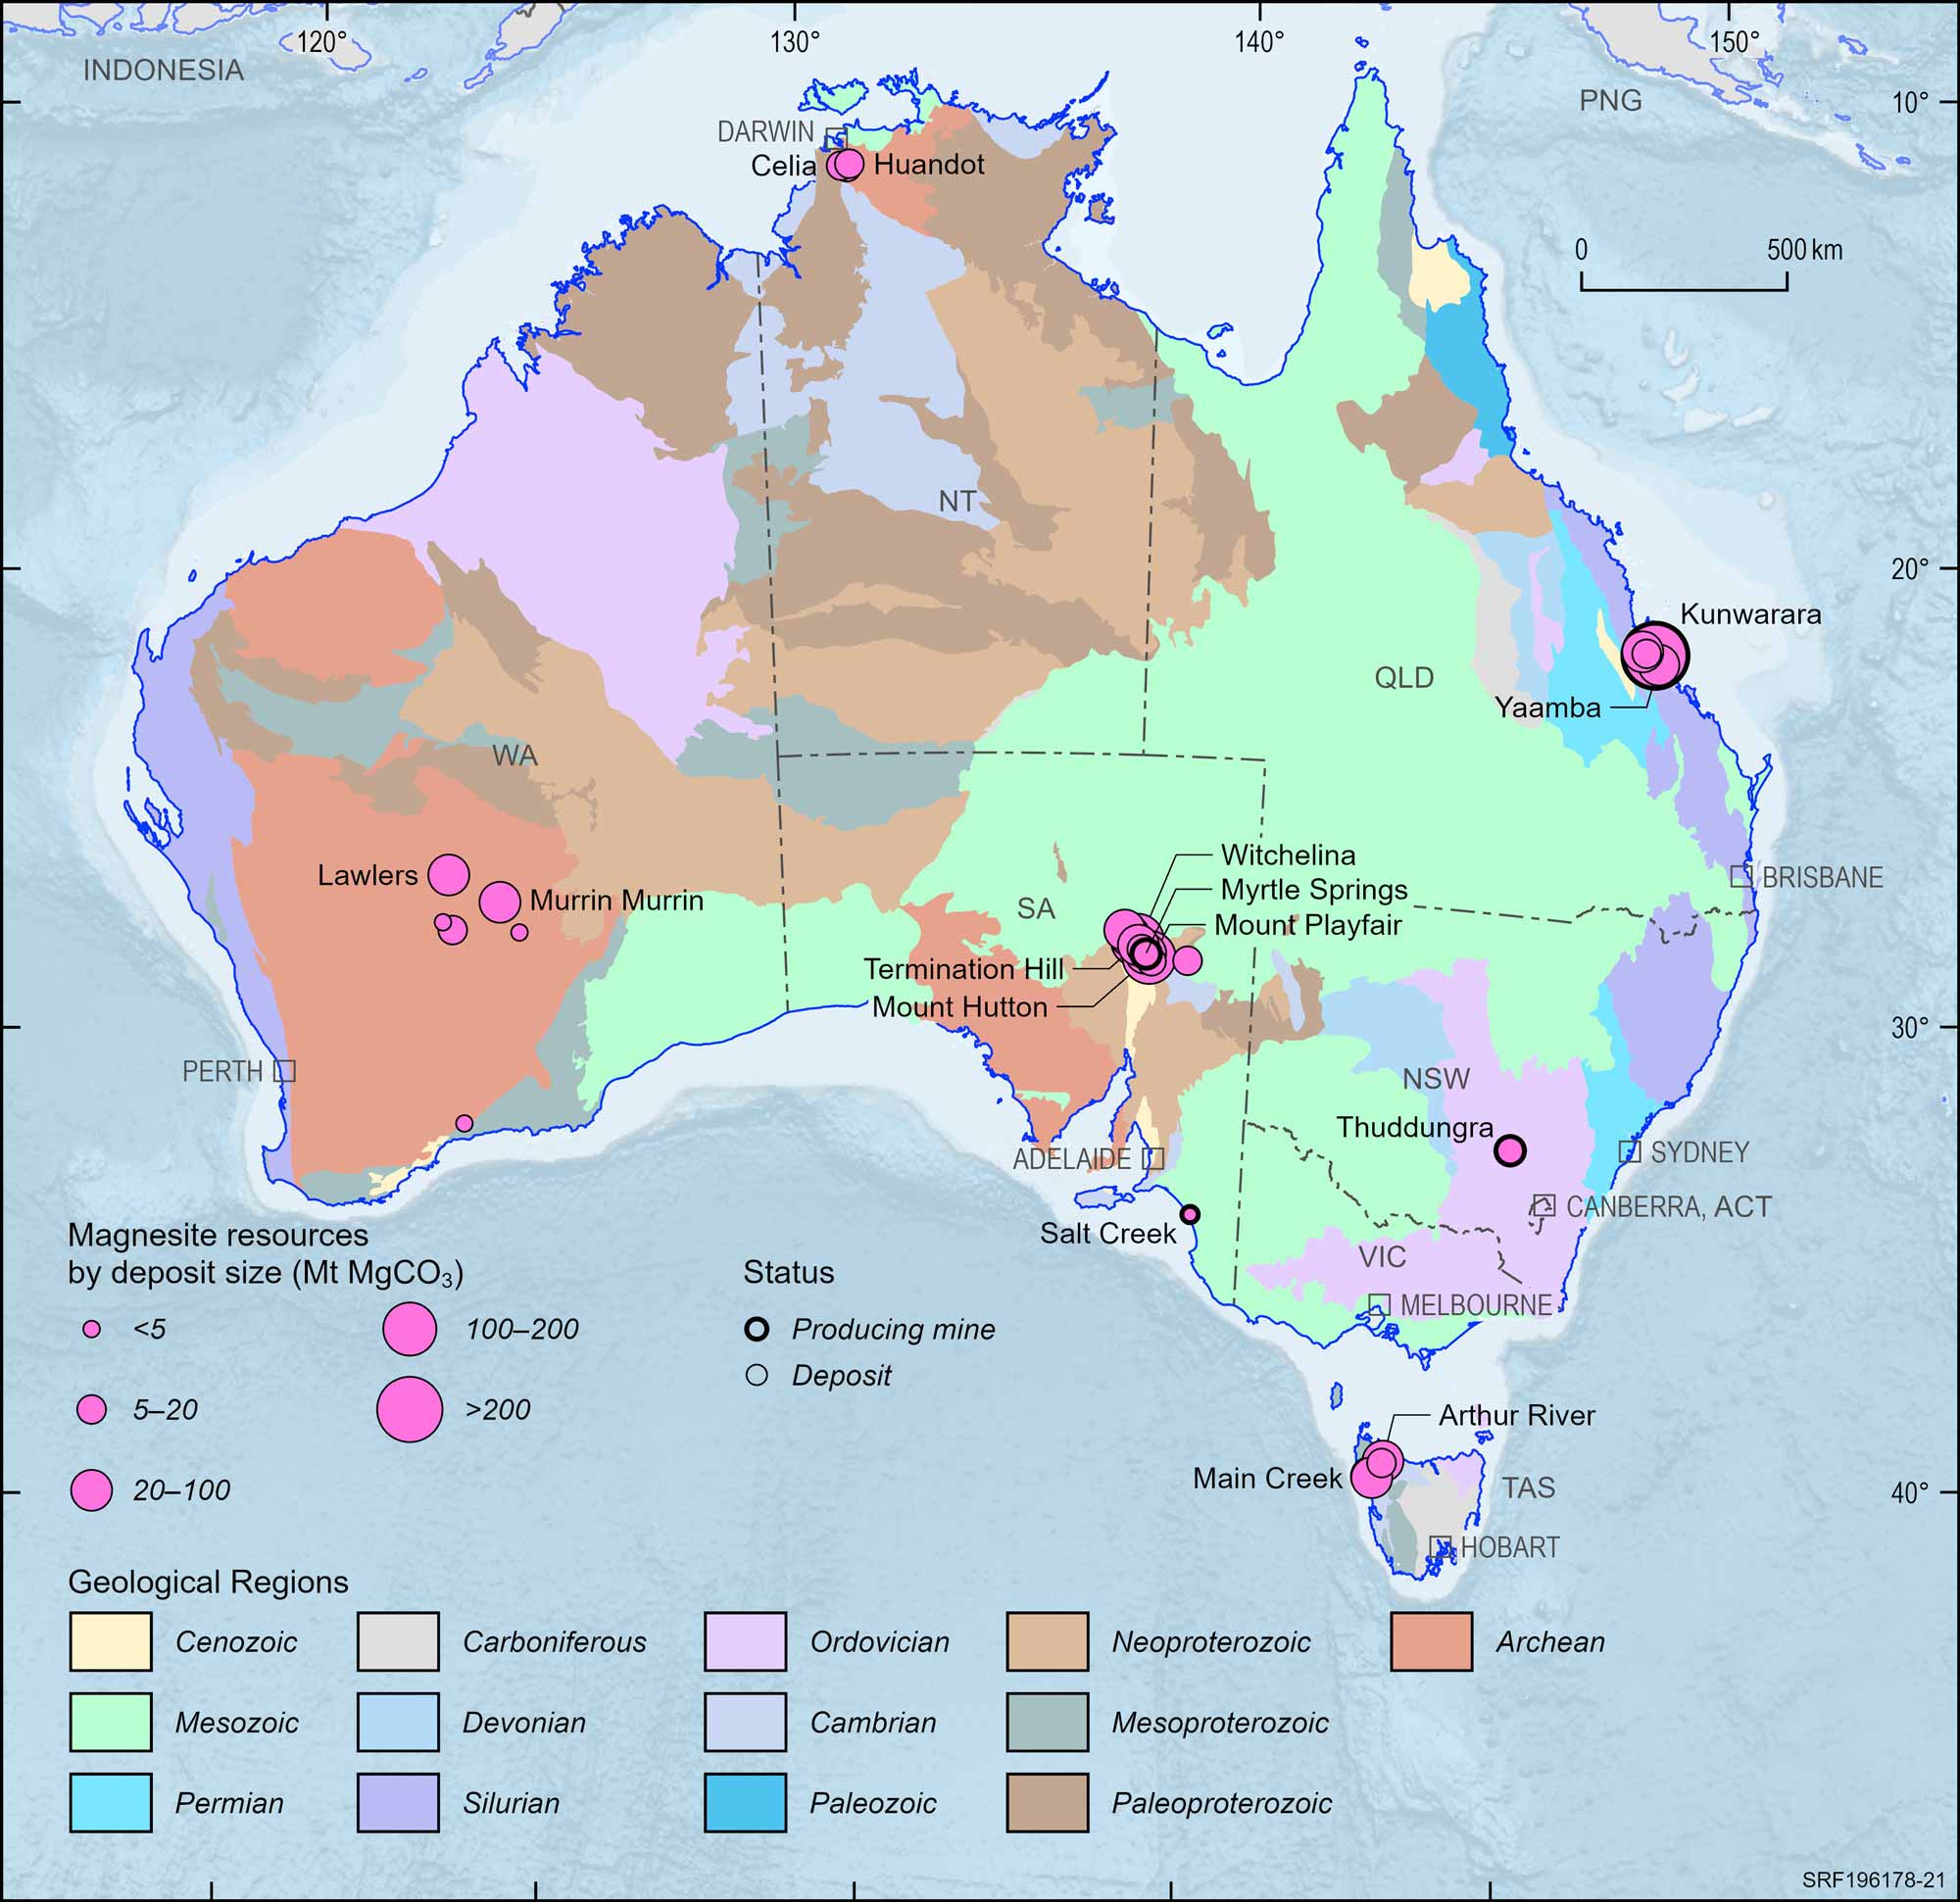
Figure 21. Australian magnesite deposits and operating mines, 2023.
Deposit size is based on total resources (EDR + Subeconomic Demonstrated Resources + Inferred).
For clarity, only major or significant deposits are labelled.
Manganese Ore
Critical Mineral
Operating Mines
3
1
EDR
576 Mt
16%
Ore Reserves
116 Mt
6%
Production
4.1 Mt
9%
Export Income
$1,825 m
11%
World Ranking
Resources
4 (15%)
Production
3 (9%)
Major Uses:
Alloying agent for steel manufacture, rechargeable electric vehicle batteries, plant fertilisers, animal feeds, glass and ceramics.
Abbreviations
Mt – million tonnes; $m – million dollars (Australian).
Notes
Resource figures are as at 31 December 2023. Operating mines and production are for calendar year 2023. Percentage increases and decreases and changes in the number of mines are in relation to 2022. World rankings are followed by percentage share in brackets. Available export income sourced from the Department of Mines, Industry Regulation and Safety, Western Australian Government 2023 Major Commodities Resource Data File and the Northern Territory Department of Industry Tourism and Trade, 2023 Northern Territory Mining Production.
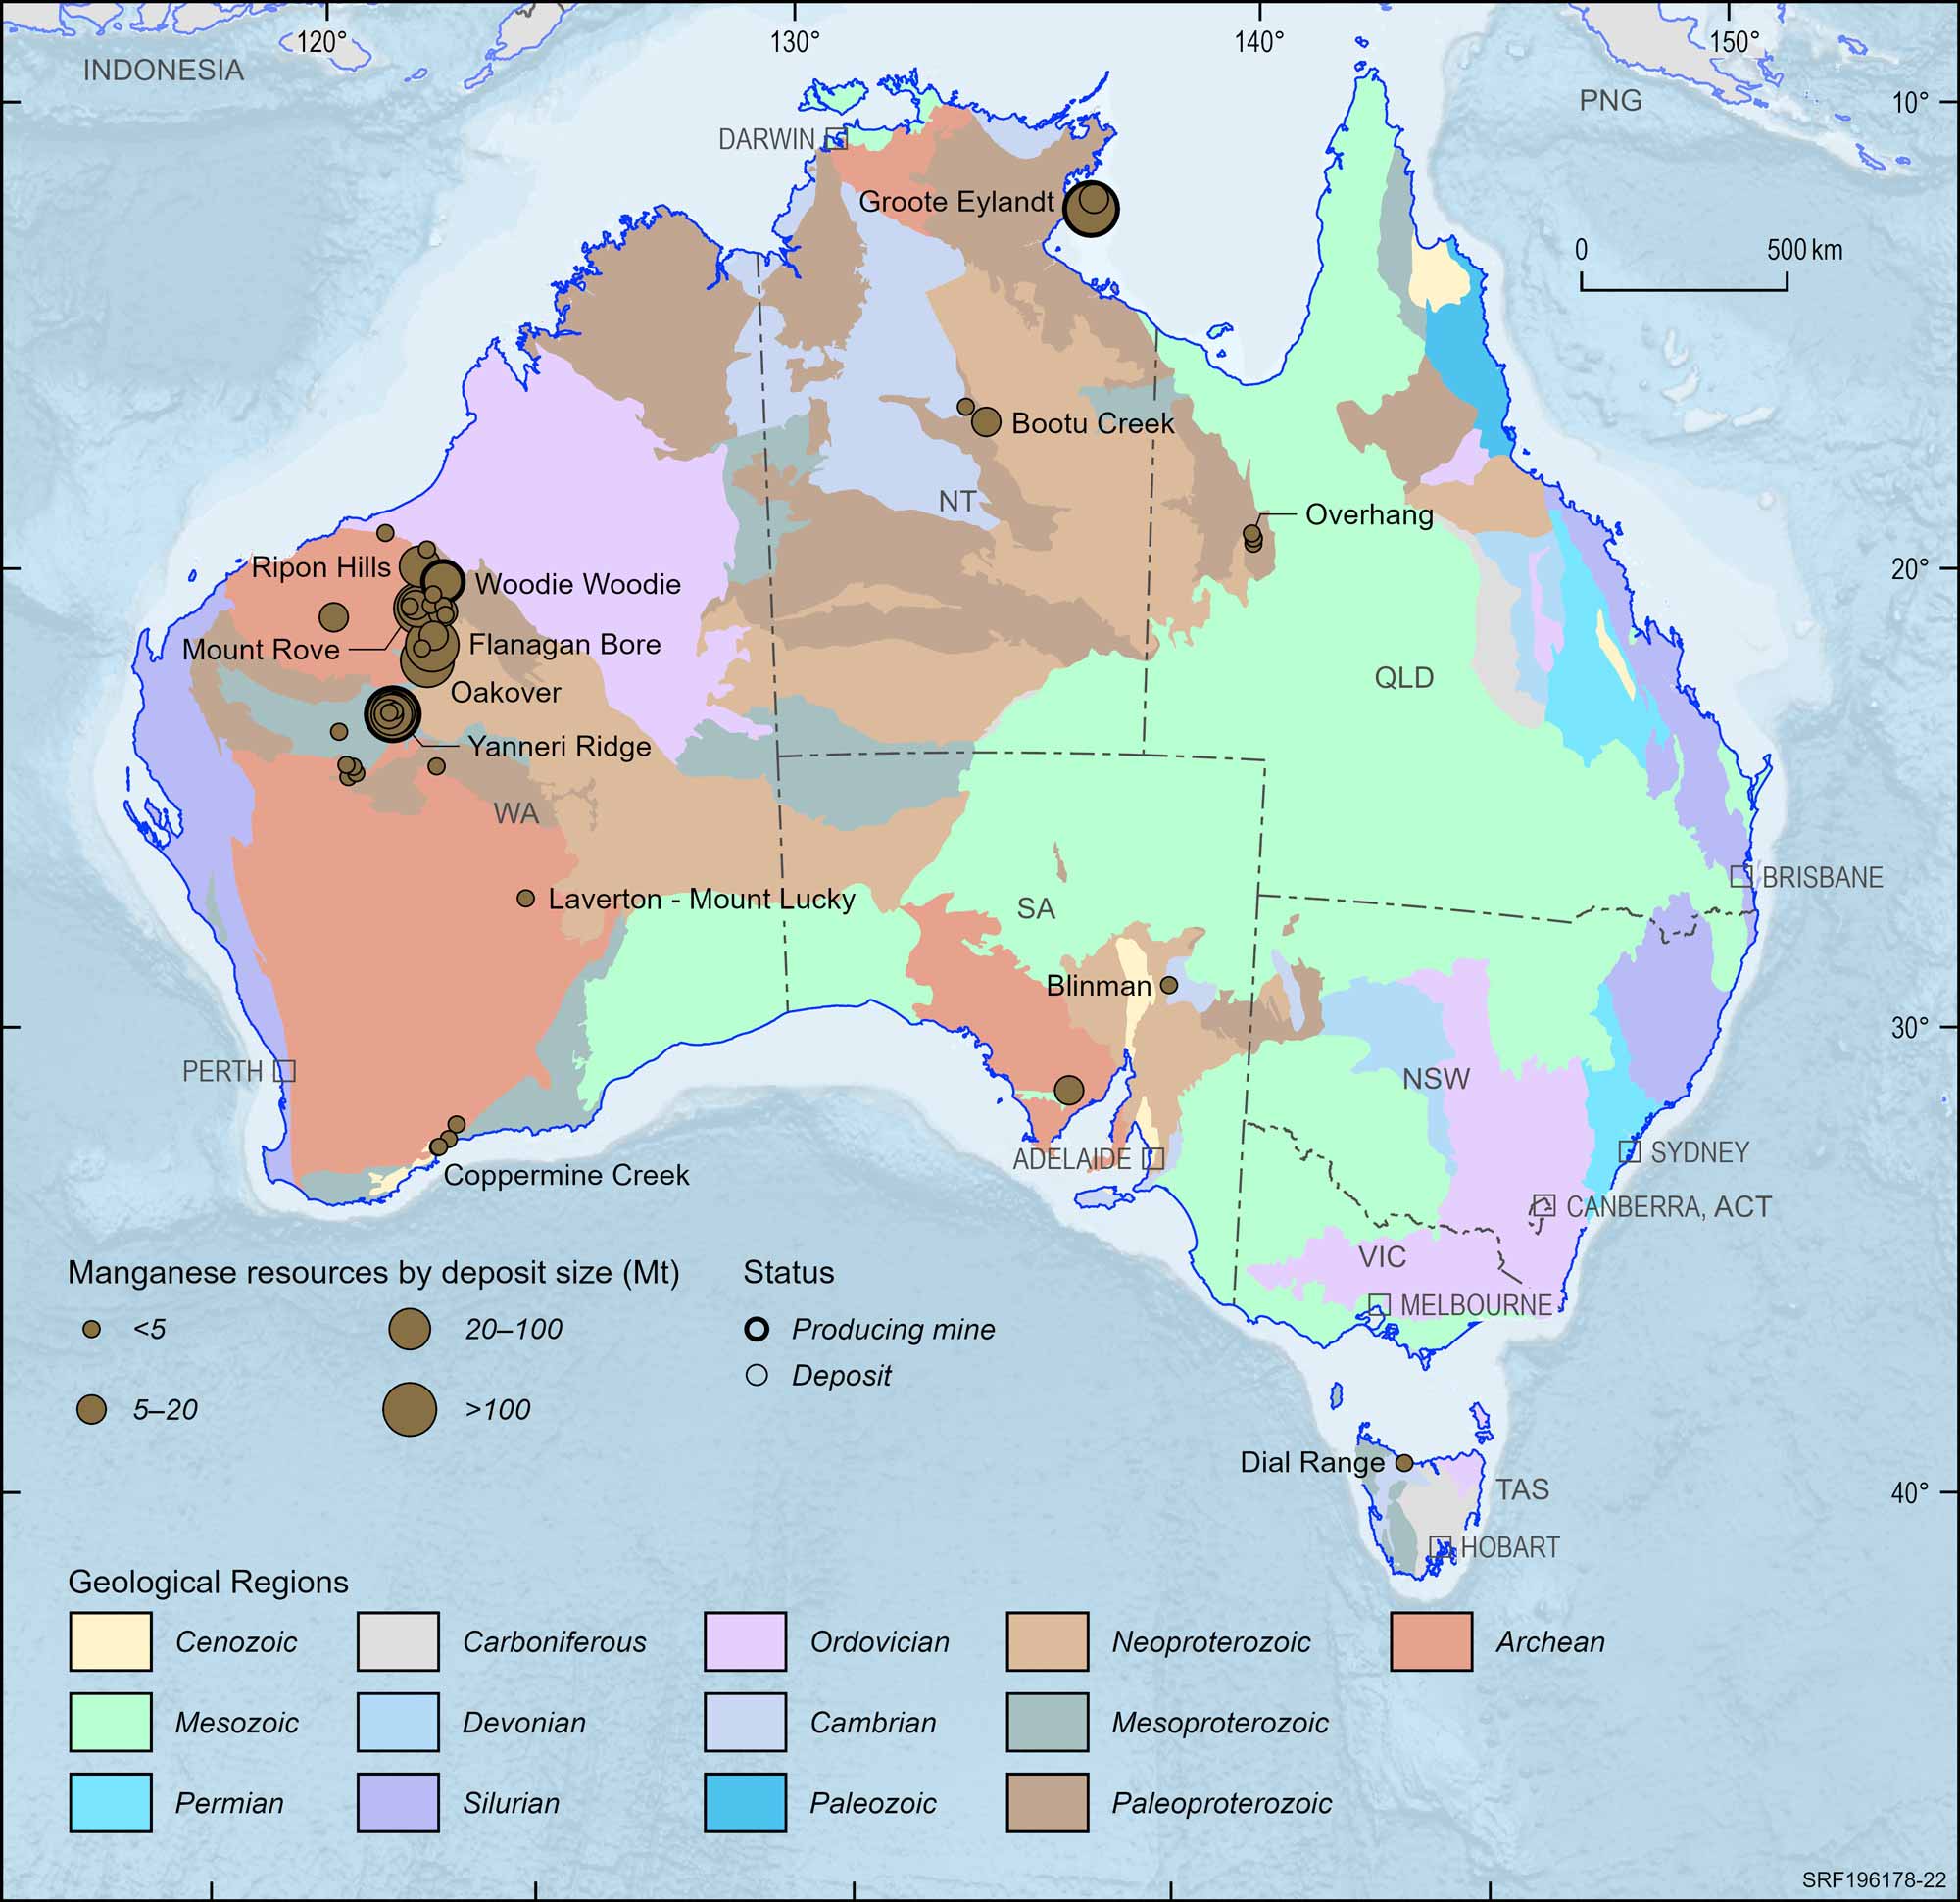
Figure 22. Australian manganese deposits and operating mines, 2023.
Deposit size is based on total resources (EDR + Subeconomic Demonstrated Resources + Inferred).
For clarity, only major or significant deposits are labelled.
Mineral Sands
Ilmenite
Critical Mineral
Operating Mines
17
6
EDR
305.8 Mt
1%
Ore Reserves
74.6 Mt
3%
Production
0.63 Mt
15%
Export Income
n.a.
0%
World Ranking
Resources
2 (26%)
Production
6 (4%)
Major Uses:
Main source of titanium dioxide which is used in paints, plastics, fabrics, rubber, textiles, paper, sunscreen, cosmetics and as fluxing agents.
Abbreviations
Mt – million tonnes; n.a. – not available.
Notes
Resource figures are as at 31 December 2023. Operating mines and production are for calendar year 2023. Percentage increases and decreases and changes in the number of mines are in relation to 2022. World rankings are followed by percentage share in brackets.
Rutile
Critical Mineral
Operating Mines
14
6
EDR
41.2 Mt
6%
Ore Reserves
12.7 Mt
5%
Production
0.20 Mt
26%
Export Income
n.a.
0%
World Ranking
Resources
1 (66%)
Production
1 (35%)
Major Uses:
Production of titanium metals for aircraft, spacecraft, vehicles, surgical implants, sports equipment, desalination plants, and general industrial equipment.
Abbreviations
Mt – million tonnes; n.a. – not available.
Notes
Resource figures are as at 31 December 2023. Operating mines and production are for calendar year 2023. Percentage increases and decreases and changes in the number of mines are in relation to 2022. World rankings are followed by percentage share in brackets.
Zircon
Critical Mineral
Operating Mines
15
5
EDR
87.7 Mt
1%
Ore Reserves
32.8 Mt
7%
Production
0.41 Mt
13%
Export Income
n.a.
0%
World Ranking
Resources
1 (77%)
Production
2 (24%)
Major Uses:
Used as an opacifier for glazes on ceramic tiles, in refractories and for the foundry industry, nuclear reactors, superconducting magnets, chemical industries and cosmetics.
Abbreviations
Mt – million tonnes; n.a. – not available.
Notes
Resource figures are as at 31 December 2023. Operating mines and production are for calendar year 2023. Percentage increases and decreases and changes in the number of mines are in relation to 2022. World rankings are followed by percentage share in brackets.
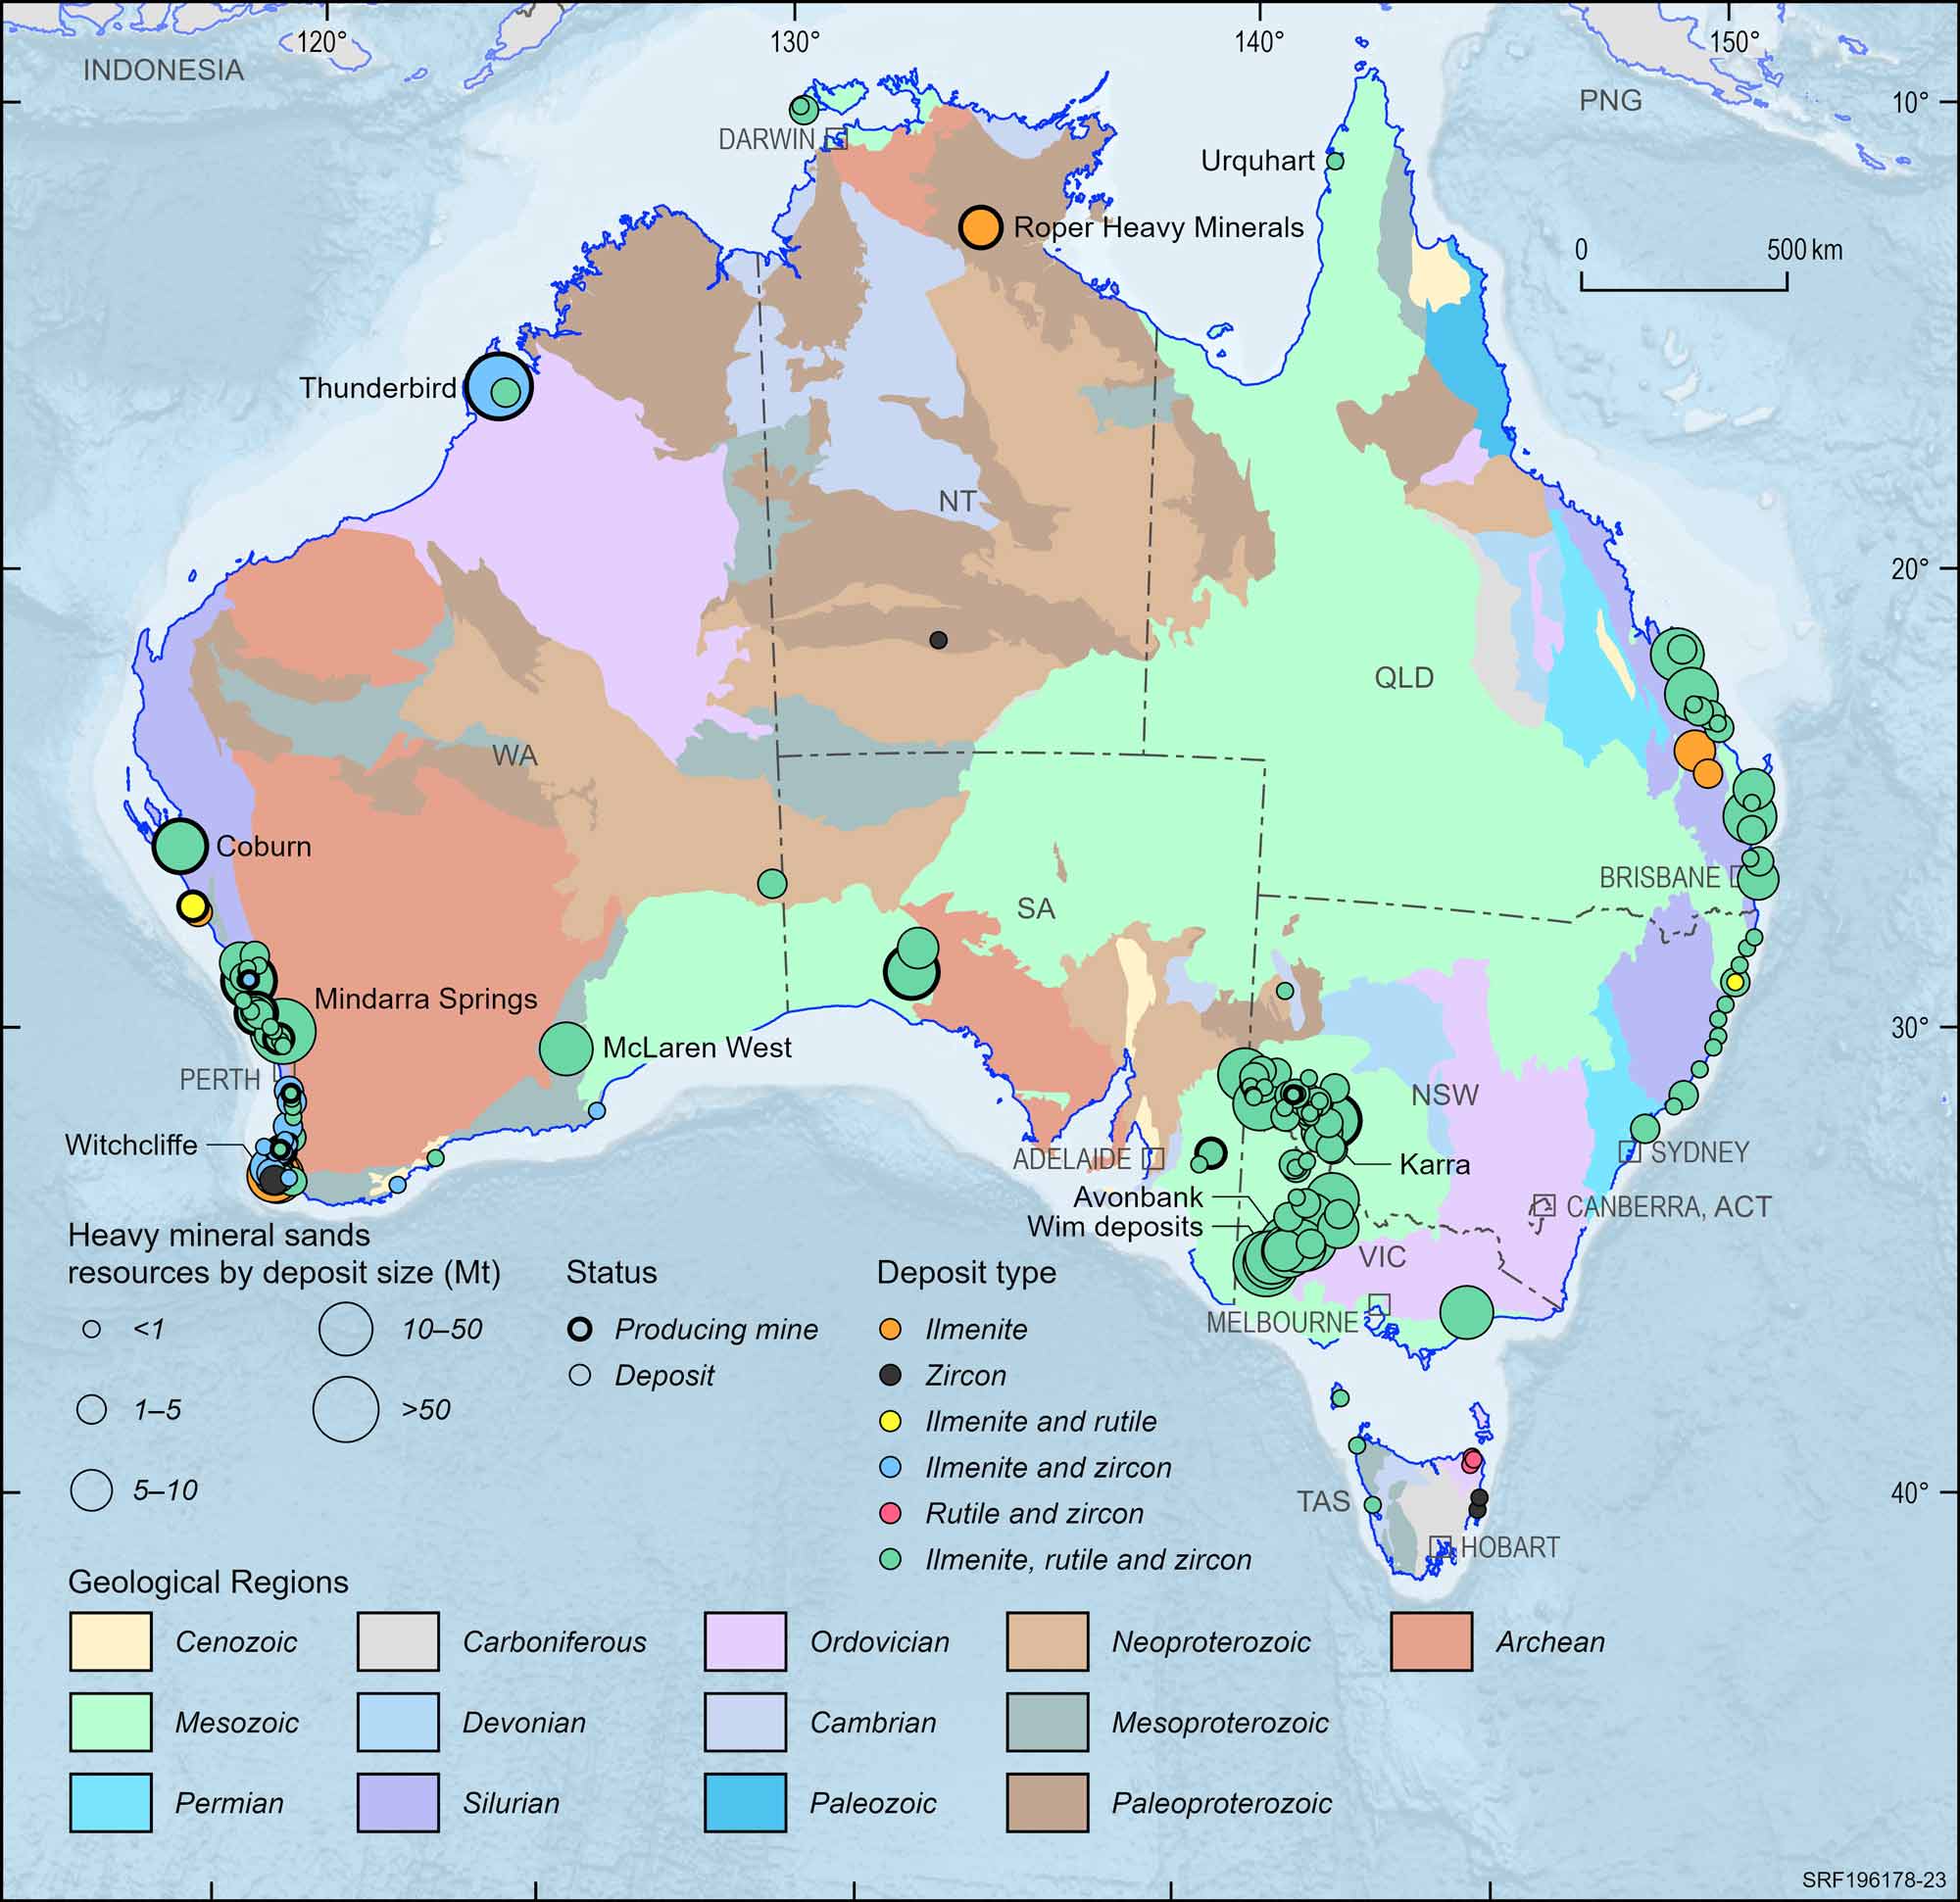
Figure 23. Australian heavy mineral sands deposits and operating mines, 2023.
Deposit size is based on total resources (EDR + Subeconomic Demonstrated Resources + Inferred).
For clarity, only major or significant deposits are labelled.
Molybdenum
Critical Mineral
Operating Mines
1
n.c.
EDR
759 kt Mo
10%
Ore Reserves
263 kt Mo
4%
Production
1.219 kt Mo
340%
Export Income
n.a.
0%
World Ranking
Resources
6 (5%)
Production
minor
Major Uses:
Drills, catalysts, lubricants, fertilisers, structural steel and steel alloys used in engine parts.
Abbreviations
kt Mo – kilotonnes of molybdenum content; n.a. – not available; n.c. – no change.
Notes
Resource figures are as at 31 December 2023. Operating mines and production are for calendar year 2023. Percentage increases and decreases and changes in the number of mines are in relation to 2022. World rankings are followed by percentage share in brackets.
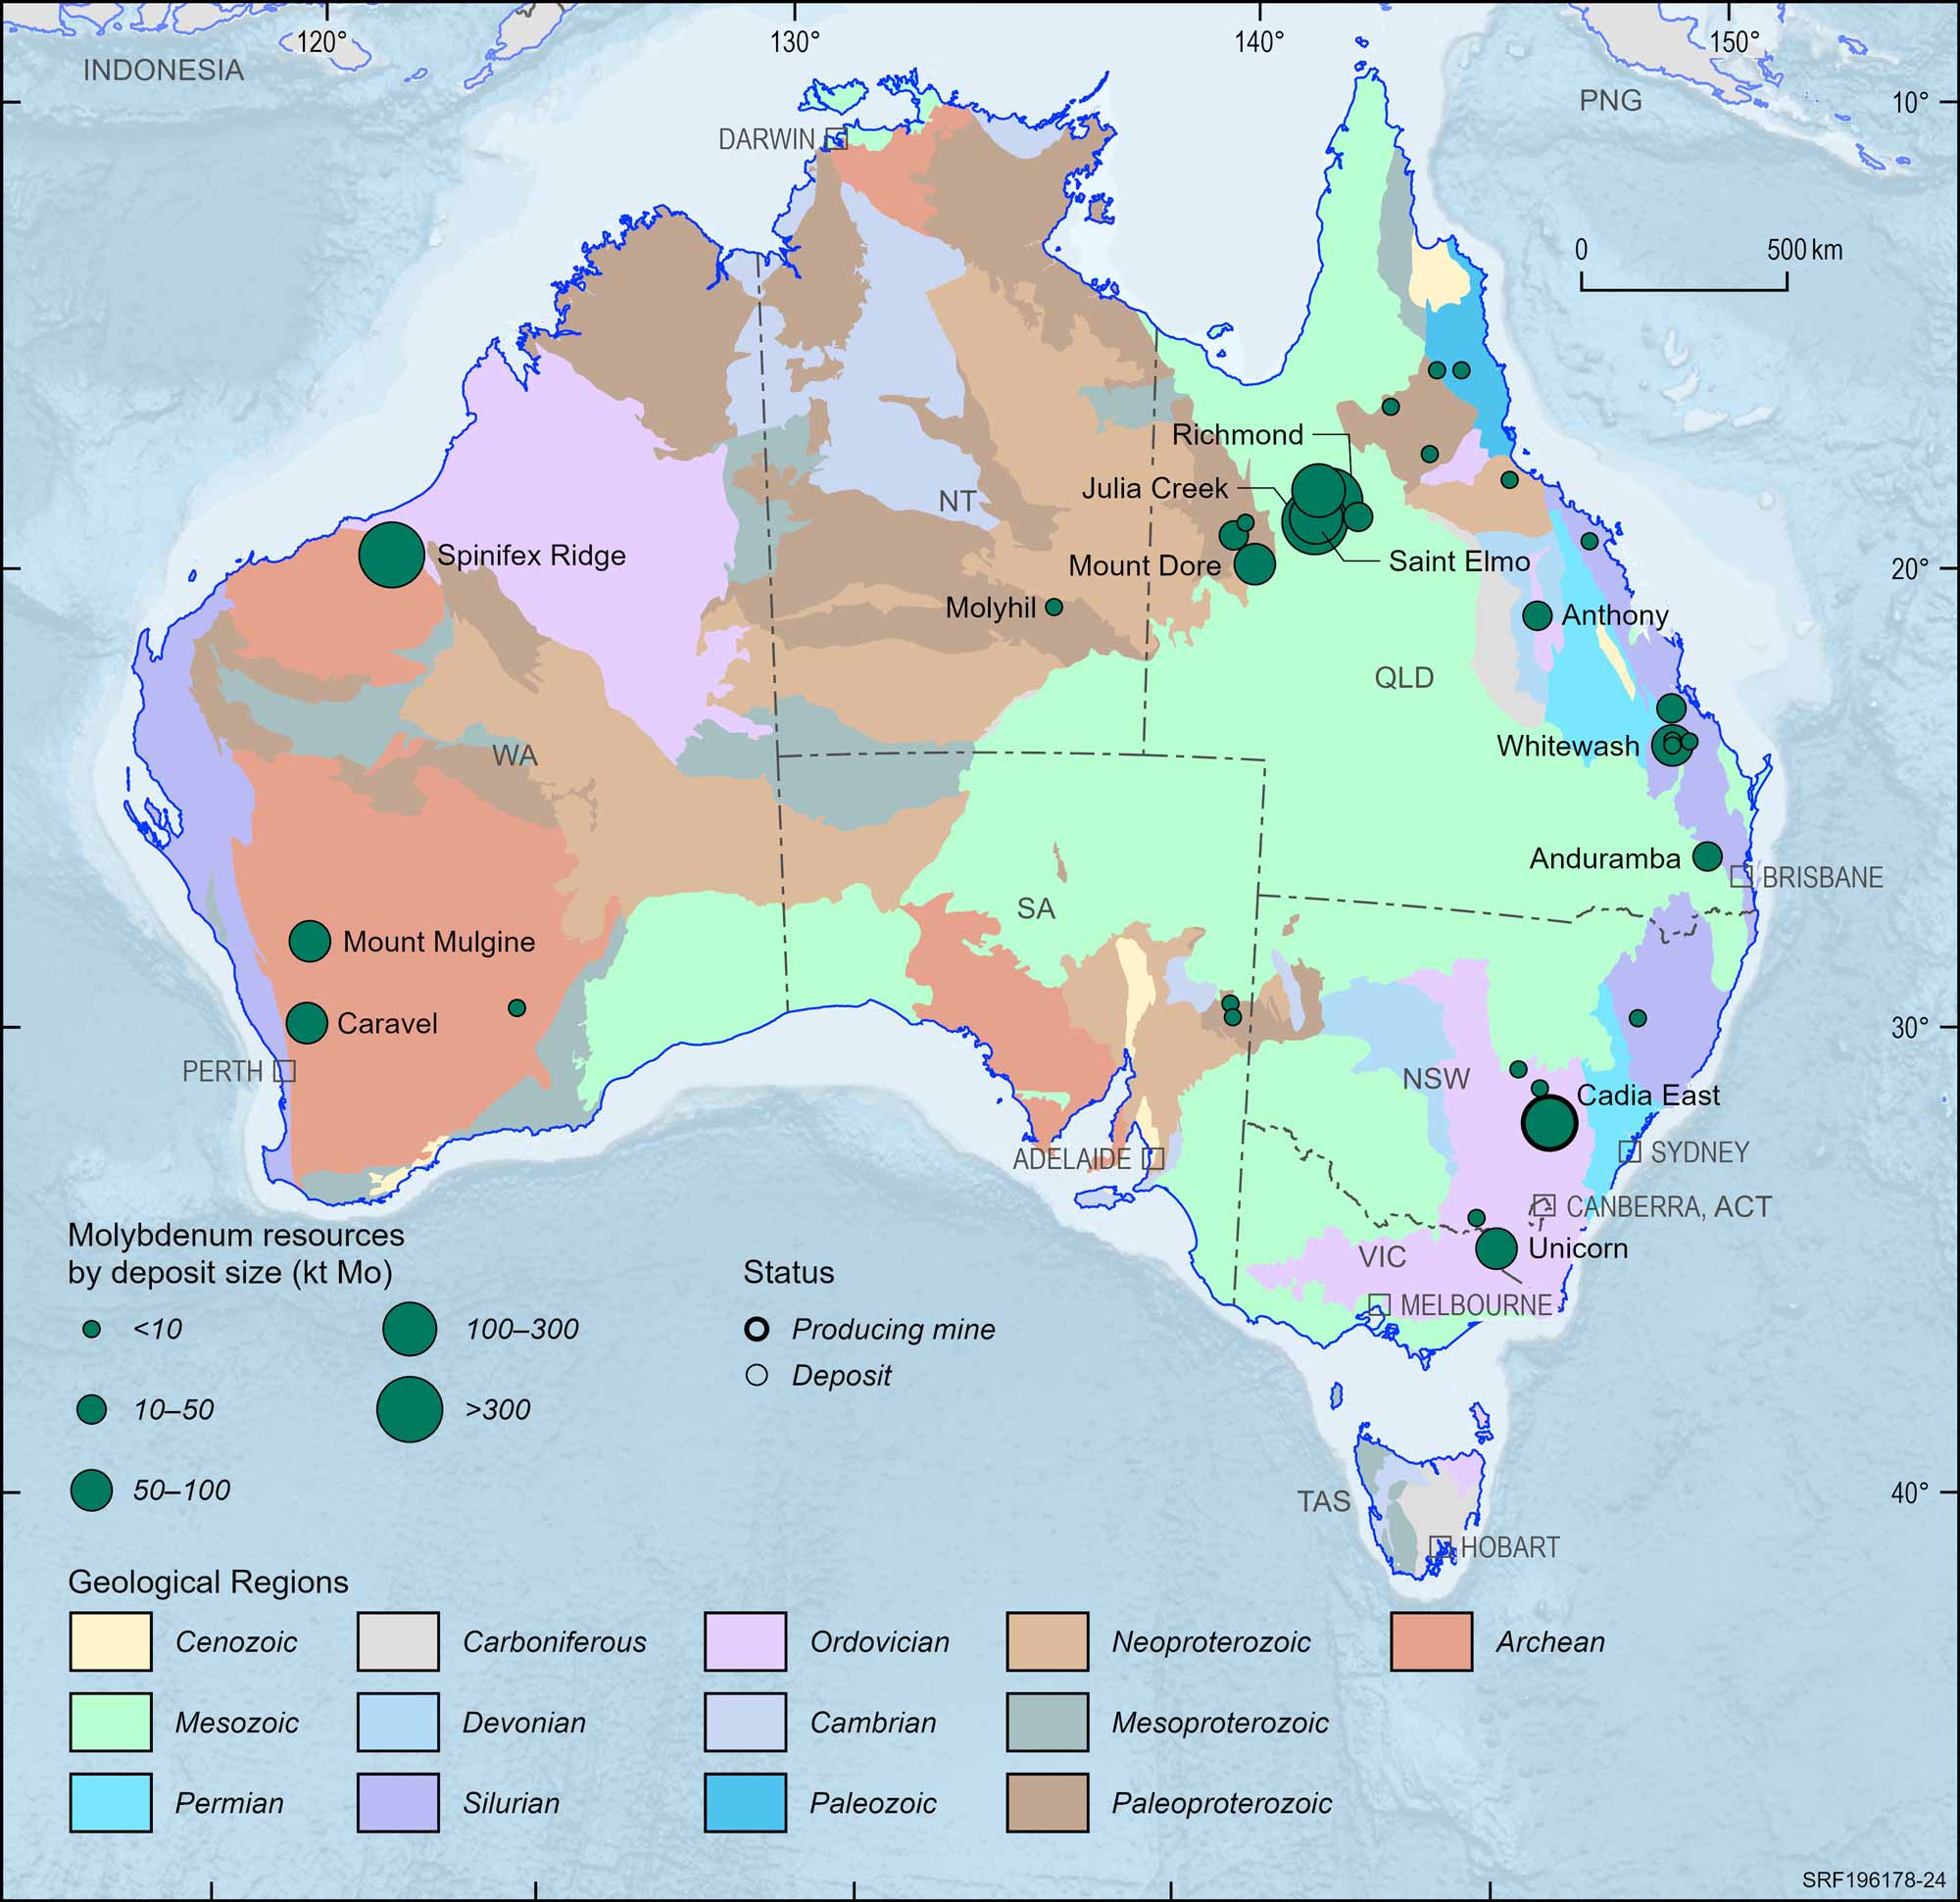
Figure 24. Australian molybdenum deposits and operating mines, 2023.
Deposit size is based on total resources (EDR + Subeconomic Demonstrated Resources + Inferred).
For clarity, only major or significant deposits are labelled.
Nickel
Critical Mineral
Operating Mines
15
1
EDR
24.6 Mt Ni
2%
Ore Reserves
10.5 Mt Ni
22%
Production
0.15 Mt Ni
4%
Export Income
$4,557 m
4%
World Ranking
Resources
2 (19%)
Production
6 (4%)
Major Uses:
Stainless and heat-resistant steel production used in chemical industries, motor vehicles, medical applications, electronic engineering and construction. Also non-ferrous alloys, electroplating and lithium-ion batteries.
Abbreviations
Mt Ni – million tonnes of nickel content; $m – million dollars (Australian).
Notes
Resource figures are as at 31 December 2023. Operating mines and production are for calendar year 2023. Percentage increases and decreases and changes in the number of mines are in relation to 2022. World rankings are followed by percentage share in brackets. Export income is the sum of refined/ intermediate and ore/concentrate categories sourced from Office of the Chief Economist, Resources and Energy Quarterly, September 2024.
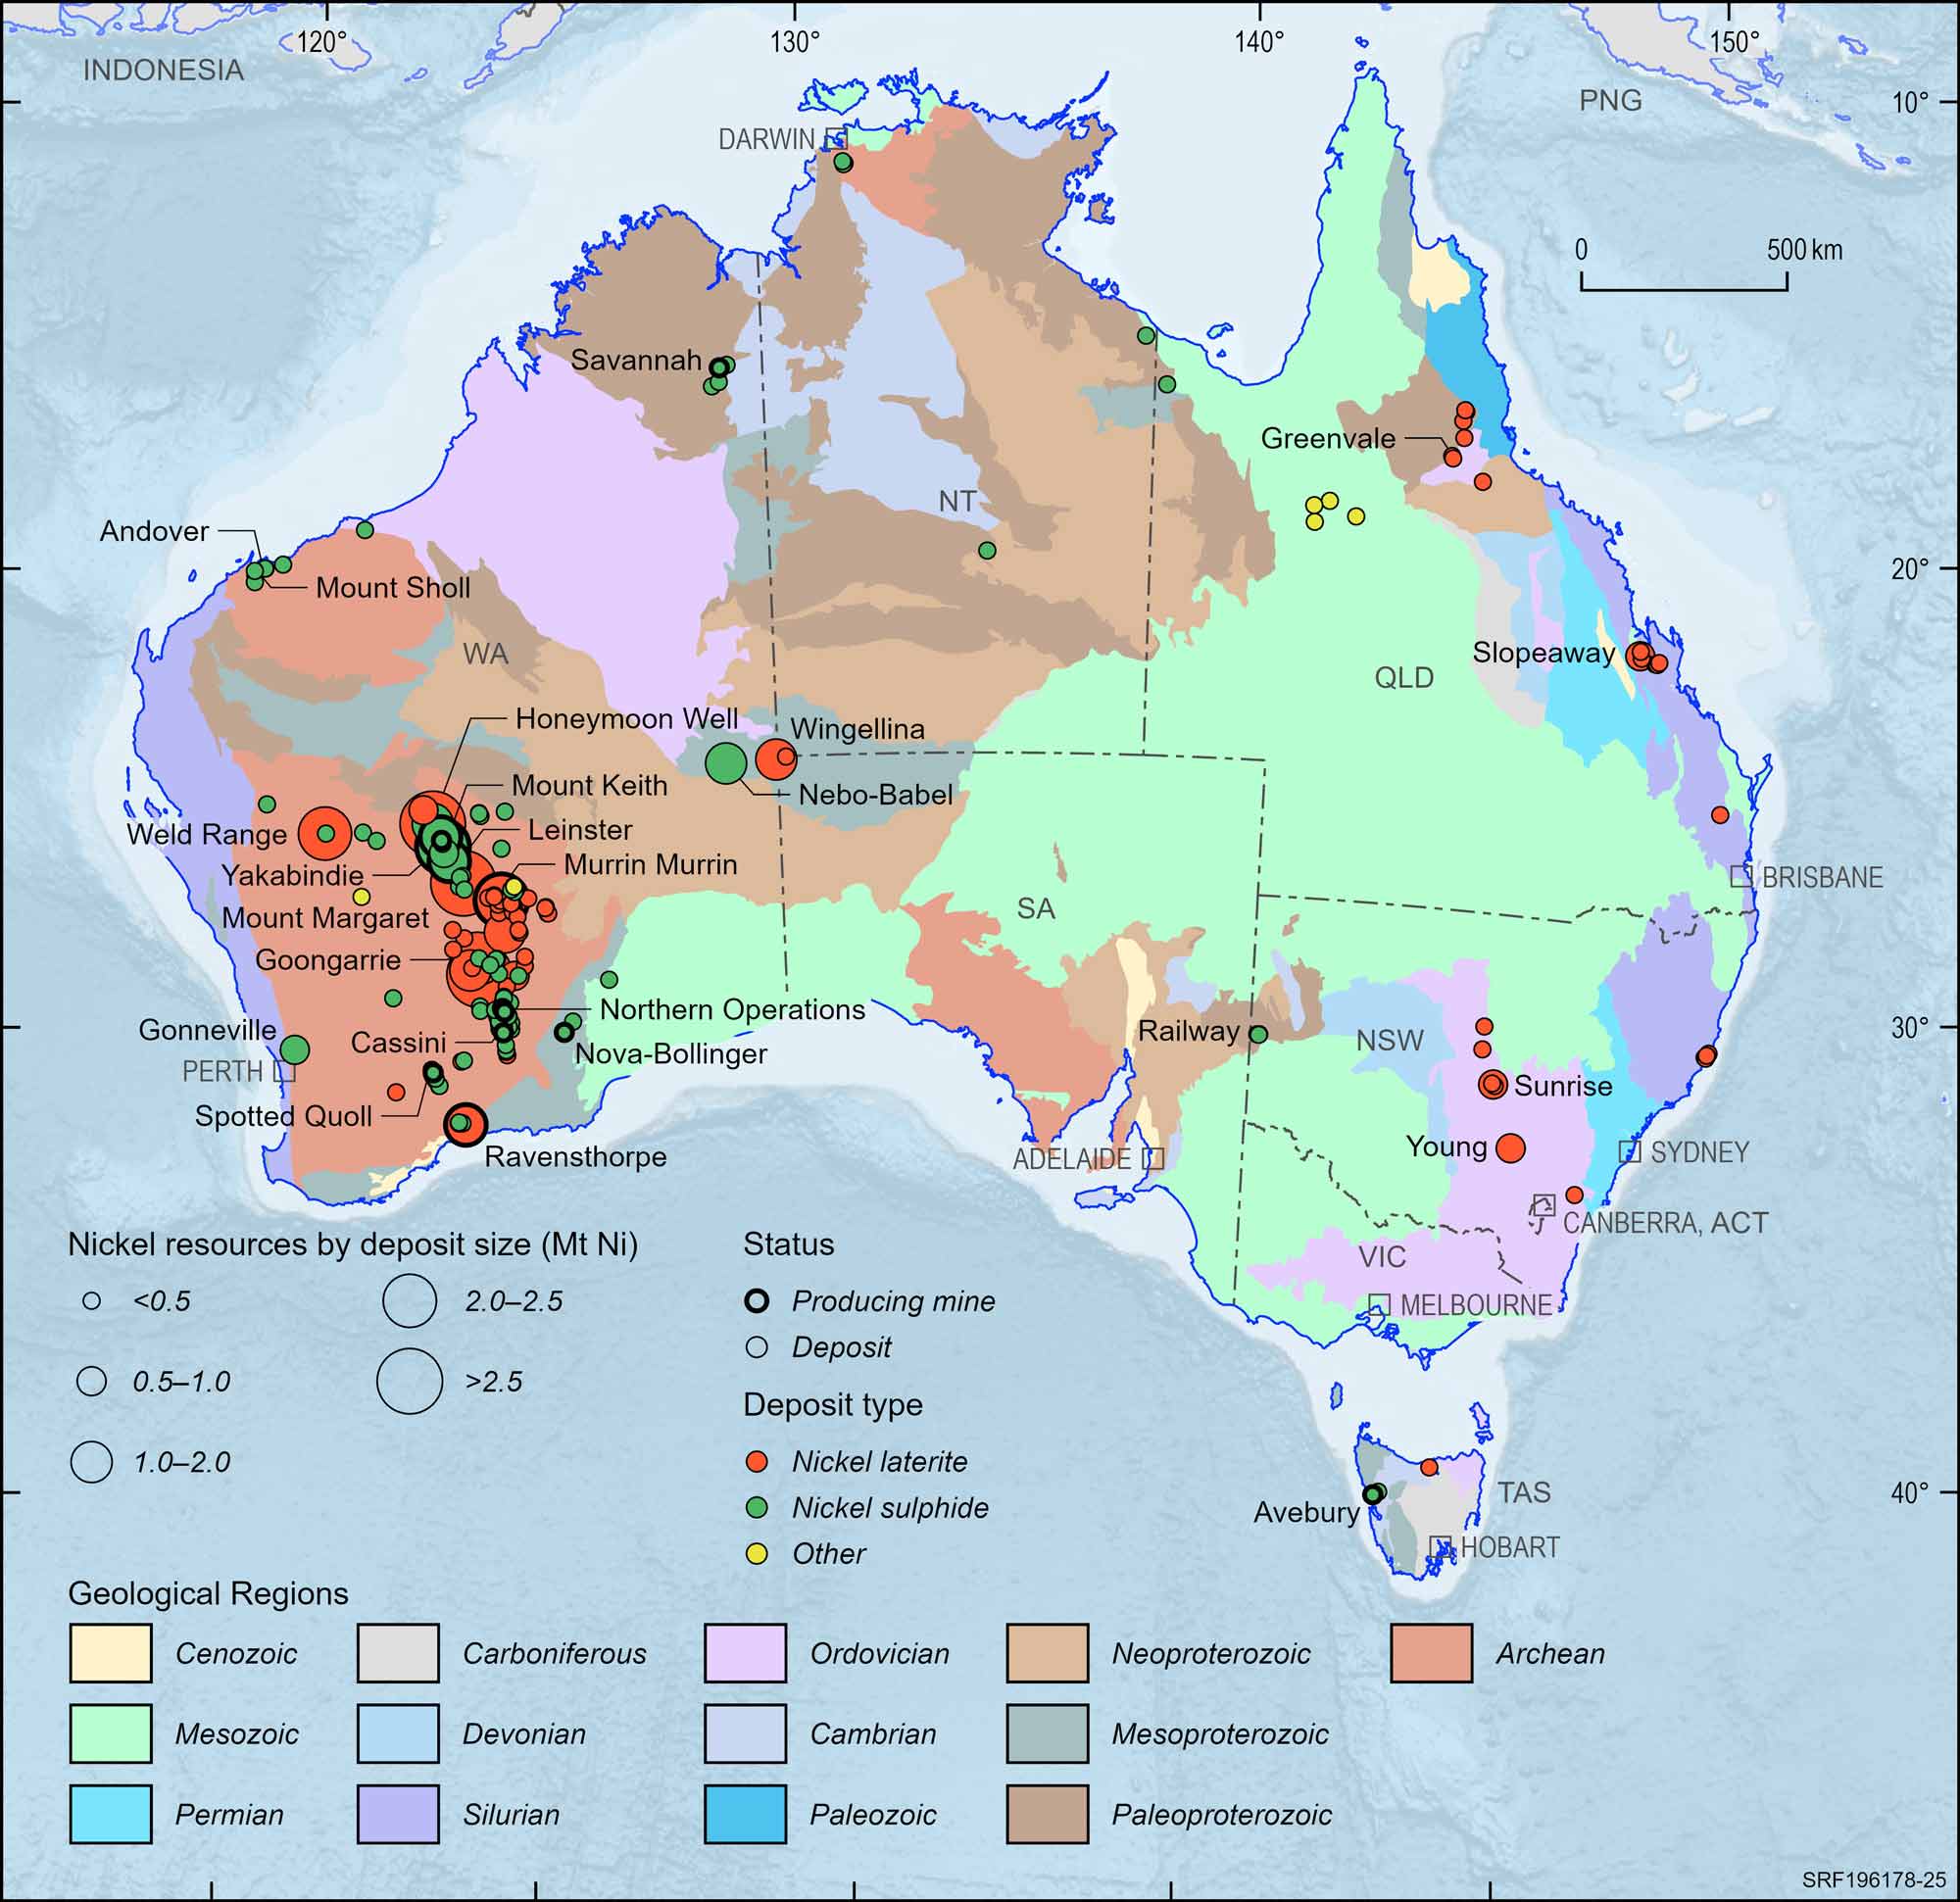
Figure 25. Australian nickel deposits and operating mines, 2023.
Deposit size is based on total resources (EDR + Subeconomic Demonstrated Resources + Inferred).
For clarity, only major or significant deposits are labelled.
Phosphate
STRATEGIC MATERIAL
Operating Mines
3
n.c.
EDR
803 Mt
26%
Ore Reserves
123 Mt
1%
Production
0.7 Mt
0%
Export Income
n.a.
0%
World Ranking
Resources
11 (1%)
Production
13 (1%)
Major Uses:
Source of phosphorus, a strategic material. Phosphorous is used for fertilisers, animal feed, food additives, detergents, herbicides, electronics, asphalt, pharmaceuticals and cosmetics. There is no substitute for phosphorus in agriculture.
Abbreviations
Mt – million tonnes of phosphate rock; n.a. – not available; n.c. – no change.
Notes
Resource figures are as at 31 December 2023. Operating mines and production are for calendar year 2023. Percentage increases and decreases and changes in the number of mines are in relation to 2022. World rankings are followed by percentage share in brackets.
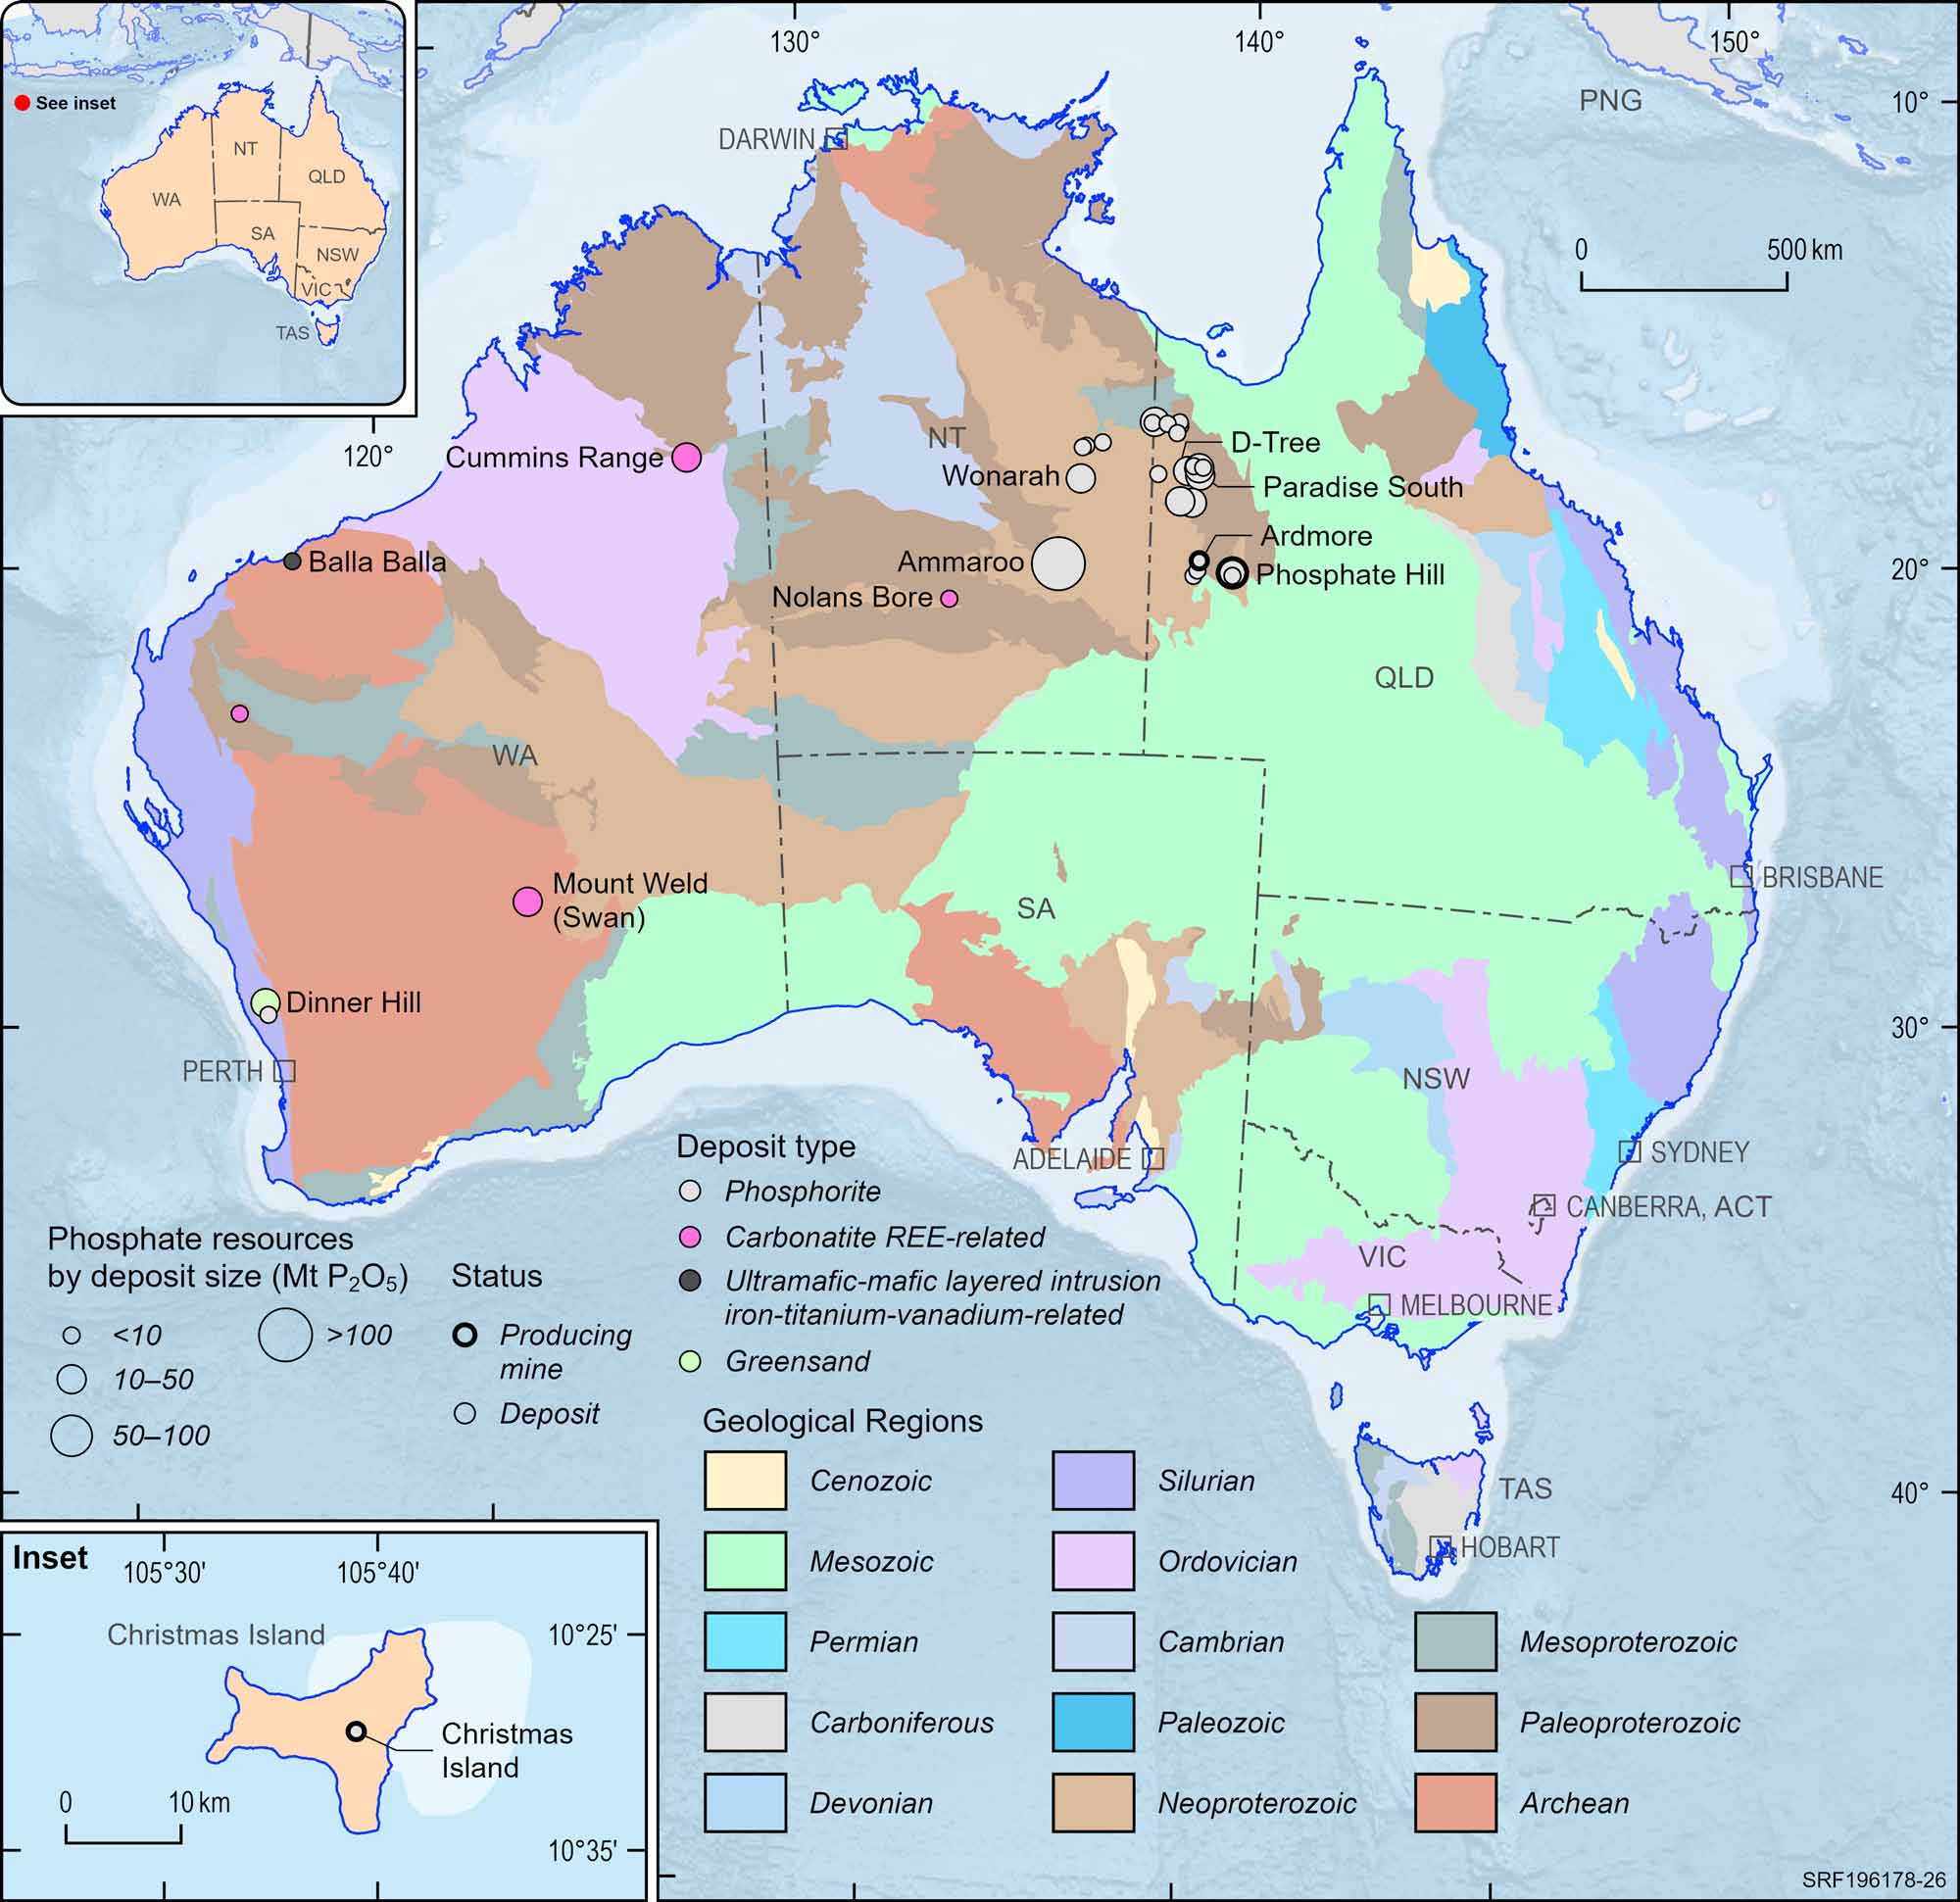
Figure 26. Australian phosphate deposits and operating mines, 2023.
Deposit size is based on total resources (EDR + Subeconomic Demonstrated Resources + Inferred).
For clarity, only major or significant deposits are labelled.
Platinum Group Elements
Critical Mineral
Operating Mines
0
n.c.
EDR
466.3 t metal
30%
Ore Reserves
60.1 t metal
17%
Production
0.512 t metal
4%
Export Income
>$30.31 m
n.a.
World Ranking
Resources
minor
Production
minor
Major Uses:
Jewellery, investment instrument, chemical industries, catalysts and catalytic converters, electronic devices, glass manufacture, industrial crucibles and surgical implants.
Abbreviations
t metal –tonnes of metal content from platinum group elements; $m – million dollars (Australian); n.a. – not available; n.c. – no change.
Notes
Resource figures are as at 31 December 2023. Operating mines and production are for calendar year 2023. Percentage increases and decreases and changes in the number of mines are in relation to 2022. World rankings are followed by percentage share in brackets. Export income from Department of Mines, Industry Regulation and Safety, Western Australian Government 2023 Major Commodities Resource Data File.
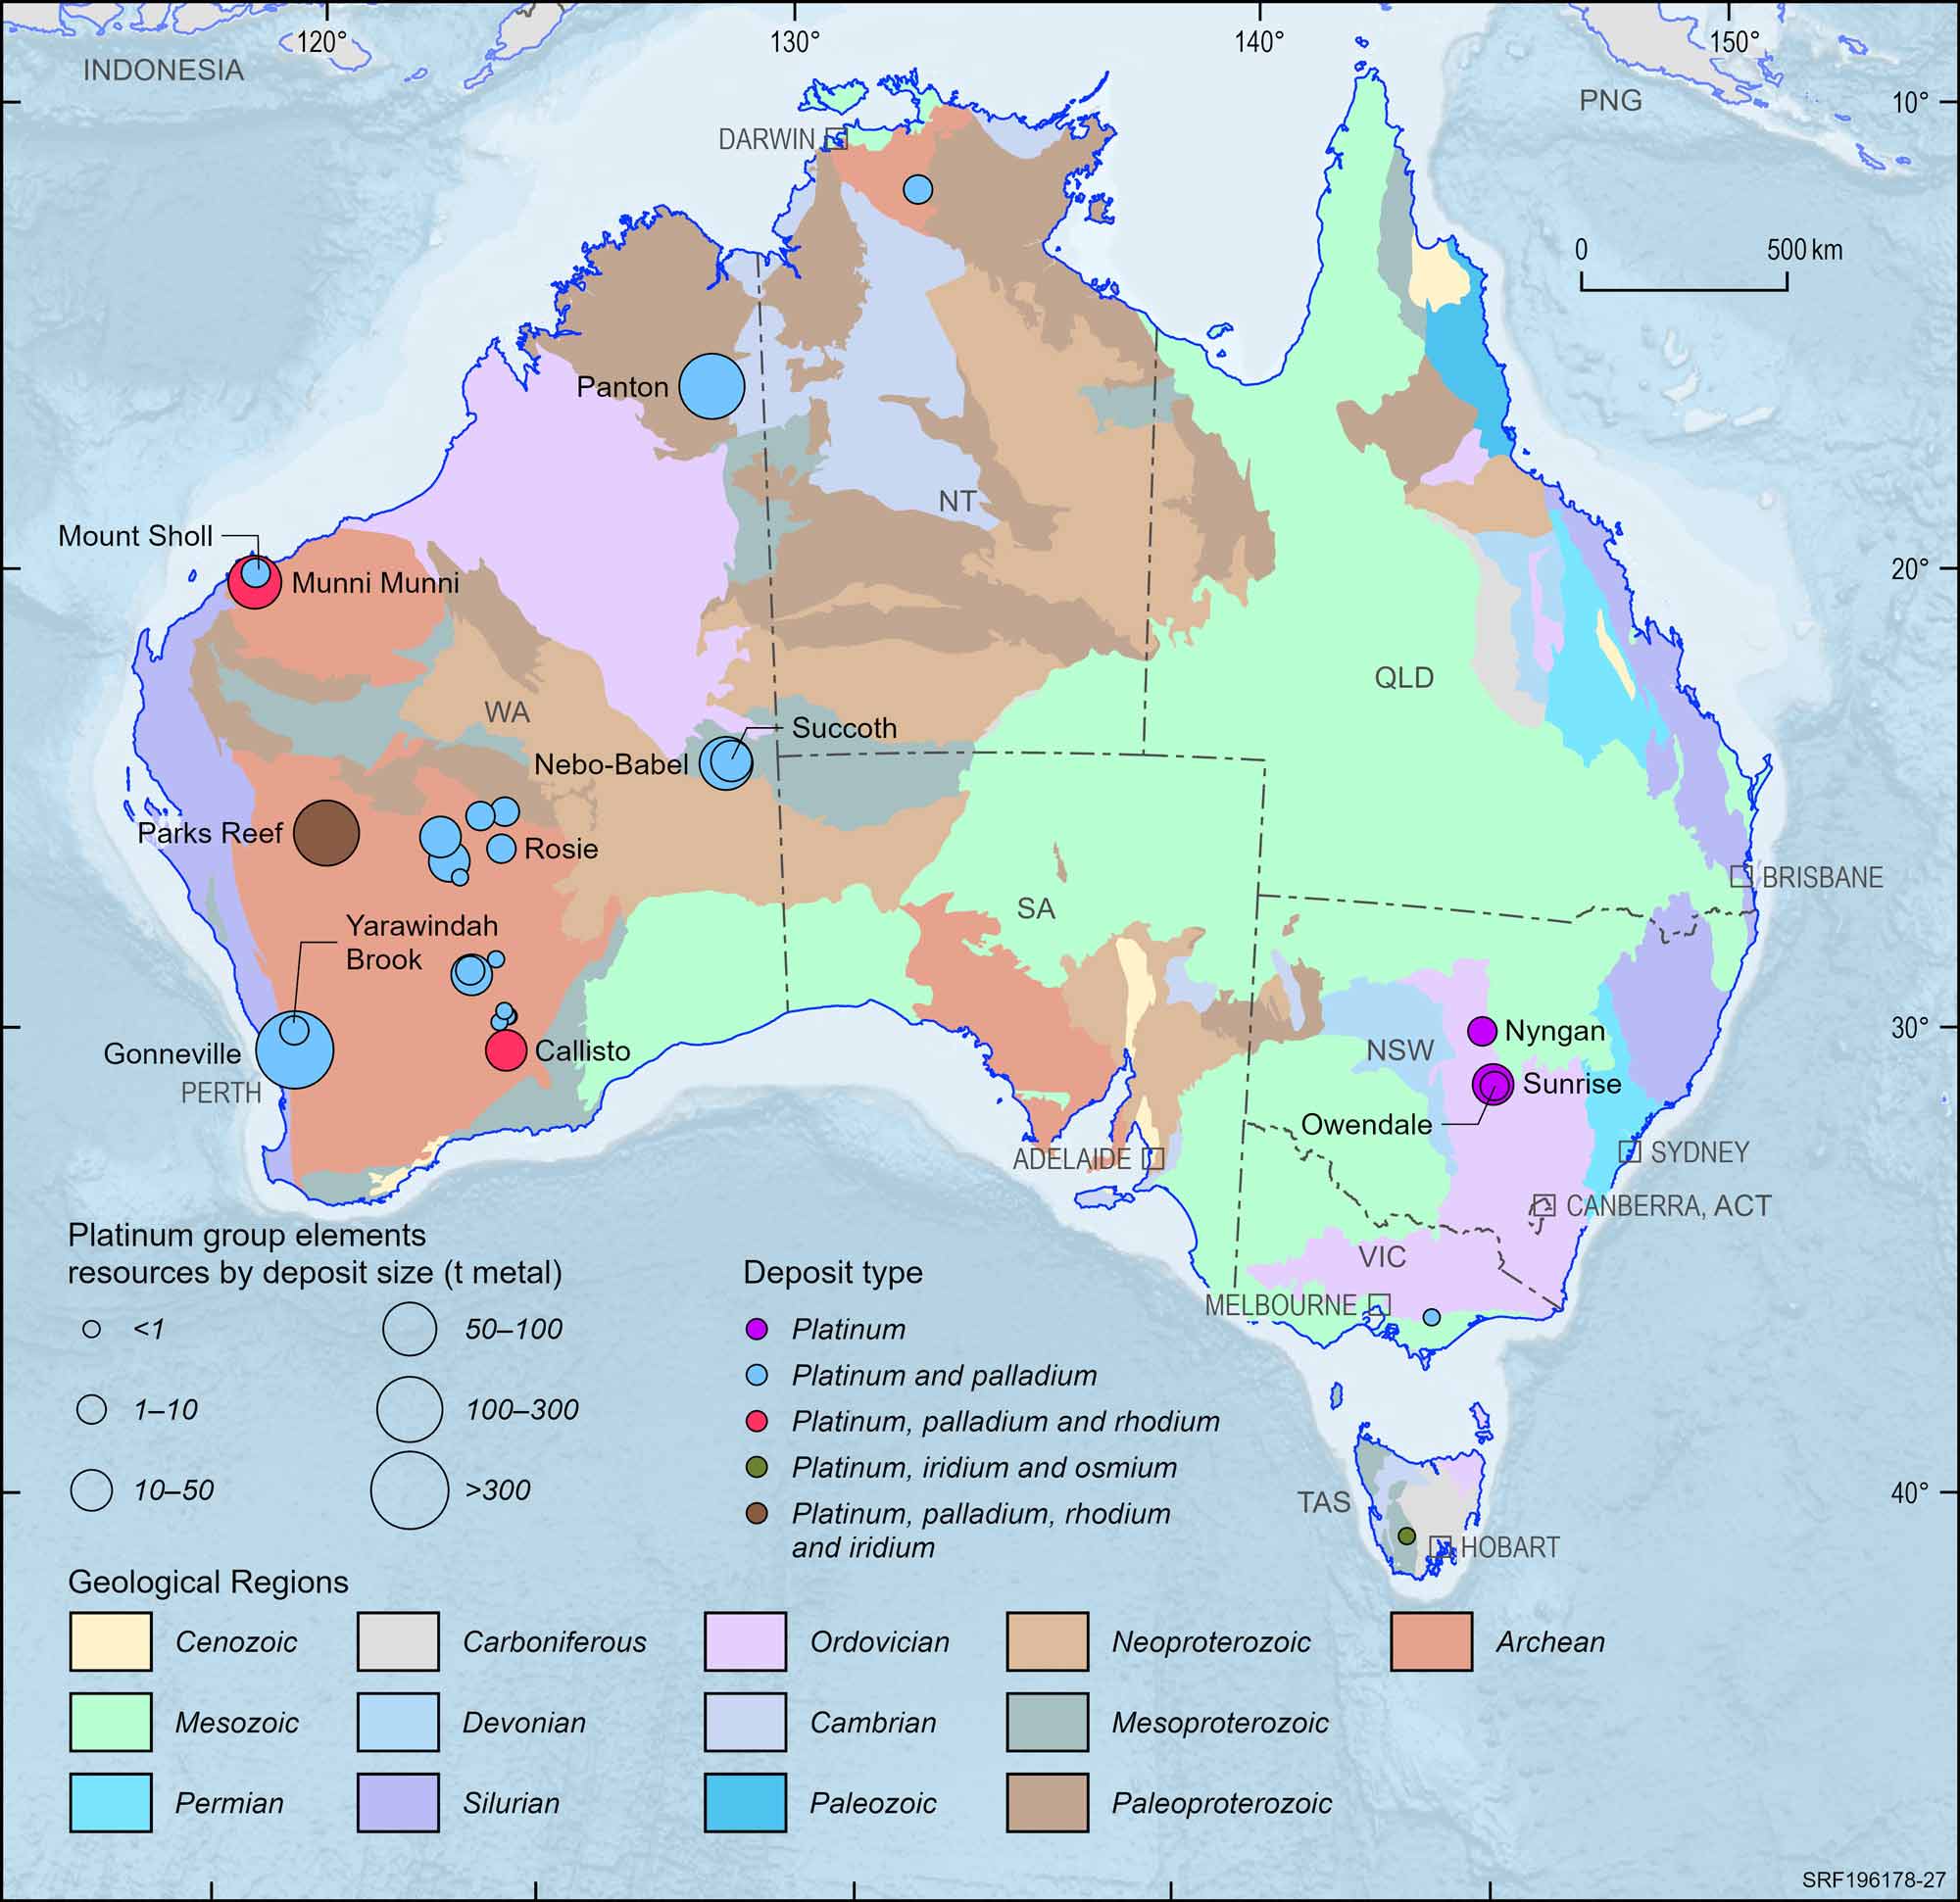
Figure 27. Australian platinum group element deposits, 2023.
Deposit size is based on total resources (EDR + Subeconomic Demonstrated Resources + Inferred).
For clarity, only major or significant deposits are labelled. Not all deposits (e.g. Coronation Hill) are accessible
Potash
Operating Mines
1
n.c.
EDR
49.4 Mt K2O
4%
Ore Reserves
18.3 Mt K2O
0%
Production
<0.01 Mt K2O
0%
Export Income
n.a.
0%
World Ranking
Resources
12 (1%)
Production
minor
Major Uses:
Fertilisers, animals feeds, ceramics, detergents, pharmaceuticals, de-icing and glass manufacture.
Abbreviations
Mt K2O – million tonnes of potassium oxide content; n.a. – not available; n.c. – no change.
Notes
Resource figures are as at 31 December 2023. Operating mines and production are for calendar year 2023. Percentage increases and decreases and changes in the number of mines are in relation to 2022. World rankings are followed by percentage share in brackets.
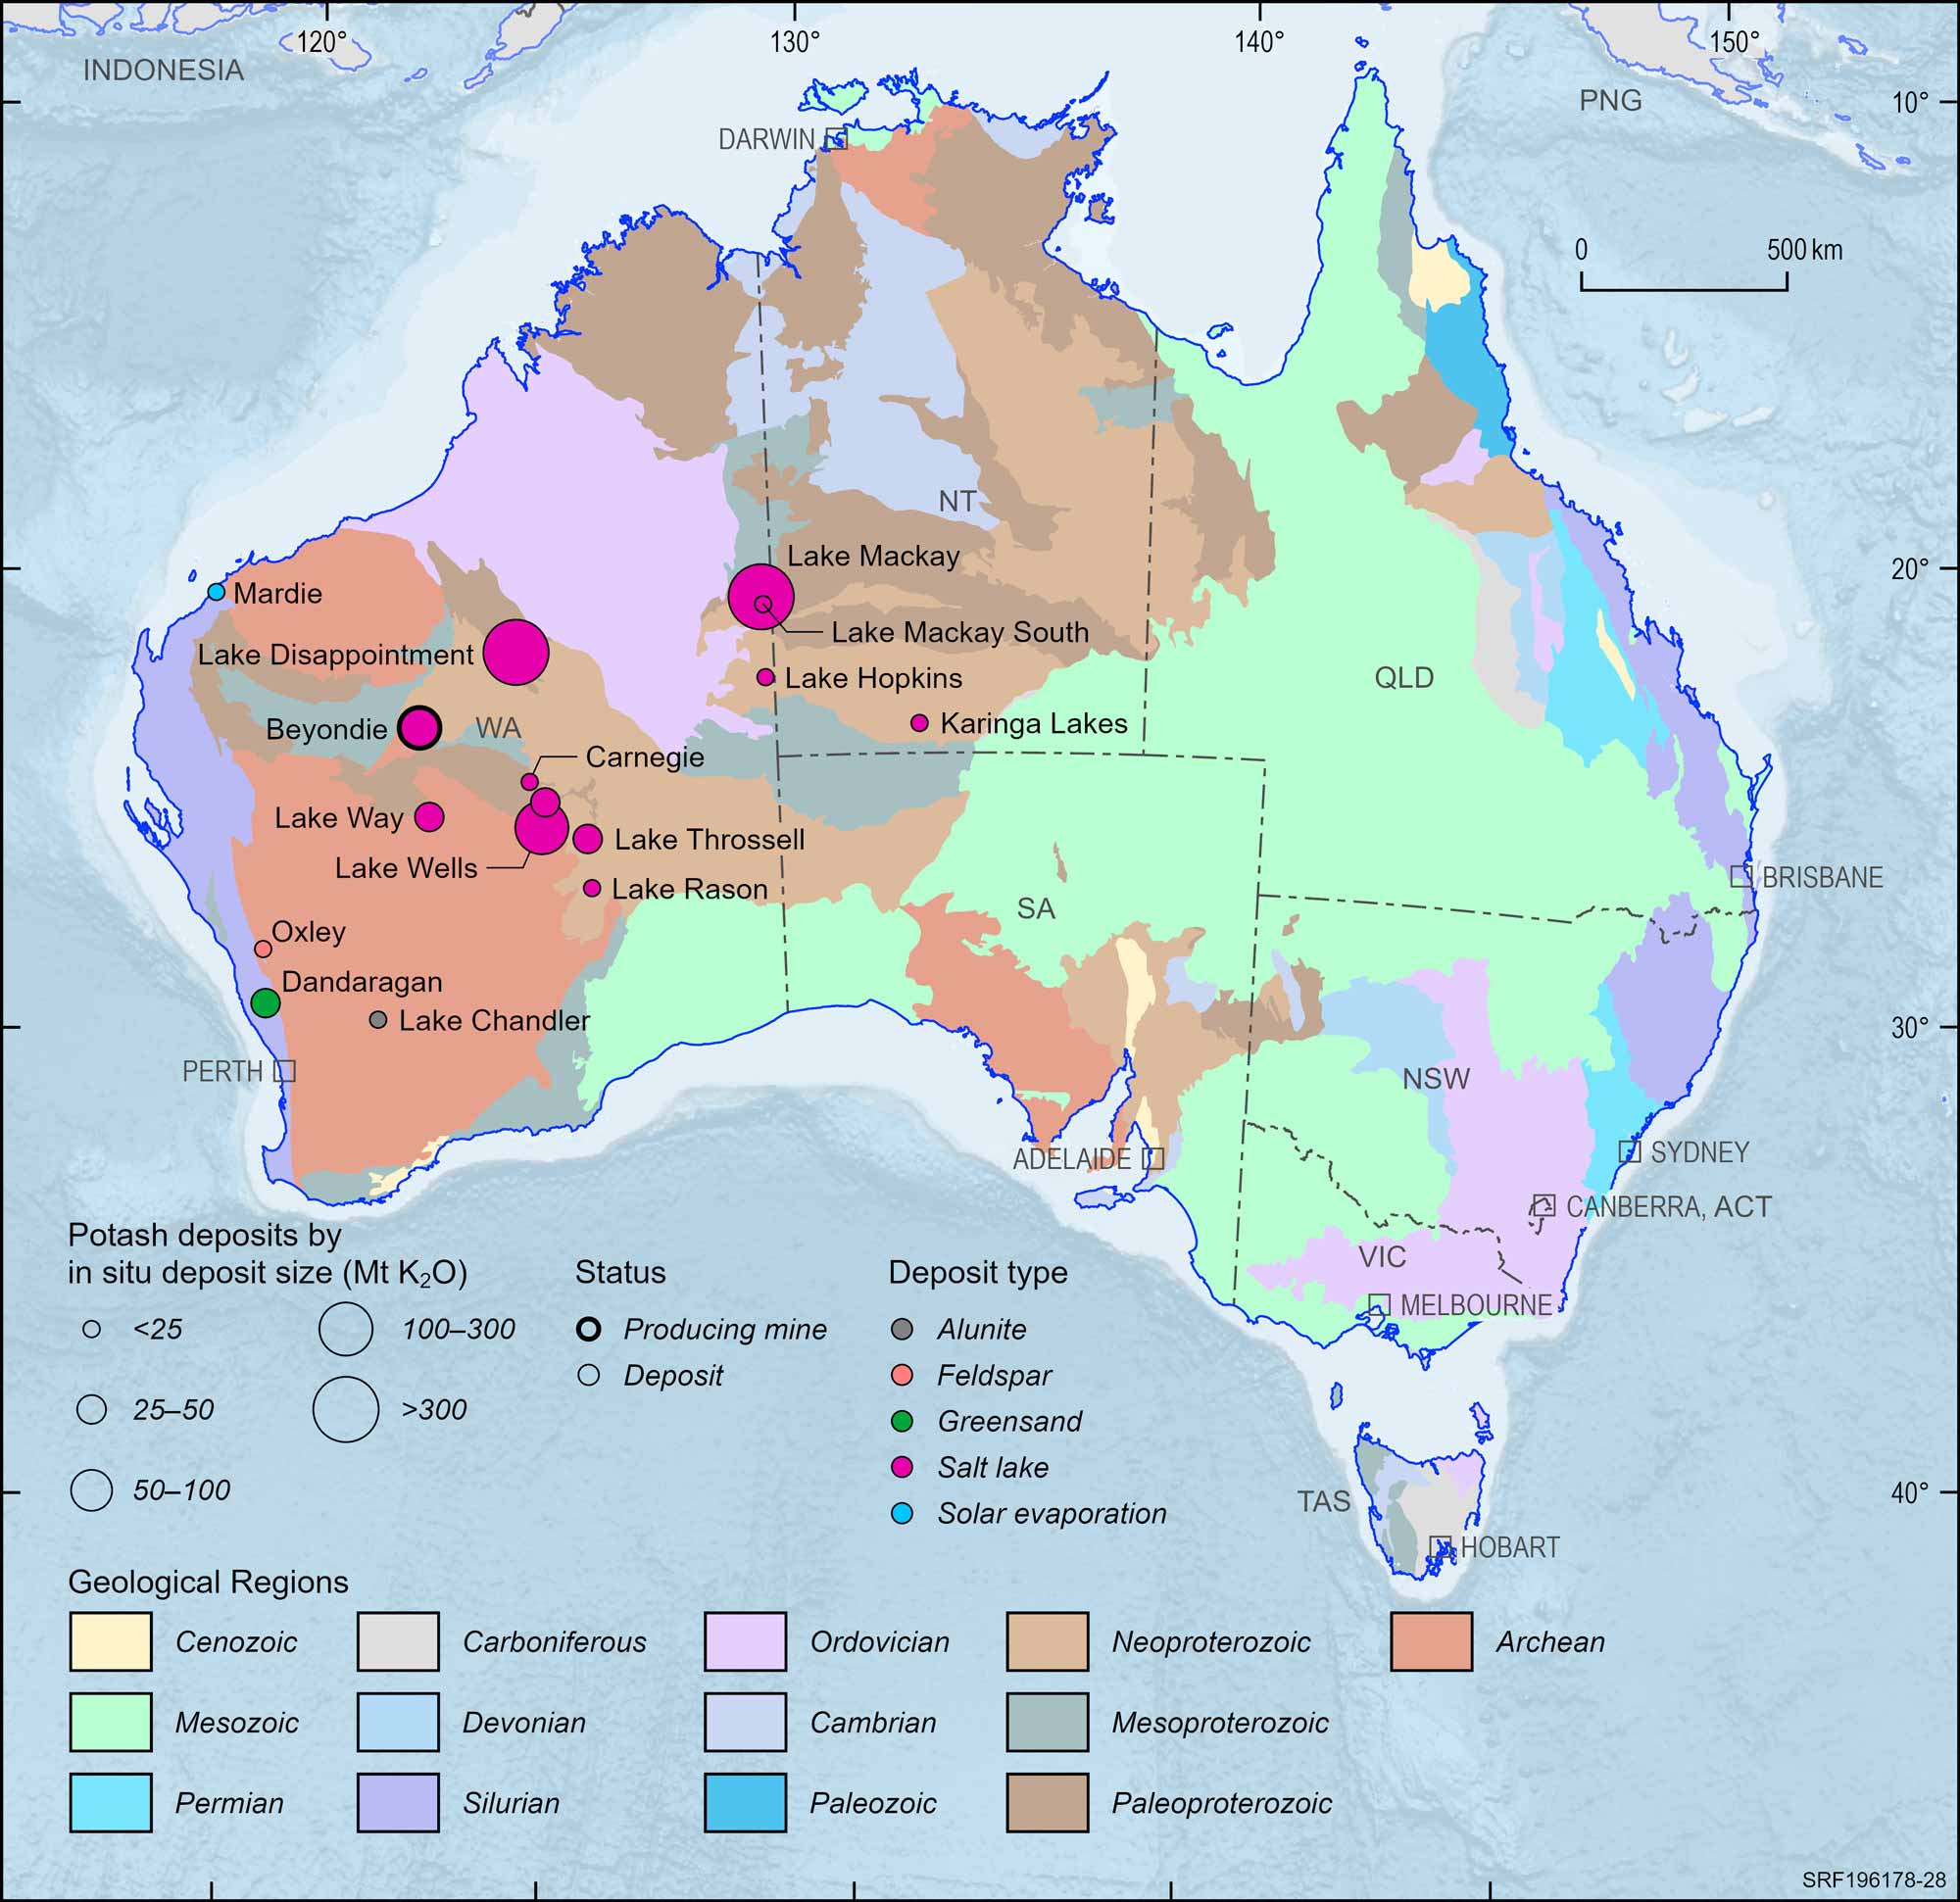
Figure 28. Australian potash deposits and operating mines, 2023.
Deposit size is based on total resources (EDR + Subeconomic Demonstrated Resources + Inferred).
Rare Earth Elements
Critical Mineral
Operating Mines
2
n.c.
EDR
6.26 Mt oxide
10%
Ore Reserves
3.34 Mt oxide
2%
Production
0.029 Mt oxide
79%
Export Income
n.a.
0%
World Ranking
Resources
6 (5%)
Production
4 (8%)
Major Uses:
Permanent magnets, motors, metal alloys, electronic and computing equipment, batteries, catalytic converters, petroleum refining, medical imaging, colouring agents, phosphors, lasers and special glass.
Abbreviations
Mt oxide – million tonnes of rare earth oxide plus yttrium oxide; $m – million dollars (Australian); n.a. – not available; n.c. – no change.
Notes
Resource figures are as at 31 December 2023. Operating mines and production are for calendar year 2023. Percentage increases and decreases and changes in the number of mines are in relation to 2022. World rankings are followed by percentage share in brackets. Export data is a minimum figure as it does not include data from the Northern Territory. Available export income is sourced from Department of Mines, Industry Regulation and Safety, Western Australian Government 2023 Major Commodities Resource Data File.
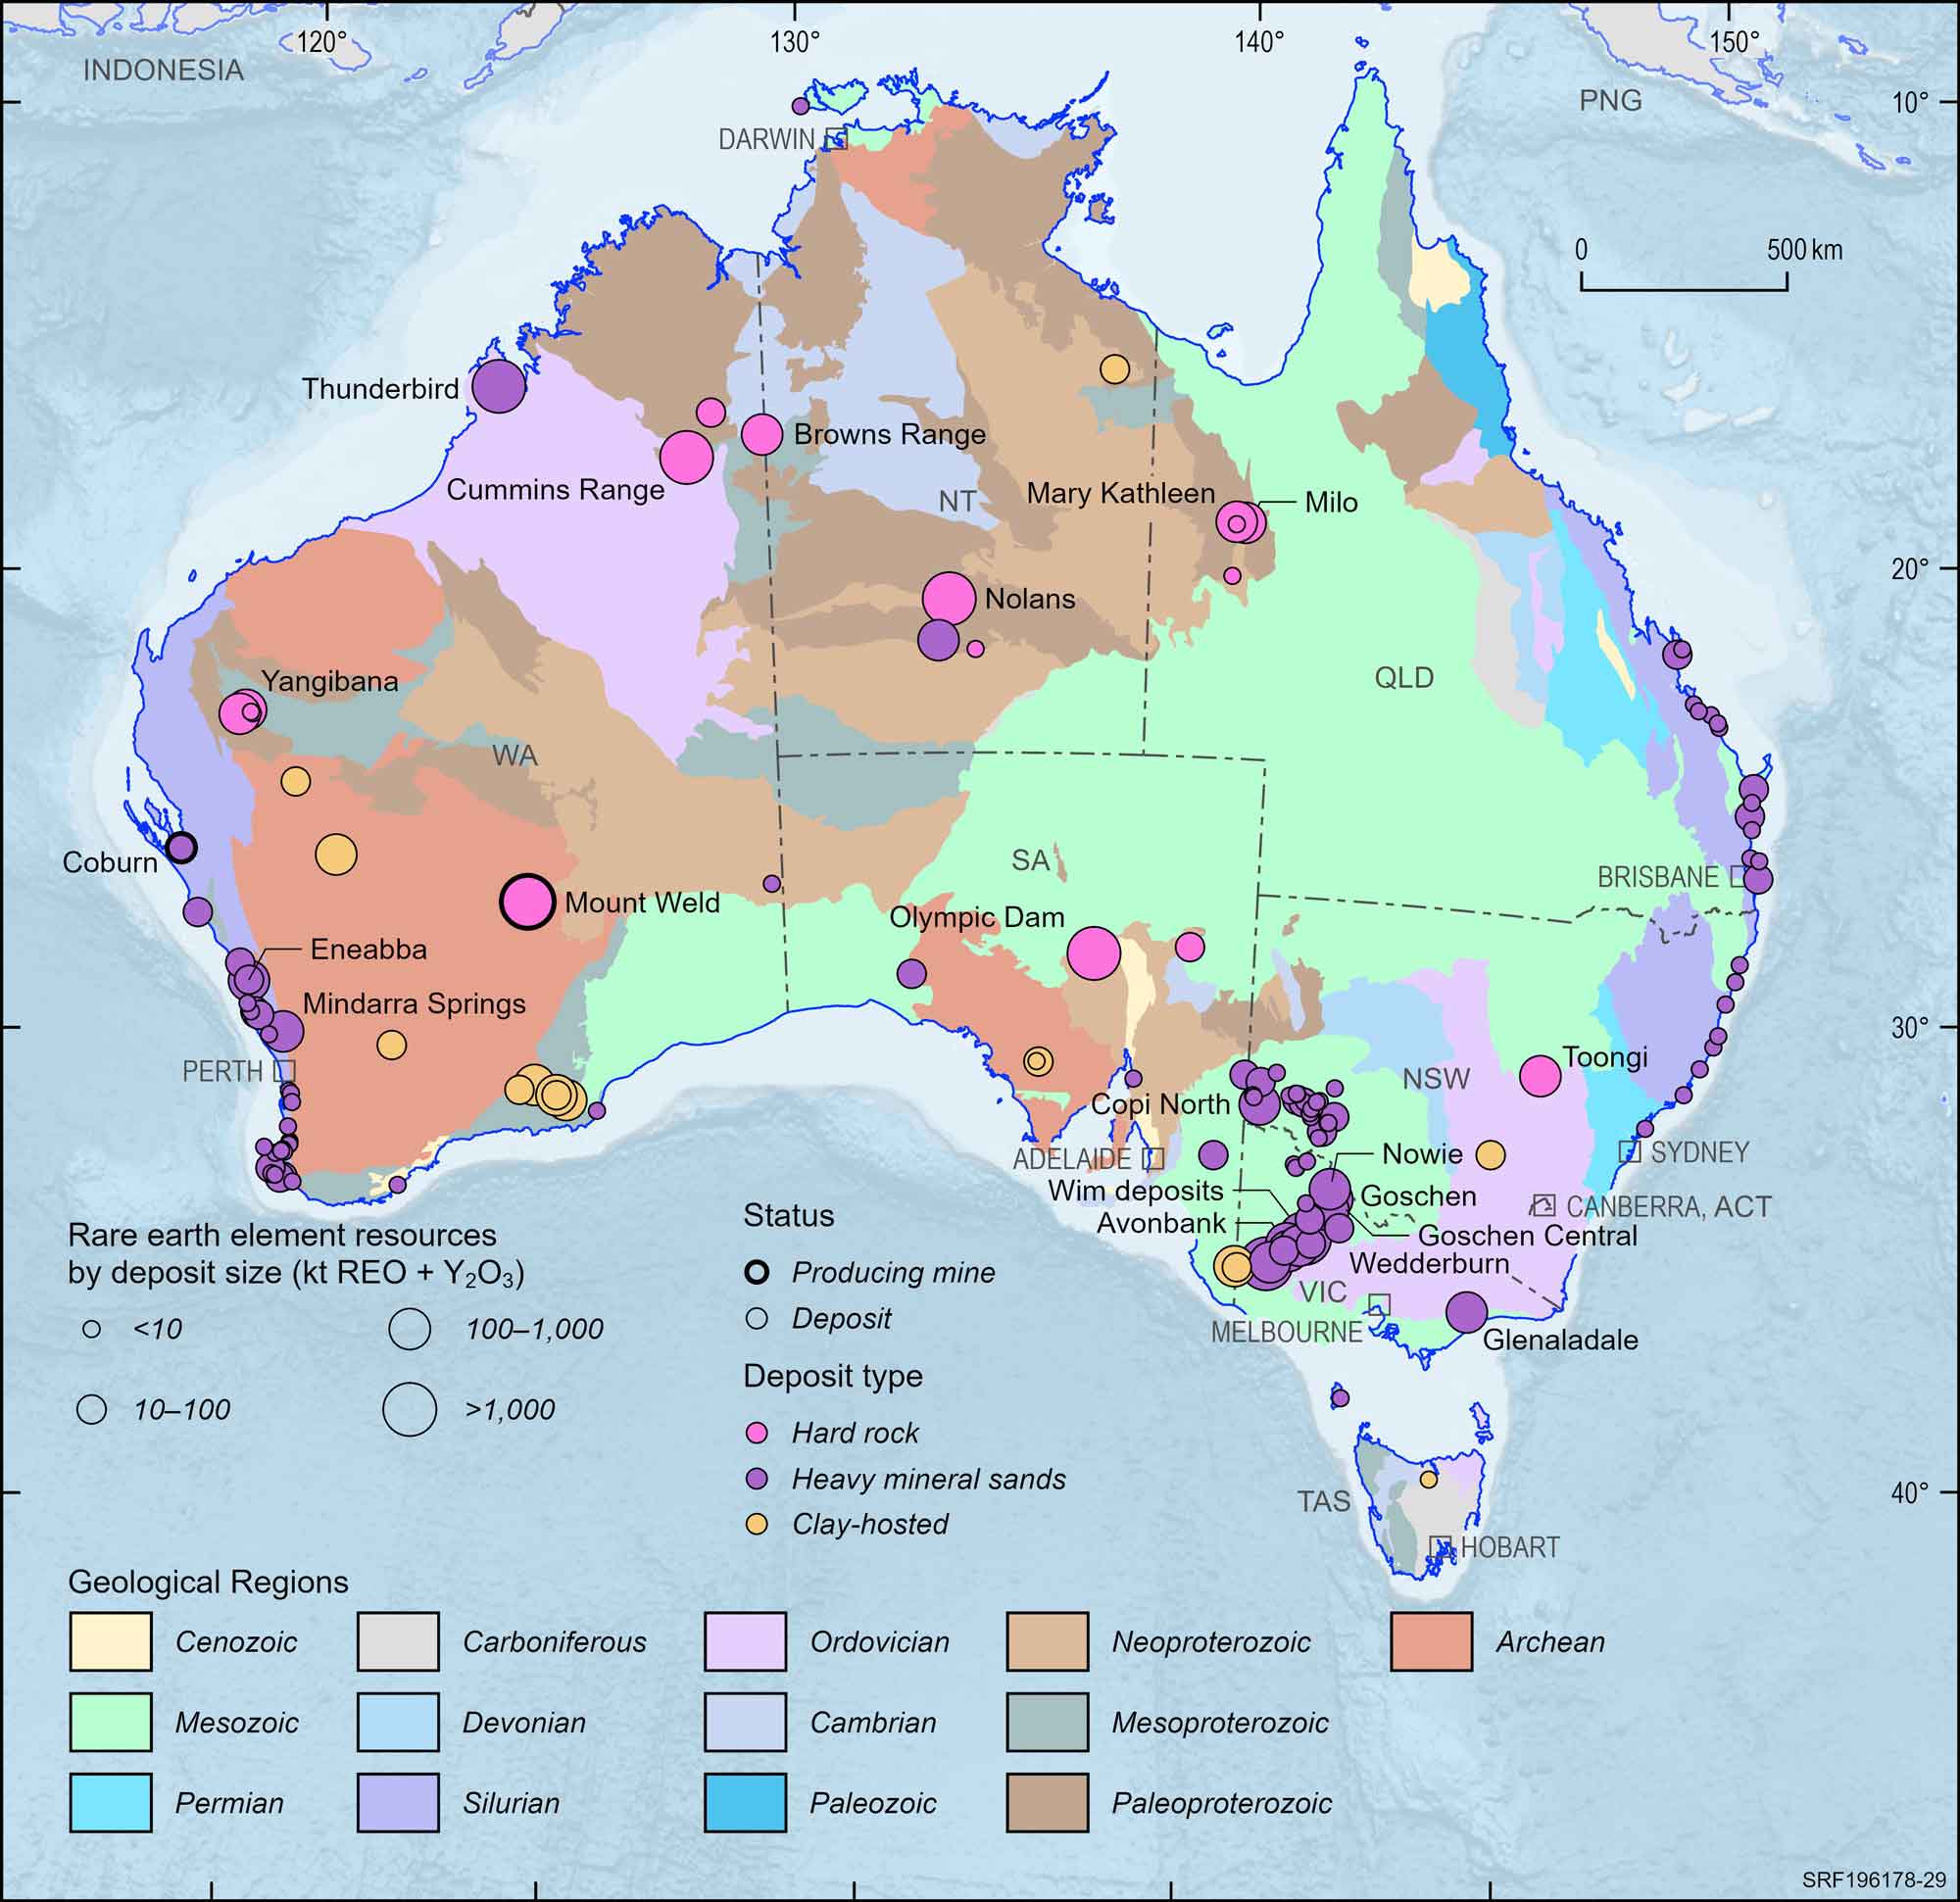
Figure 29. Australian rare earth element deposits and operating mines, 2023.
Deposit size is based on total resources (EDR + Subeconomic Demonstrated Resources + Inferred).
For clarity, only major or significant deposits are labelled.
Scandium
Critical Mineral
Operating Mines
0
n.c.
EDR
34.41 kt Sc
6%
Ore Reserves
11.65 kt Sc
0%
Production
n.a.
0%
Export Income
n.a.
0%
World Ranking
Resources
unknown
Production
n.a. (0%)
Major Uses:
Alloys for aerospace industries, solid oxide fuel cells, specialised lighting applications, ceramics, lasers, electronics and sporting goods.
Abbreviations
kt Sc – kilotonnes of scandium content; n.a. – not available; n.c. – no change.
Notes
Resource figures are as at 31 December 2023. Operating mines and production are for calendar year 2023. Percentage increases and decreases and changes in the number of mines are in relation to 2022. World rankings are followed by percentage share in brackets.
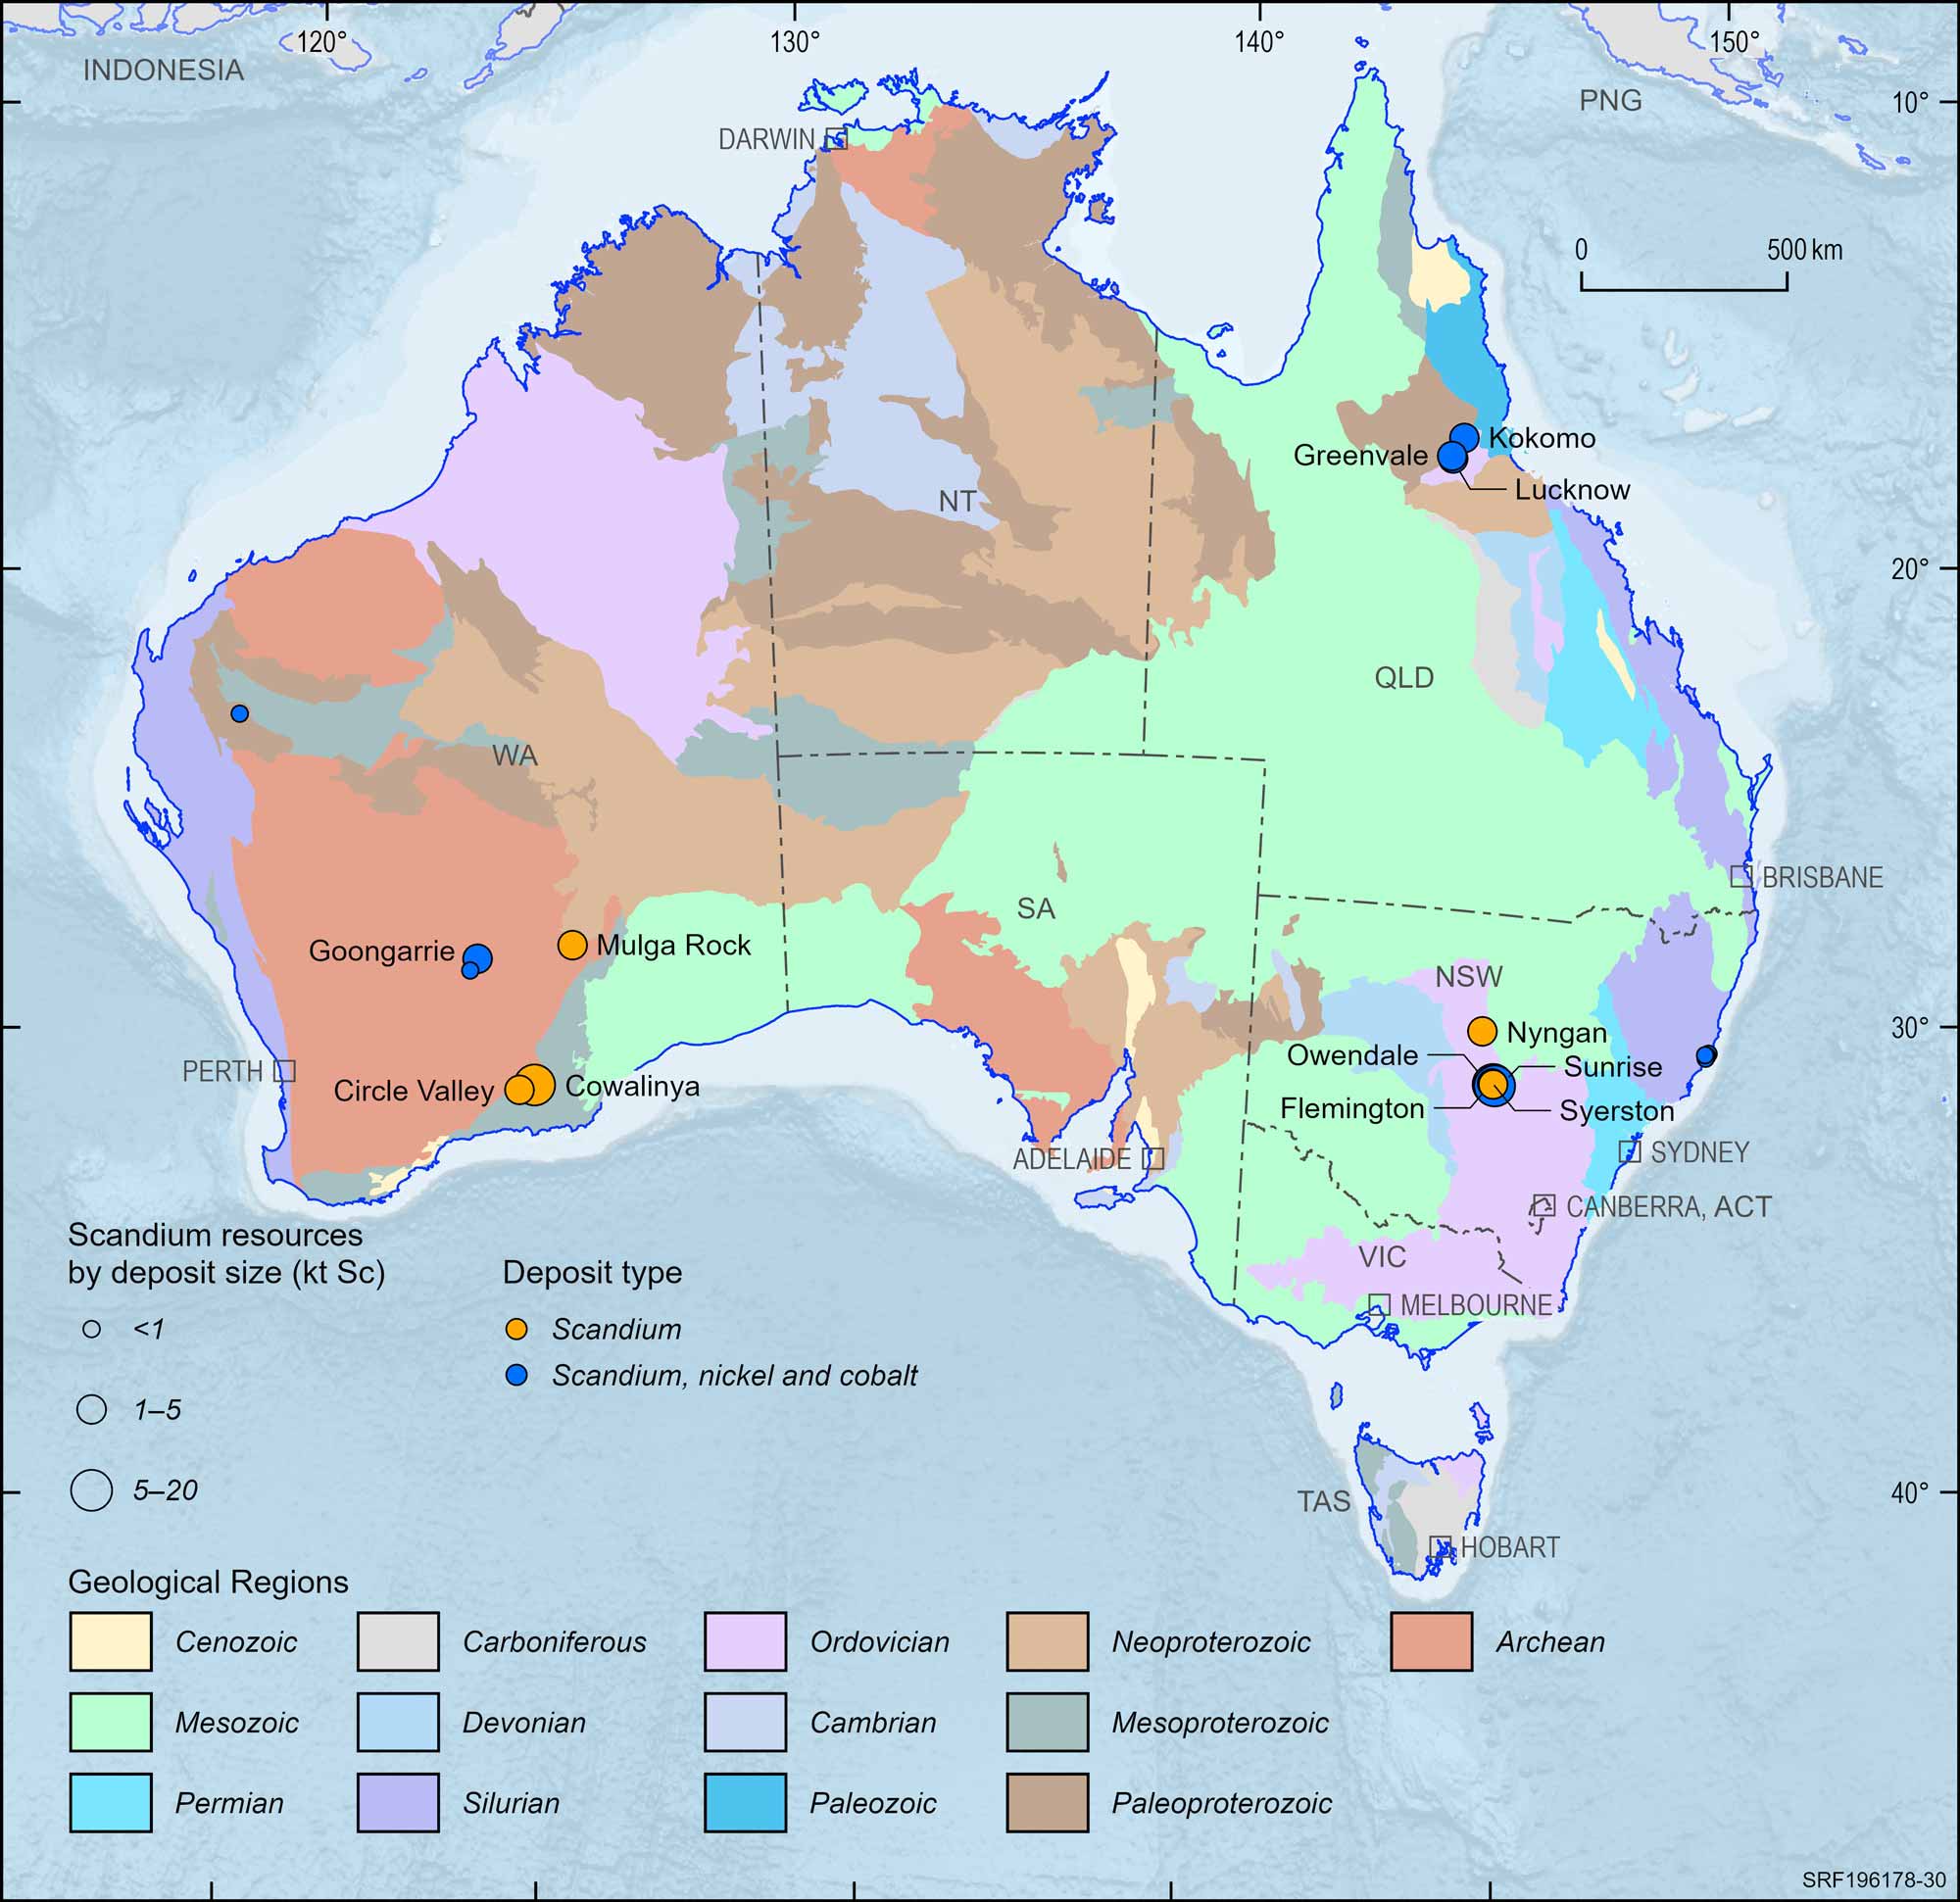
Figure 30. Australian scandium deposits, 2023.
Deposit size is based on total resources (EDR + Subeconomic Demonstrated Resources + Inferred).
For clarity, only major or significant deposits are labelled.
Silver
Operating Mines
23
3
EDR
91.39 kt Ag
2%
Ore Reserves
22.24 kt Ag
16%
Production
1.03 kt Ag
12%
Export Income
$234 m
123%
World Ranking
Resources
3 (15%)
Production
8 (4)
Major Uses:
Jewellery, silverware, storing monetary value, photographic paper and film, mirrors, water treatment, plastics, textiles and solar panels.
Abbreviations
kt Ag – kilotonnes of silver content; $m – million dollars (Australian).
Notes
Resource figures are as at 31 December 2023. Operating mines and production are for calendar year 2023. Percentage increases and decreases and changes in the number of mines are in relation to 2022. World rankings are followed by percentage share in brackets. Export income sourced from Office of the Chief Economist, Resources and Energy Quarterly, September 2024.
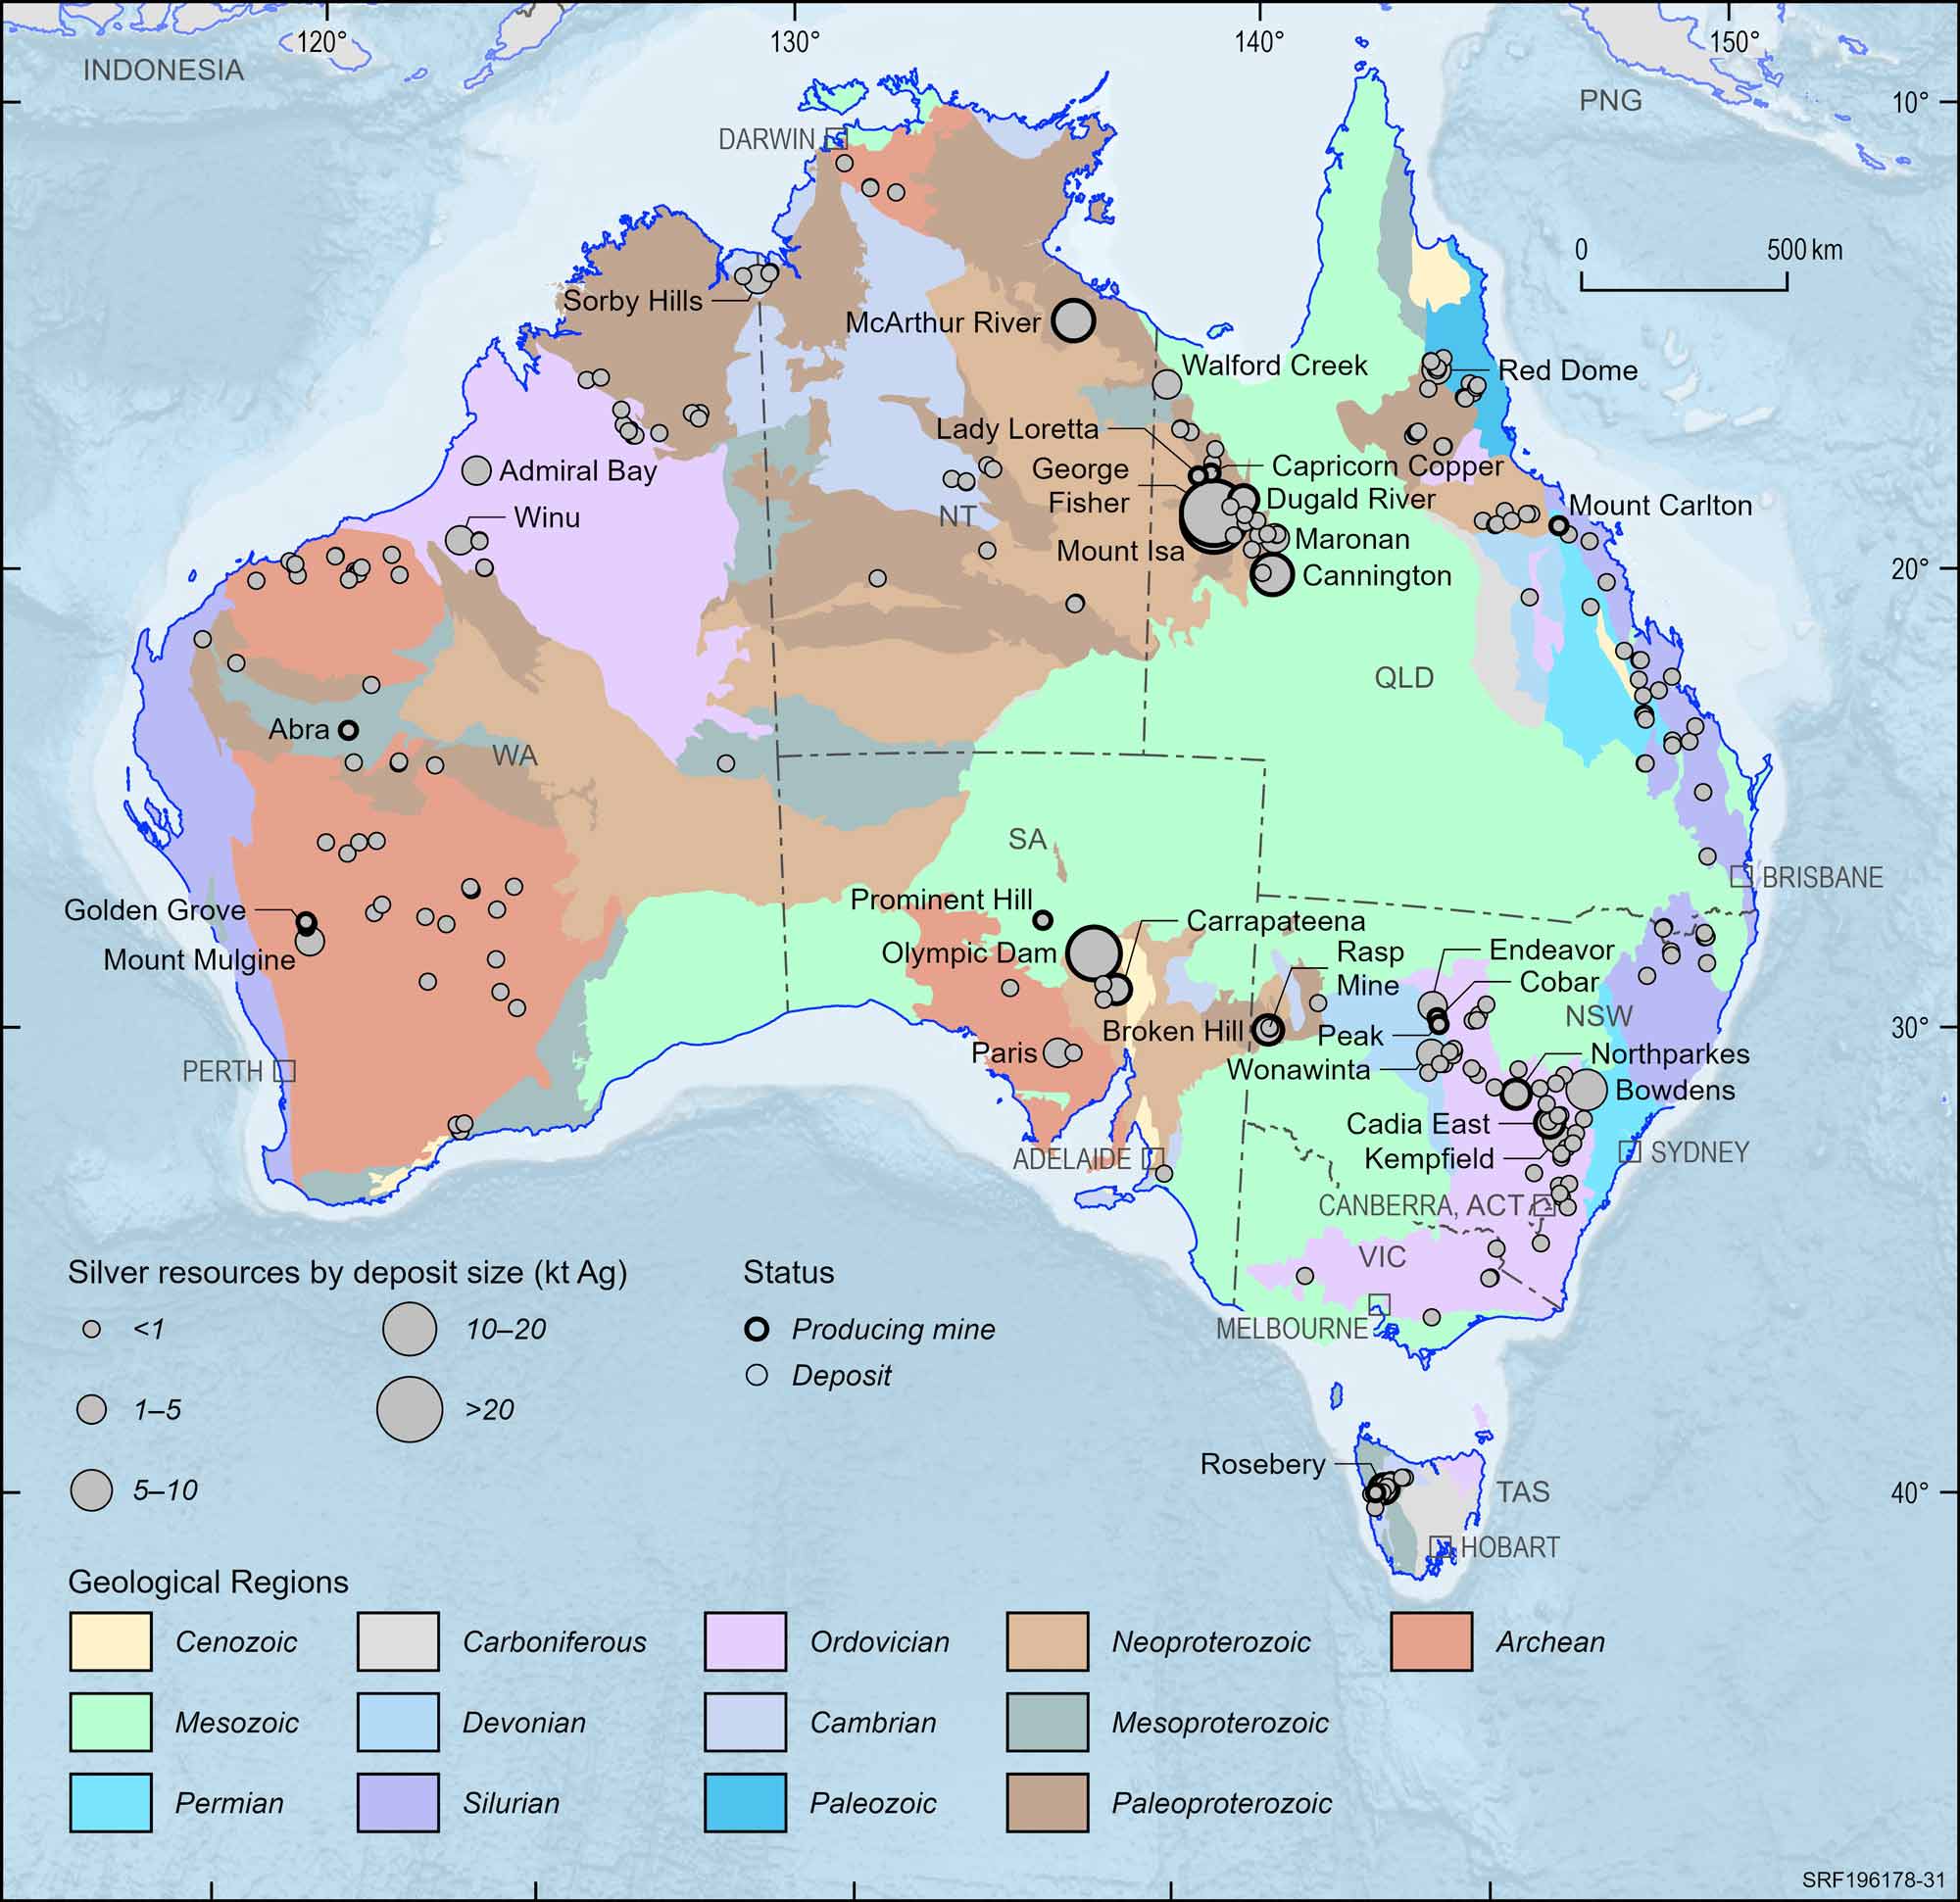
Figure 31. Australian silver deposits and operating mines, 2023.
Deposit size is based on total resources (EDR + Subeconomic Demonstrated Resources + Inferred).
For clarity, only major or significant deposits are labelled.
Tin
STRATEGIC MATERIAL
Operating Mines
1
n.c.
EDR
566 kt Sn
9%
Ore Reserves
220 kt Sn
31%
Production
9.9 kt Sn
9%
Export Income
$325 m
14%
World Ranking
Resources
3 (13%)
Production
8 (3%)
Major Uses:
Bronze for electrical products and sculpture, solders, steel coatings, metal alloys, electric vehicles, lead-acid batteries, lithium-ion batteries, superconducting magnets, dyes, disinfectants, perfumes, cast iron, fire retardants and pewter.
Abbreviations
kt Sn – kilotonnes of tin content; $m – million dollars (Australian); n.c. – no change.
Notes
Resource figures are as at 31 December 2023. Operating mines and production are for calendar year 2023. Percentage increases and decreases and changes in the number of mines are in relation to 2022. World rankings are followed by percentage share in brackets. Export income is based on tin concentrate and sourced from Office of the Chief Economist, Resources and Energy Quarterly, September 2024.
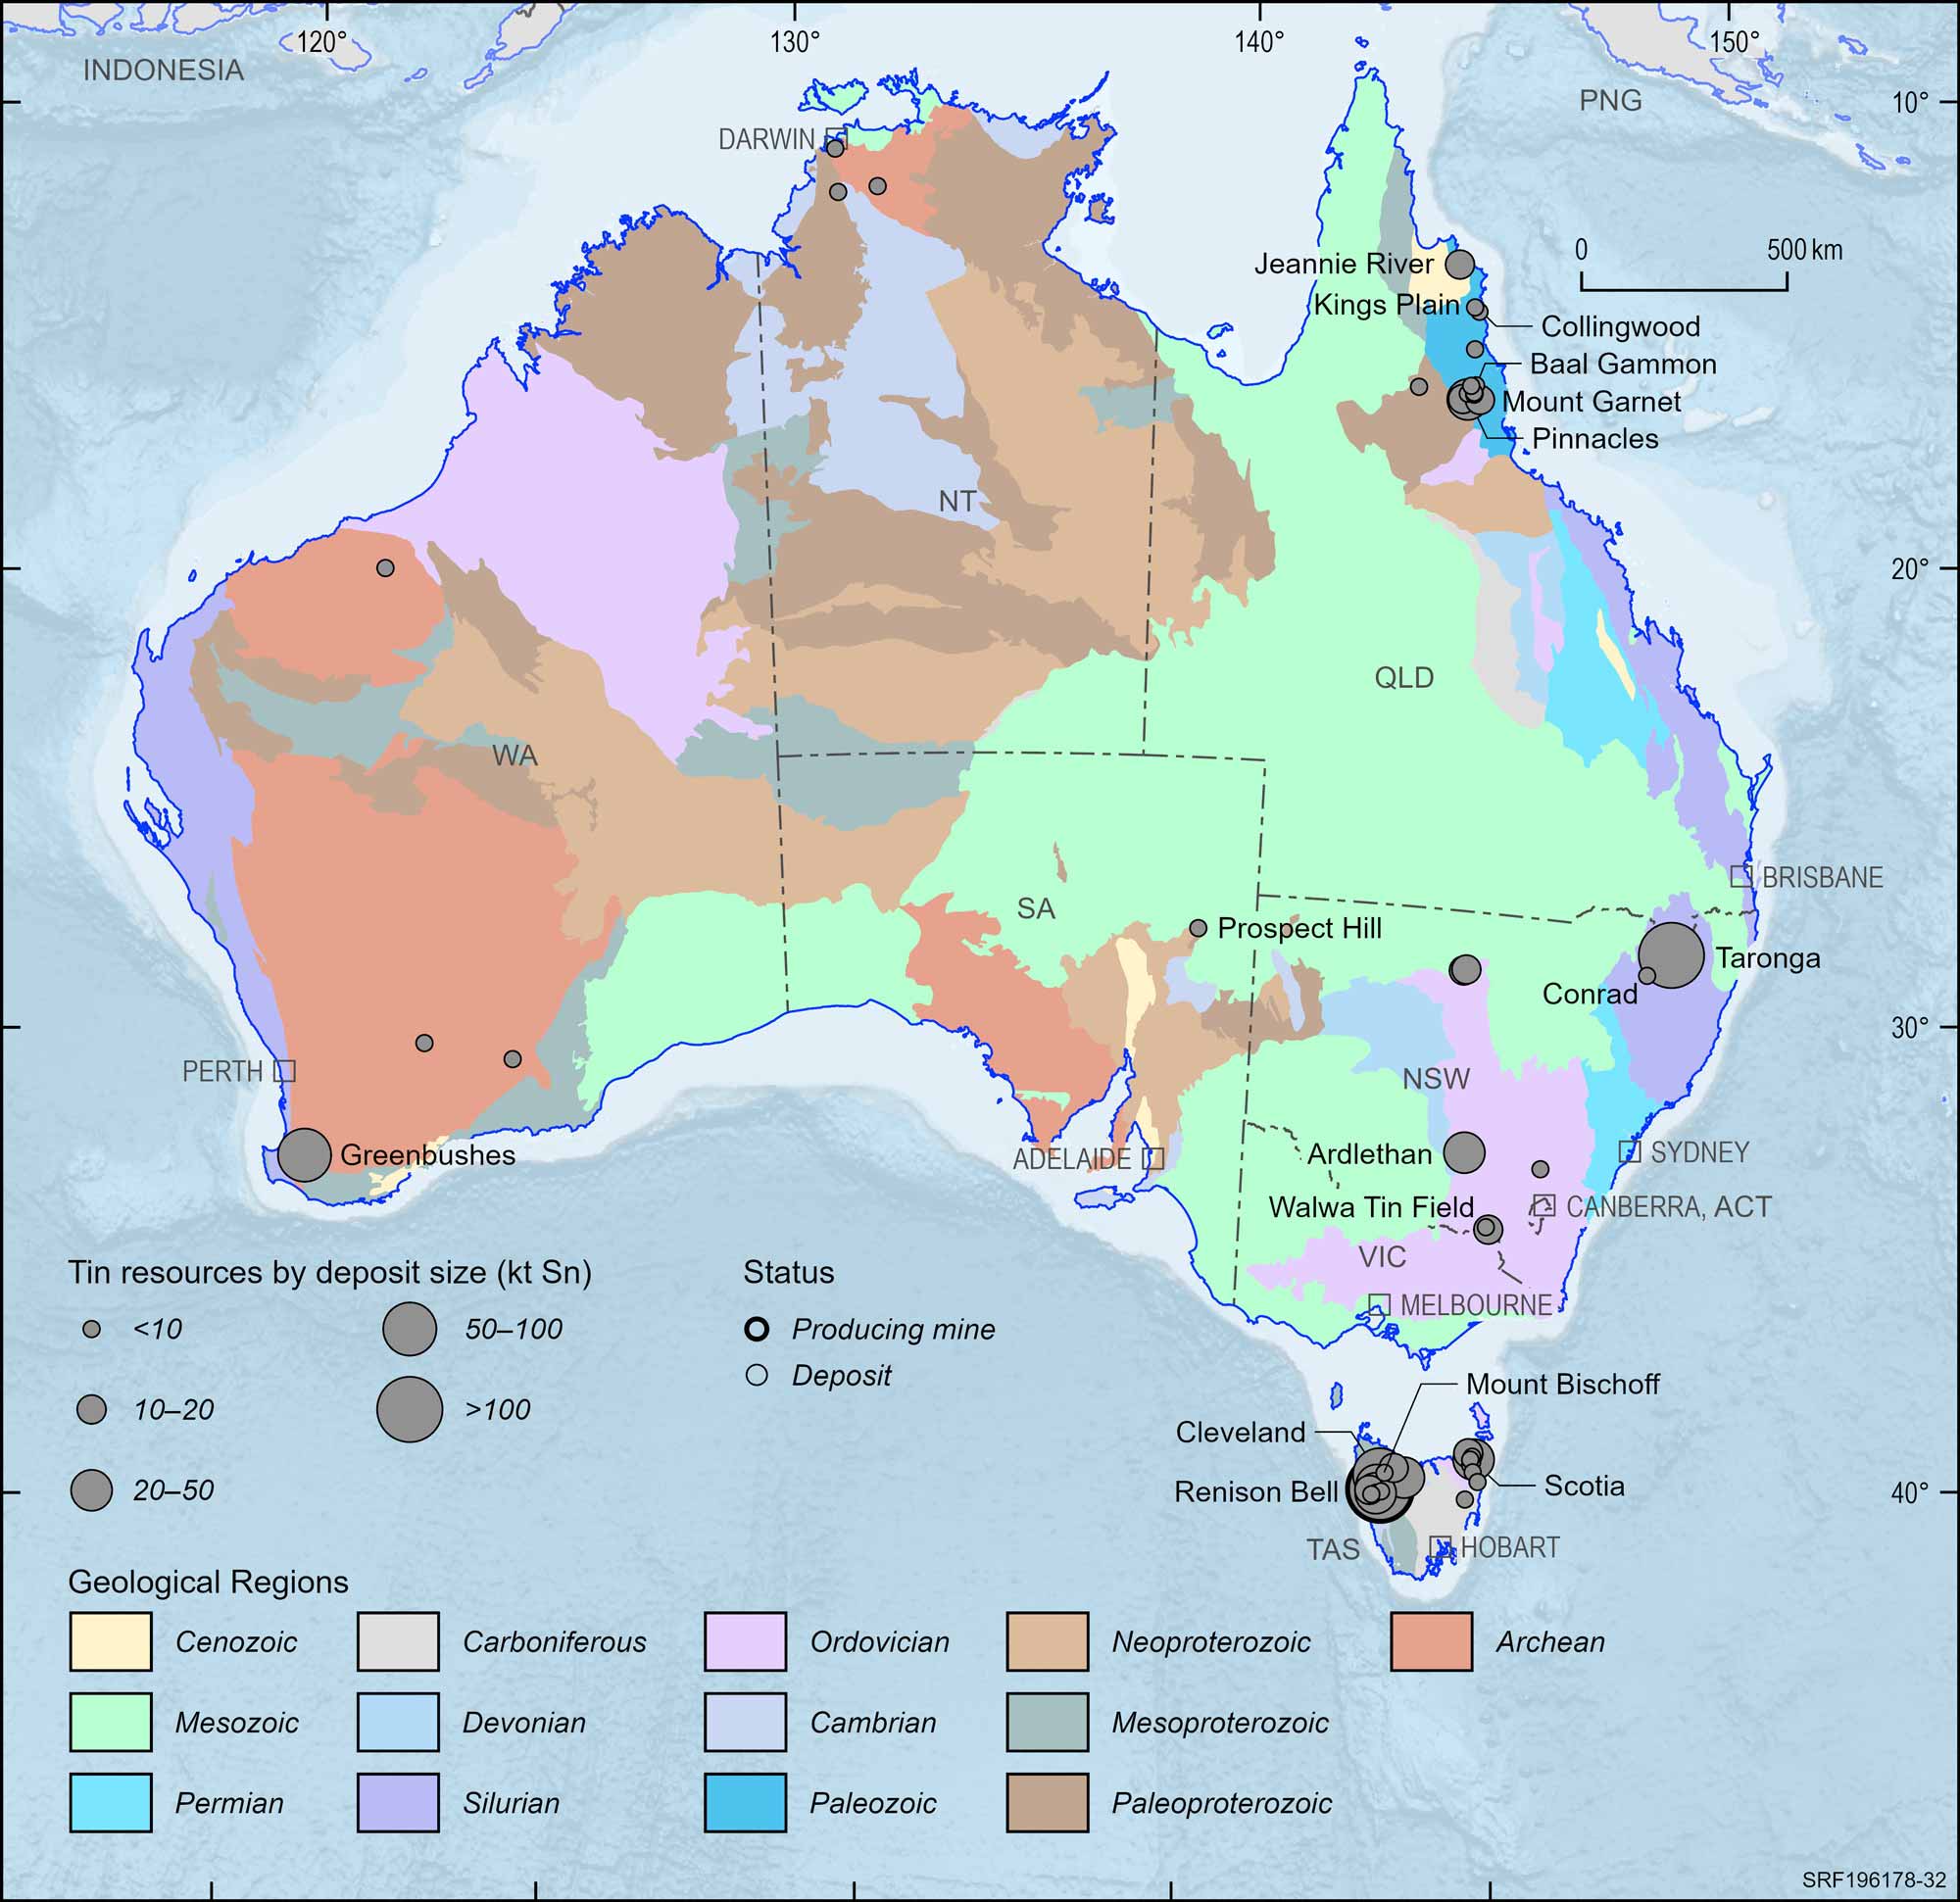
Figure 32. Australian tin deposits and operating mines, 2023.
Deposit size is based on total resources (EDR + Subeconomic Demonstrated Resources + Inferred).
For clarity, only major or significant deposits are labelled.
Tungsten
Critical Mineral
Operating Mines
3
1
EDR
568 kt W
0%
Ore Reserves
220 kt W
3%
Production
0.52 kt W
126%
Export Income
n.a.
0%
World Ranking
Resources
2 (13)
Production
minor
Major Uses:
Cemented carbides used in cutting applications and wear-resistant materials, electrodes, filaments (light bulbs), wires and components in electrical, heating, lighting and the aeronautical industry.
Abbreviations
kt W – kilotonnes of tungsten content; n.a. – not available.
Notes
Resource figures are as at 31 December 2023. Operating mines and production are for calendar year 2023. Percentage increases and decreases and changes in the number of mines are in relation to 2022. World rankings are followed by percentage share in brackets.
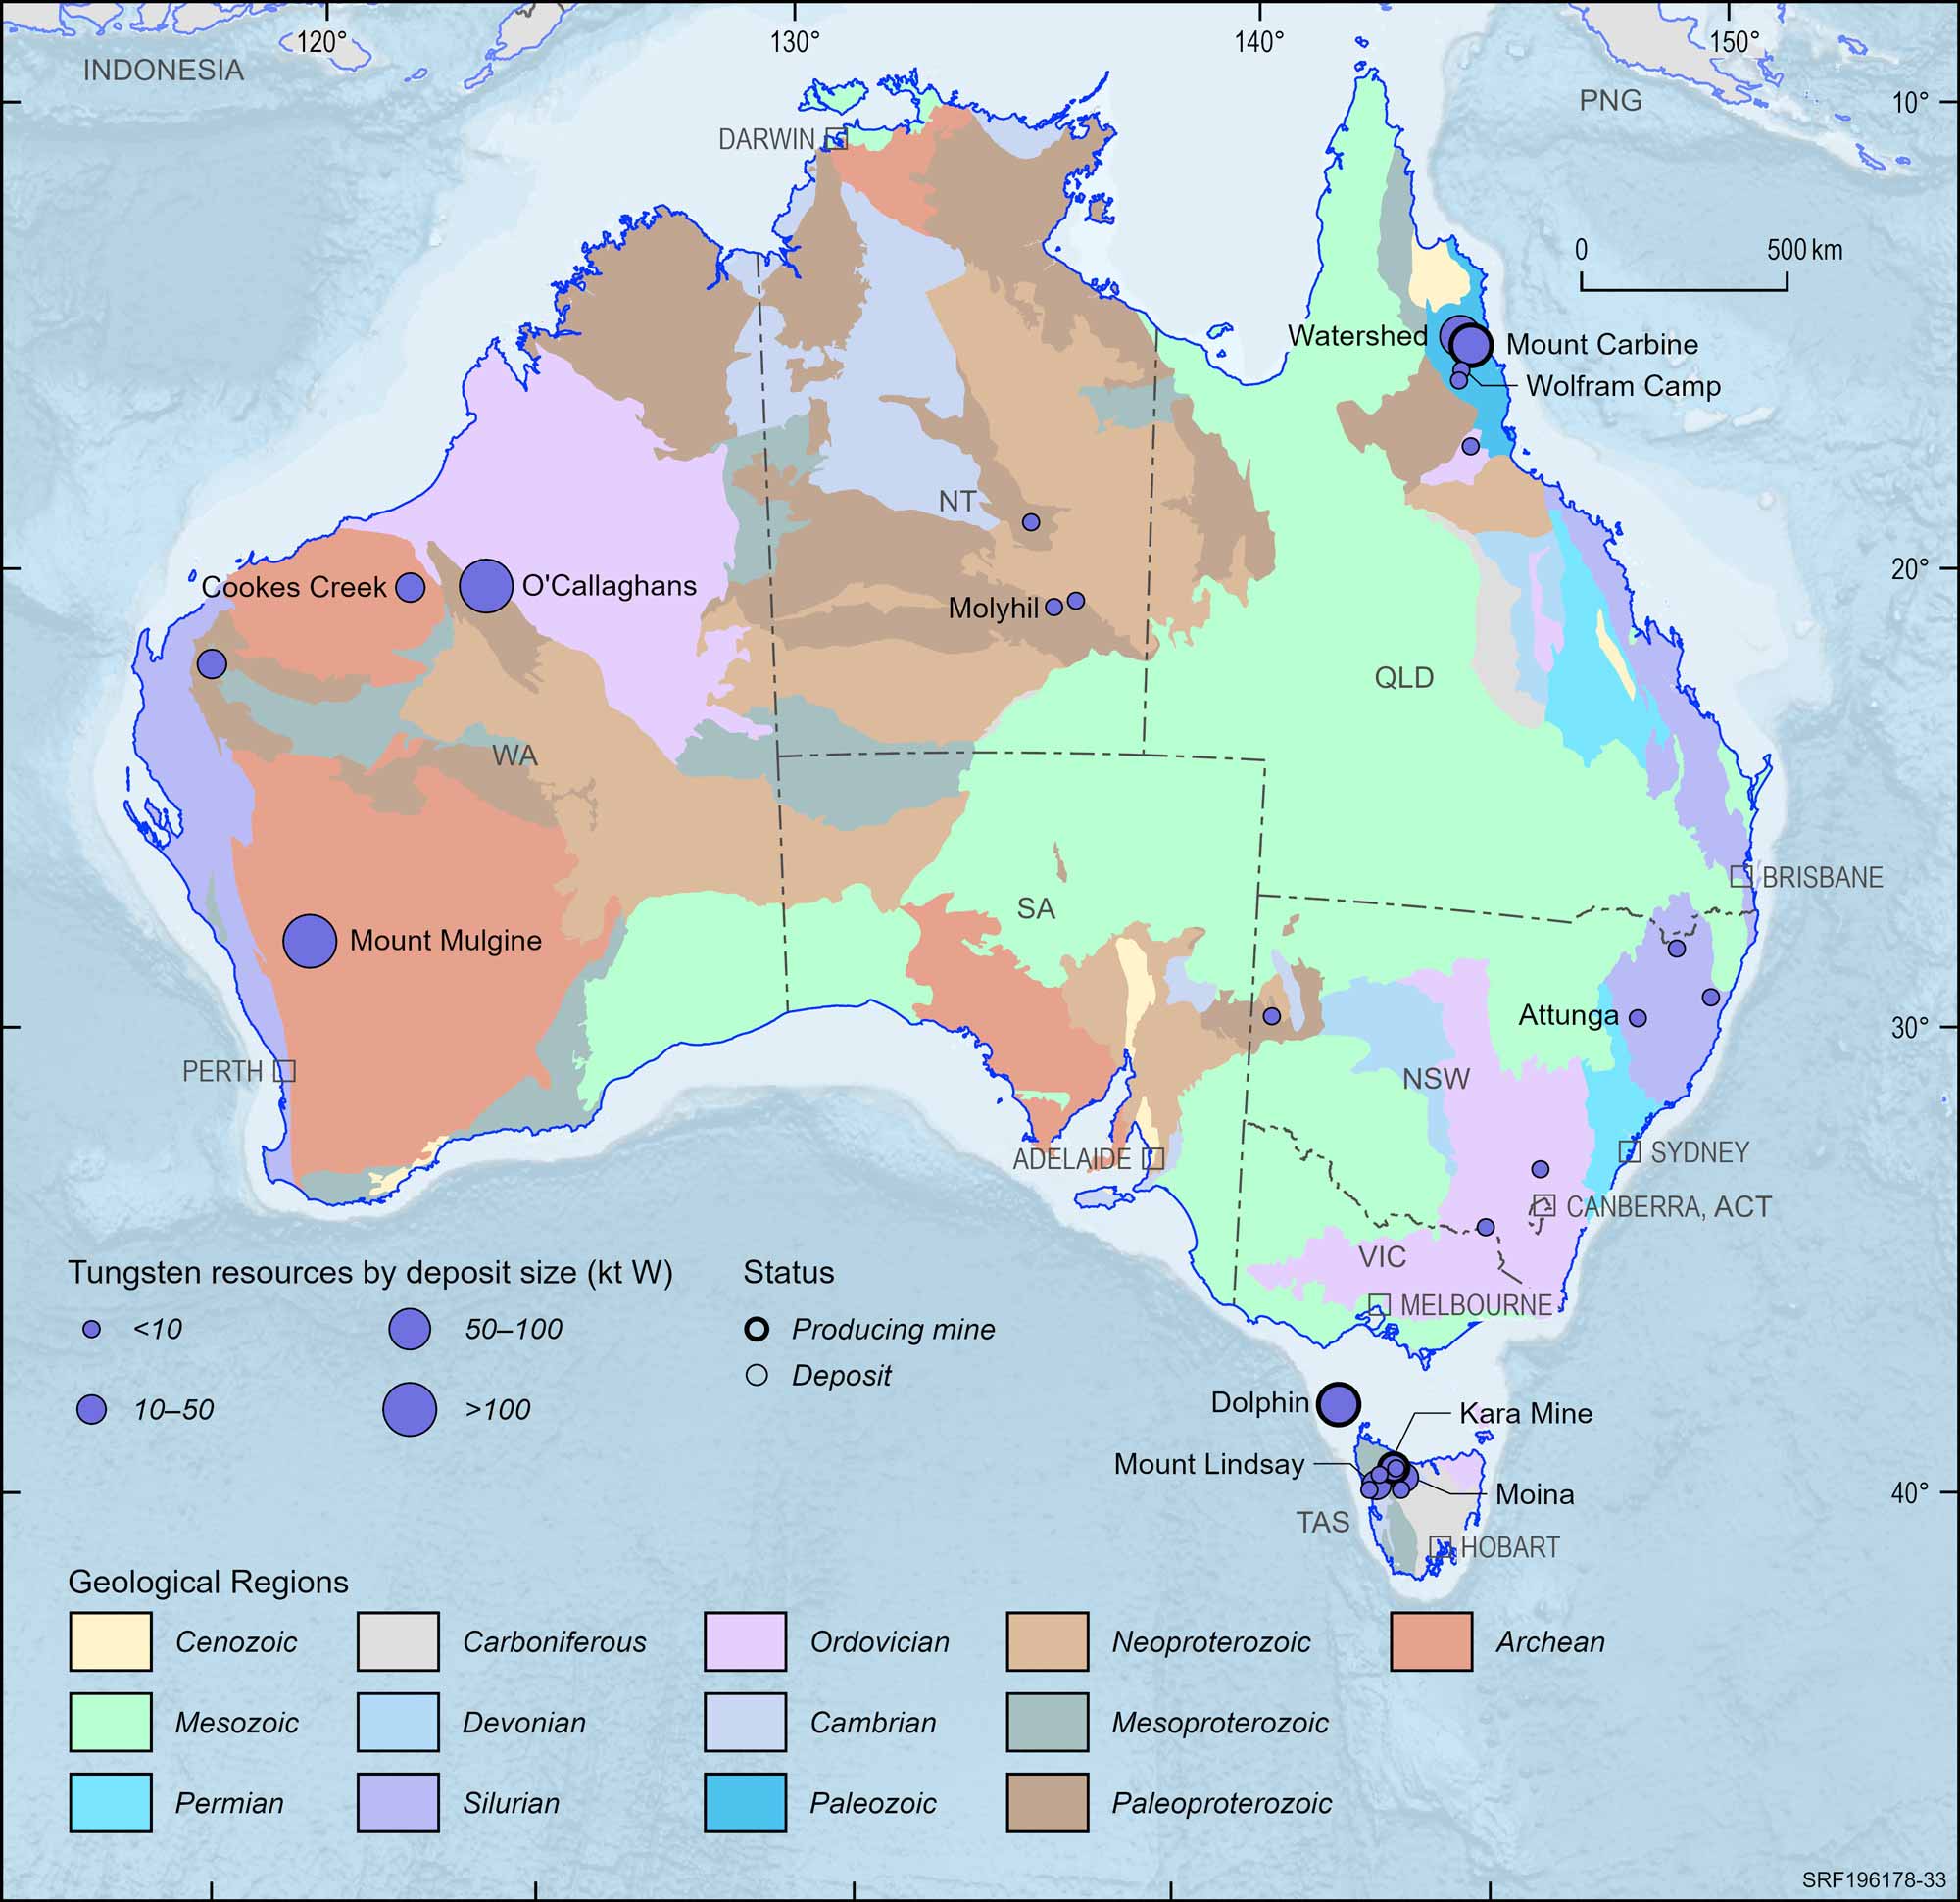
Figure 33. Australian tungsten deposits and operating mines, 2023.
Deposit size is based on total resources (EDR + Subeconomic Demonstrated Resources + Inferred).
For clarity, only major or significant deposits are labelled.
Uranium
Operating Mines
2
n.c.
EDR
1,260 kt U
2%
Ore Reserves
331 kt U
4%
Production
4.686 kt U
3%
Export Income
$911 m
24%
World Ranking
Resources
1 (32%)
Production
4 (9%)
Major Uses:
Fuel for nuclear power reactors, medicine, food-processing, space and defence industry applications.
Abbreviations
kt U – kilotonnes of uranium content; $m – million dollars (Australian); n.c. – no change.
Notes
Resource figures are as at 31 December 2023. Operating mines and production are for calendar year 2023. Percentage increases and decreases and changes in the number of mines are in relation to 2022. World rankings are followed by percentage share in brackets. Export income is based on uranium oxide (U3O8) and sourced from Office of the Chief Economist, Resources and Energy Quarterly, September 2024.
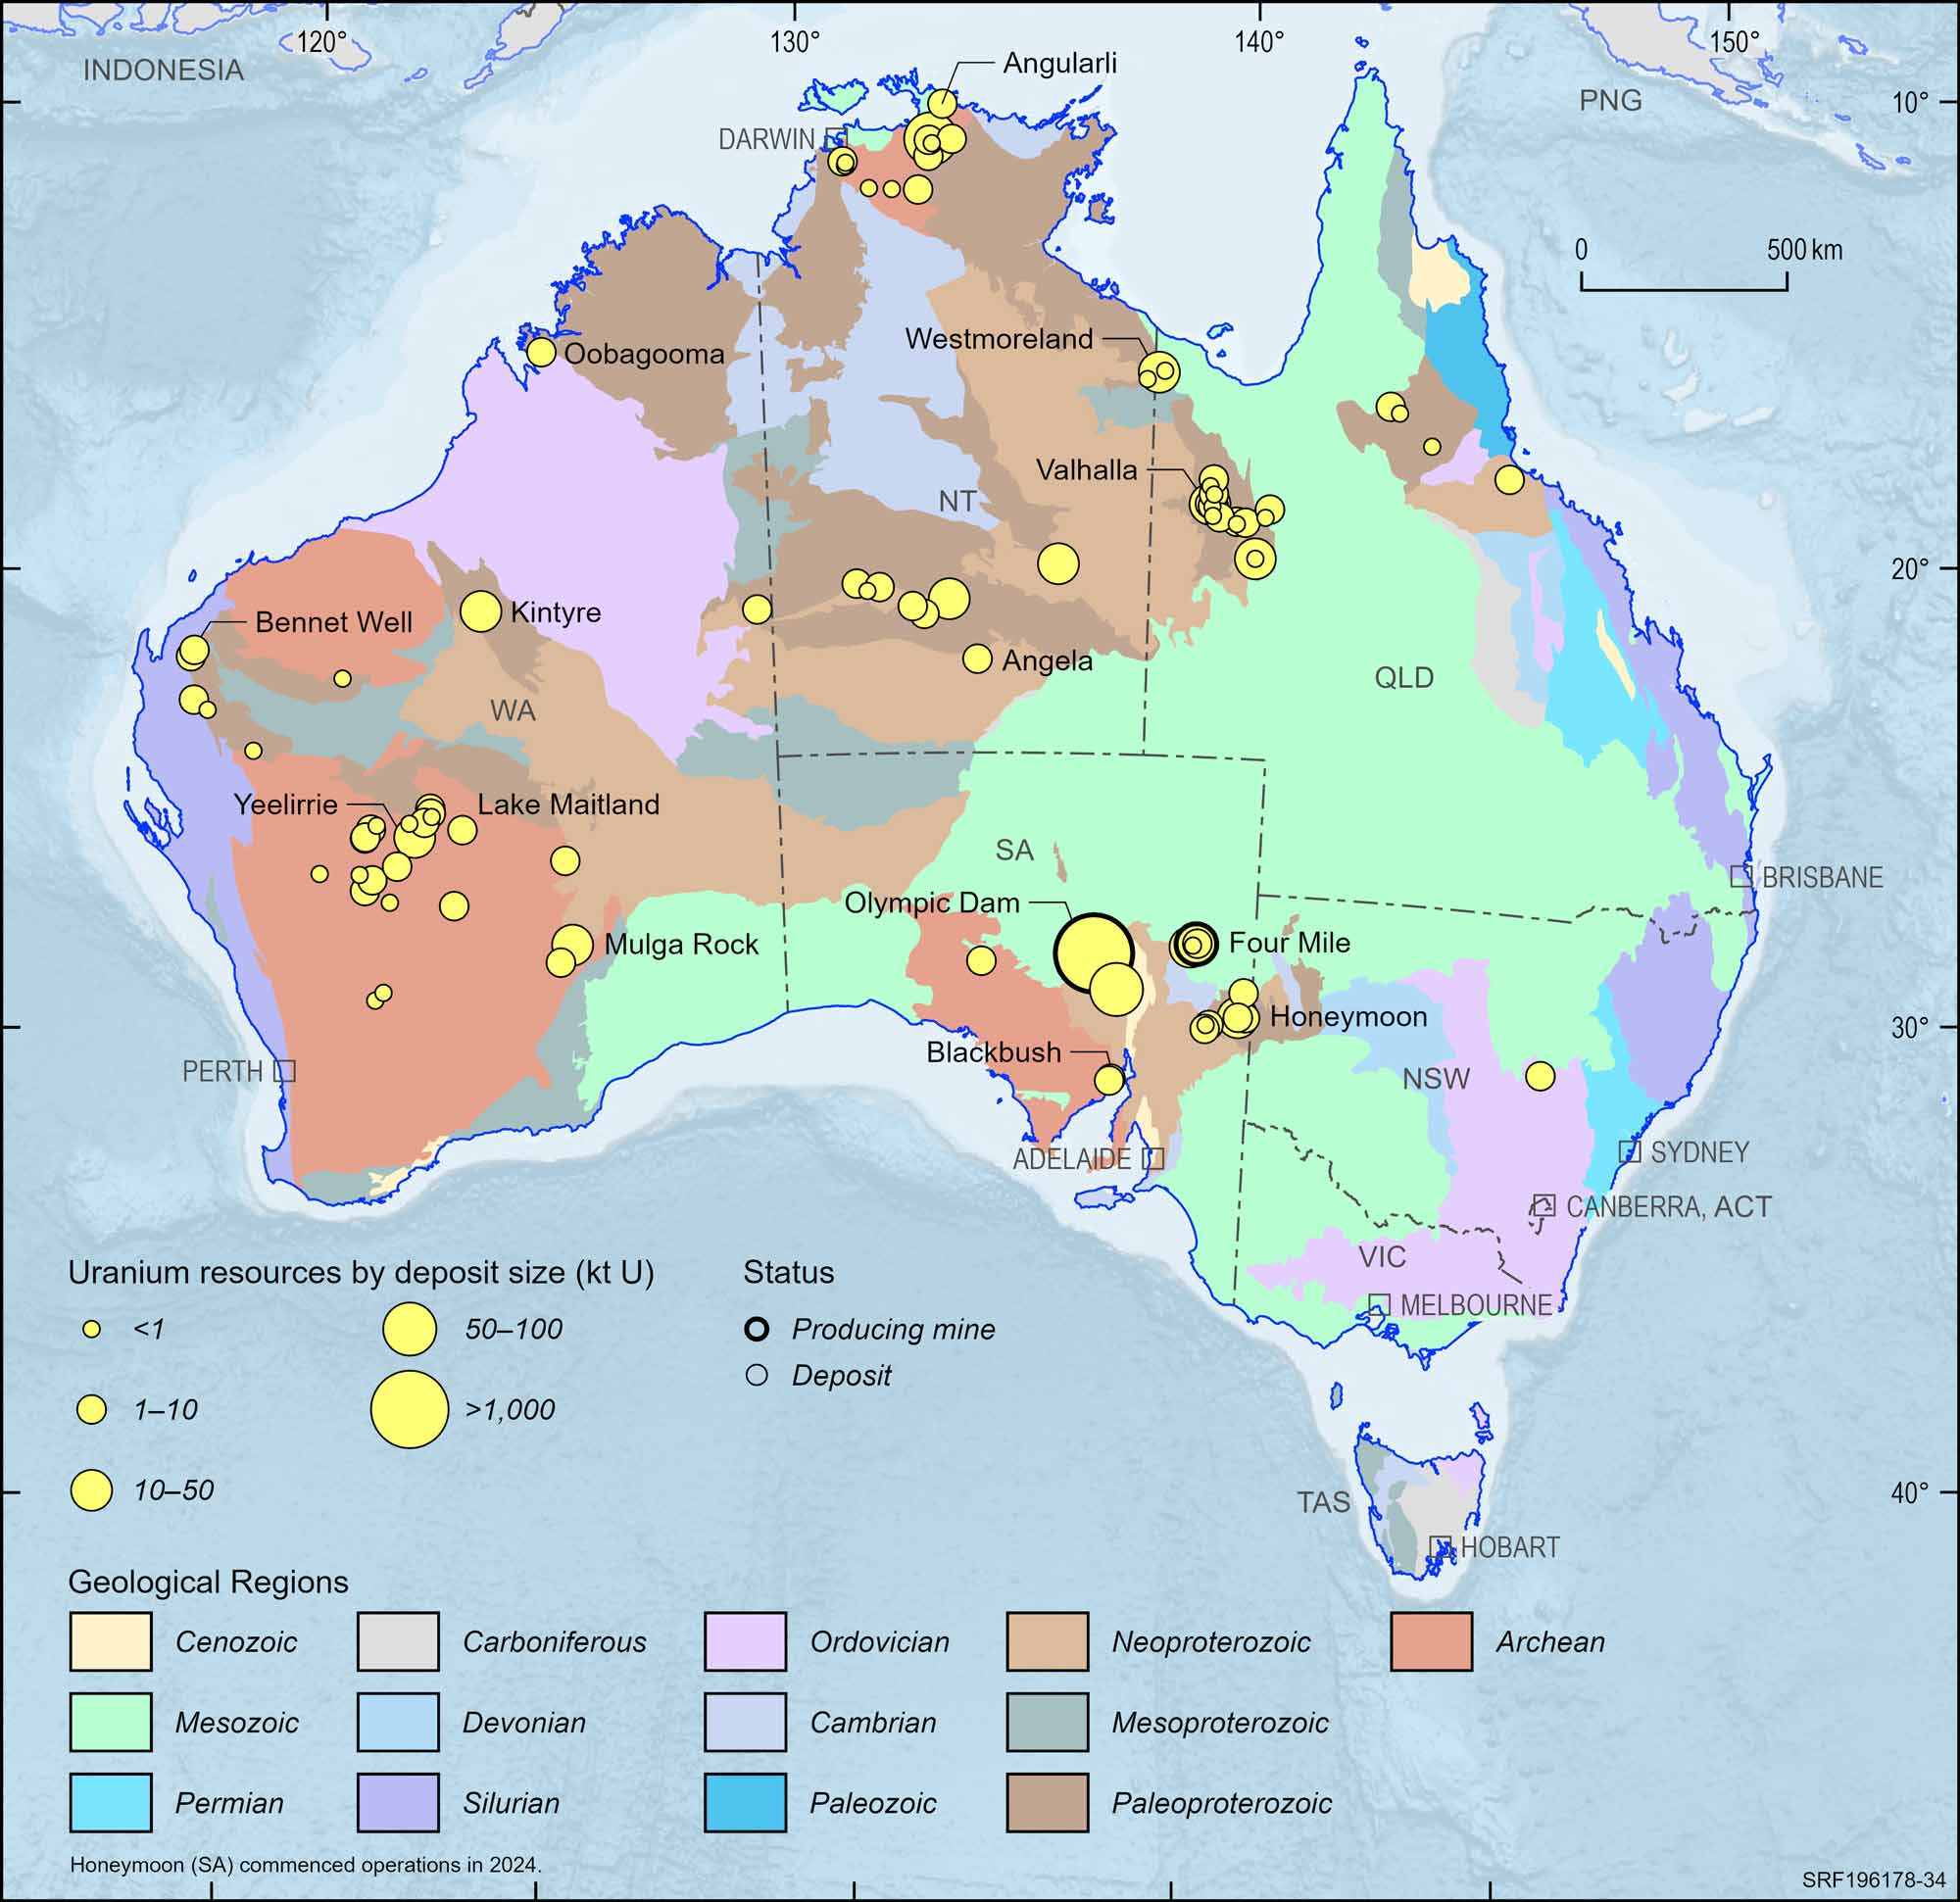
Figure 34. Australian uranium deposits and operating mines, 2023.
Deposit size is based on total resources (EDR + Subeconomic Demonstrated Resources + Inferred).
For clarity, only major or significant deposits are labelled.
Vanadium
Critical Mineral
Operating Mines
0
n.c.
EDR
10,022 kt V
18%
Ore Reserves
2,277 kt V
23%
Production
n.a.
0%
Export Income
n.a.
0%
World Ranking
Resources
1 (49%)
Production
n.a. (0%)
Major Uses:
Alloyed with iron for high-strength steel applications, ceramics, electronics, textiles, fertilisers, synthetic rubber, batteries and alloys used in nuclear engineering and superconductors.
Abbreviations
kt V – kilotonnes of vanadium content; n.a. – not available; n.c. – no change.
Notes
Resource figures are as at 31 December 2023. Operating mines and production are for calendar year 2023. Percentage increases and decreases and changes in the number of mines are in relation to 2022. World rankings are followed by percentage share in brackets.
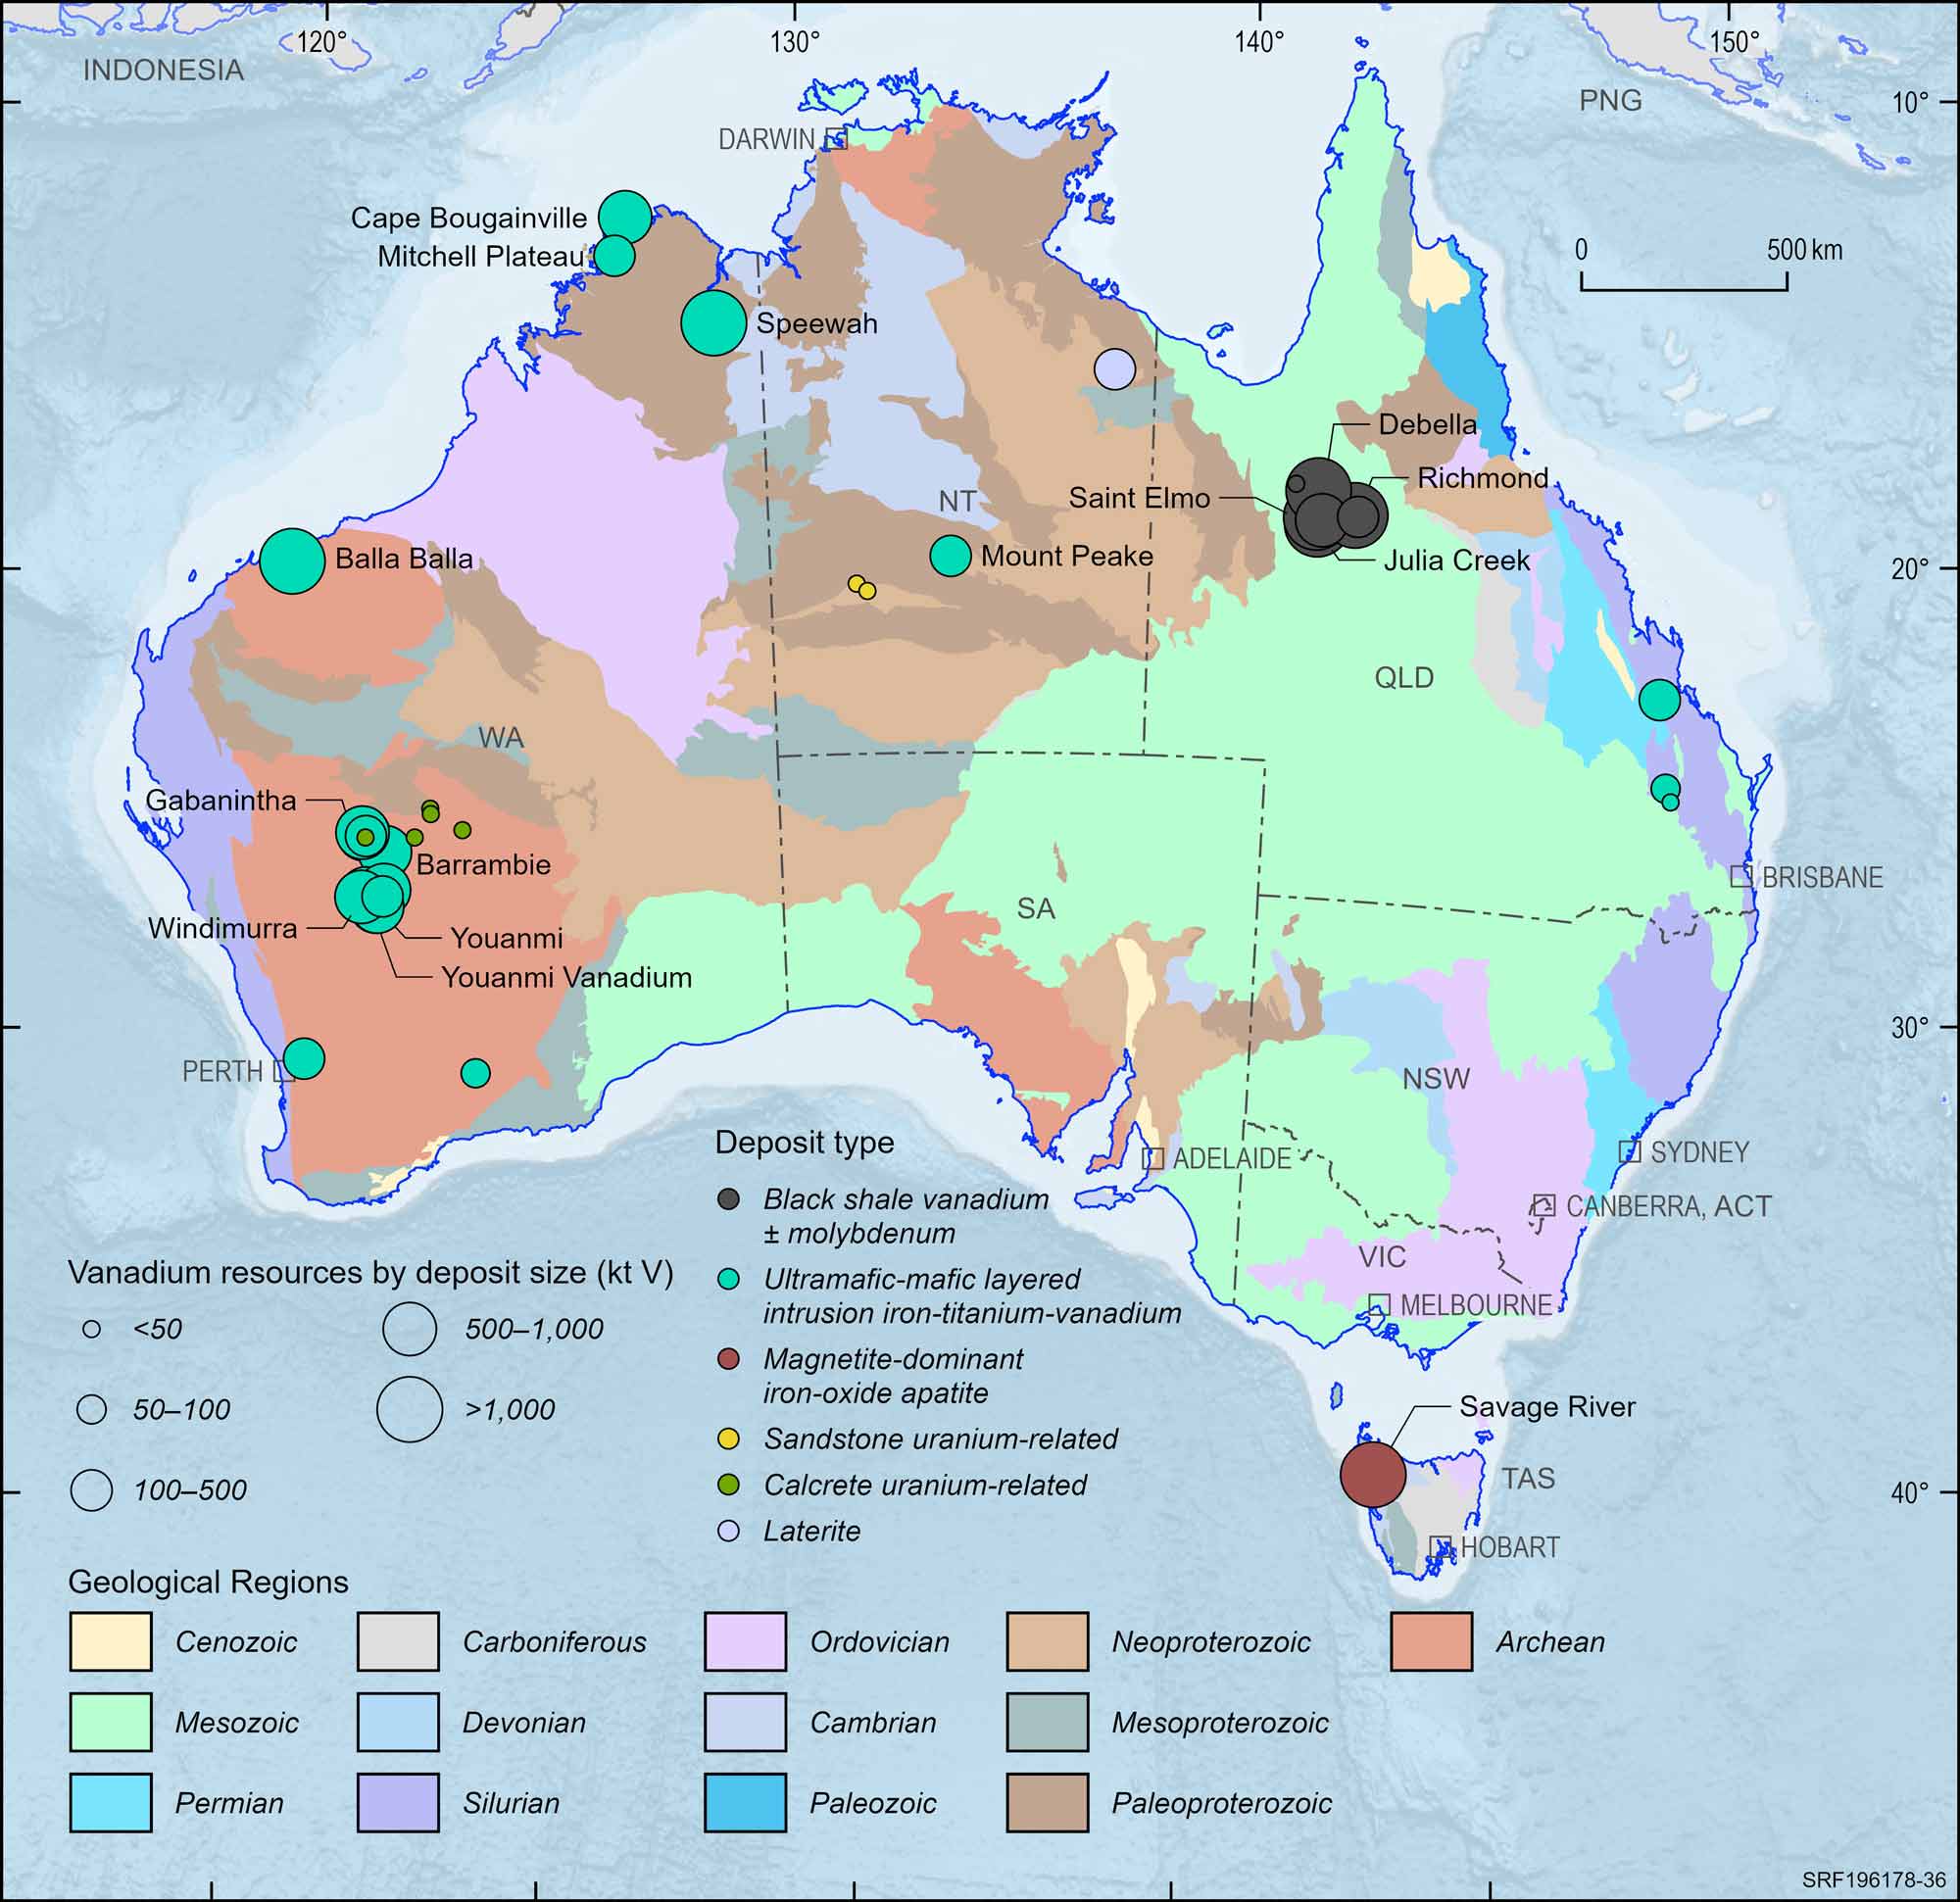
Figure 35. Australian vanadium deposits, 2023.
Deposit size is based on total resources (EDR + Subeconomic Demonstrated Resources + Inferred).
For clarity, only major or significant deposits are labelled.