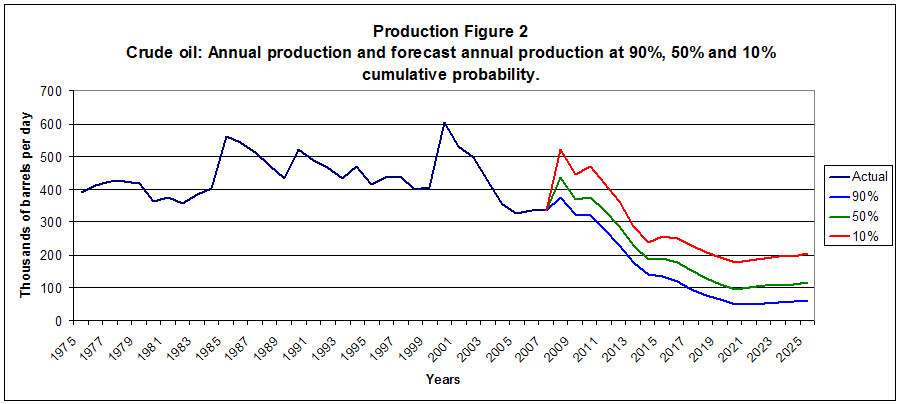
Figure 2: Australia's Annual Production of Crude Oil 1975-2008 and Forecast Annual Production 2009-2025
<Production Figure 1 | Download all tables [XLS1.7MB] | Production Figure 3>

Graph showing annual production and forecast annual production
at 90 per cent 50 per cent and 10 per cent cummulative probability
© Geoscience Australia


