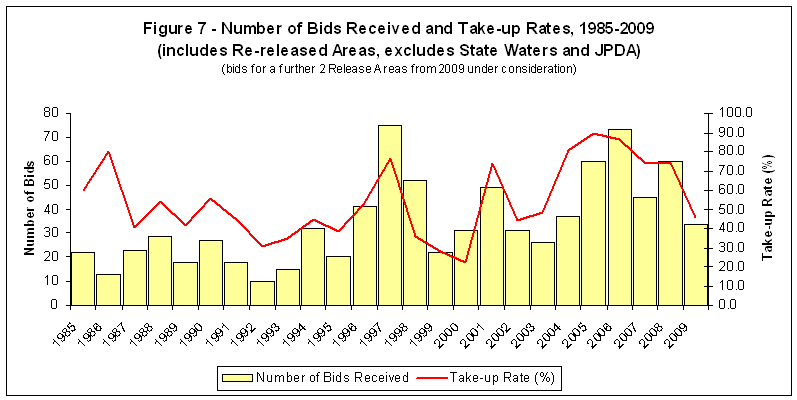
Acreage Release Figure 7 - Number of Bids Received and Take-up Rates 1985-2009 (includes Re-released Areas excludes State Waters and JPDA)
<Acreage Release Figure 6 | Download all tables [XLS 481KB] | OGRA 2009 Index>


Graph showing Acreage Release Figure 7
Number of Bids Received and Take-up Rates, 1985-2009 (includes Re-released Areas, excludes State Waters and JPDA)
Bids for a further 2 Release Areas from 2009 under consideration
© Geoscience Australia


