

Key messages
- Oil is a liquid that forms when accumulations of organic matter are buried and exposed to increasing heat and pressure over geological time.
- Australia has limited identified conventional oil resources and large undiscovered prospective unconventional oil resources.
- Australian oil production has been in long-term decline since 2009 as new reserve developments have failed to match the rate of depletion in existing fields. However, annual oil production has increased since 2019 following the start-up of the Greater Enfield, Ichthys and Prelude projects on the North West Shelf.
- Australia is a net importer of oil and imports a large proportion of its refinery feedstocks. Most of Australia’s oil is currently produced on the North West Shelf, some distance from domestic east coast refining capacity. In addition, domestically produced grades of crude oil are generally not suited for local refineries compared to other internationally sourced oil.
Summary
Australia is a net importer of oil, with only around 17 per cent of refinery feedstock domestically produced in 2020. ‘Oil’ in this report refers to any hydrocarbon liquids, including conventional crude oil, condensate and liquefied petroleum gas (LPG), and unconventional shale oil, oil shales, basin centred oil, coal oil and tight oil.
Oil resources are reported using the SPE-Petroleum Resources Management System. Reserves are commercially recoverable amounts of petroleum that remain in known accumulations, of which 2P reserves are the best estimate (the sum of Proved plus Probable Reserves). Australia’s 2P reserves of conventional oil resources in 2020 are estimated as 9,300 petajoules (PJ; 1,632 million barrels [MMbbl]). At 2020 production rates, this is the equivalent of about 12 years of remaining conventional oil reserves. Nearly 80 per cent of Australia’s produced oil was exported in 2020.
Contingent resources are potentially recoverable amounts of petroleum in known accumulations, of which 2C contingent resources are the best estimate. Contingent resources are not yet considered to be commercially recoverable due to one or more technical, commercial or other factors. Australia’s 2C contingent resources of conventional oil in 2020 are estimated as 12,560 PJ (2,159 MMbbl).
In 2020 around three quarters of all oil production was from fields in offshore north-western Australia. This included condensate resources produced from a few supergiant and giant gas fields in the offshore Northern Carnarvon Basin and the neighbouring Browse Basin. The remaining oil volumes were produced from fields in the Gippsland and the Cooper basins, in south-eastern Australia.
Australia has significant undiscovered unconventional oil resources potential, including shale oil, tight oil, basin centred oil and oil shale. Oil shale is the only unconventional oil resource that has been exploited to date. Currently, there is no commercial production of oil shale resources in Australia.
Australia's identified oil resources
Identified resources are those that have been discovered and their locations, quantity and quality are known from measurements or direct geological evidence. Identified oil resources, for the purposes of this report, are the equivalent of discovered 2P reserves and 2C contingent resources in the SPE-Petroleum Resources Management System.
The 2020 resource estimates compiled for this report are based on publicly available data for onshore areas aggregated with confidential offshore data submitted to the National Offshore Petroleum Titles Administrator (NOPTA). Offshore data are reported for the 2020 calendar year, while onshore data are based on government statistics and company estimates reported at various dates between June 2020 and June 2021. Data are aggregated for composite basin regions where necessary to de-identify confidential offshore field data in the custody of NOPTA.
The majority of the remaining identified offshore oil resources occur in basins from either north‑west or south‑east Australia. Onshore, the Cooper–Eromanga basin in South Australia and Queensland holds the greatest quantity of identified remaining conventional oil resources (Figure 1 and Figure 2; Table 1, Table 2 and Table 3).
Crude oil
Australia’s domestic supply of crude oil is limited, with estimated remaining 2P reserves of 1,761 PJ (299 MMbbl), and 3,444 PJ (578 MMbbl) of 2C contingent resources in 2020 (Table 1; Figure 1 and Figure 2). Aggregating Australia’s 2P reserves and 2C contingent resources gives a total of 5,205 PJ (878 MMbbl) of identified crude oil resources. Over half of Australia’s remaining identified crude oil resources are in the Northern Carnarvon and Roebuck basins. About one fifth of Australia’s crude oil reserves are in the Cooper Basin, while approximately 15 per cent of remaining contingent resources are in the Gippsland Basin. Based on 2020 production rates of 300 PJ (51 MMbbl), Australia’s identified crude oil resources would have a life of 17 years if all identified contingencies to development are mitigated.
Condensate
Australia has significant remaining condensate resources, including 6,788 PJ (1,154 MMbbl) of 2P reserves and 8,660 PJ (1,473 MMbbl) of 2C contingent resources in 2020 (Table 2; Figure 1 and Figure 2). Aggregating Australia’s 2P reserves and 2C contingent resources gives a total of 15,448 PJ (2,627 MMbbl) of identified condensate resources. The majority of identified condensate resources are in supergiant and giant gas fields along the North West Shelf. Based on 2020 production rates of 439 PJ (75 MMbbl), Australia’s identified condensate resources would have a life of 35 years if all identified contingencies to development are mitigated.
LPG
Australia’s LPG resources in 2020 are estimated to include 751 PJ (178 MMbbl) of 2P reserves and 456 PJ (108 MMbbl) of 2C contingent resources (Table 3). However, those estimates do not include any identified LPG resources for the Northern Carnarvon Basin due to the lack of reported LPG reserves or contingent resources for this basin area in the offshore NOPTA data. Aggregating Australia’s 2P reserves and 2C contingent resources gives a total of 1,207 PJ (287 MMbbl) of identified LPG resources. Based on 2020 production rates of 47 PJ (11 MMbbl), Australia’s identified LPG resources would have a life of 26 years if all identified contingencies to development are mitigated.
Unconventional petroleum
Australia has significant potential for unconventional liquid petroleum resources hosted in oil shales, and shale oil and tight oil accumulations. Oil shale contains immature kerogen and requires mining and retorting to produce oil. Oil shale exploration has a long history, with sporadic small-scale production dating back to the 19th century (Dyni, 2006). Large volumes of contingent resources are contained in unconventional oil shale accumulations, estimated at 84,436 PJ (14,360 MMbbl; Table 5, Figure 3, Figure 4). Other contingent unconventional oil resources are currently limited to a small quantity (404 PJ, 71 MMbbl) of condensate and LPG associated with basin centred gas and tight gas accumulations in the Canning and Cooper/Eromanga Basins (Table 4).
Shale oil is liquid oil that can be extracted from shales using drilling and hydraulic fracturing. Coal oil is oil or condensate that is generated within coalbeds and then retained as a self-sourced reservoir system (USGS, 2016). Tight oil is hosted in low porosity and/or permeability reservoirs and also requires hydraulic stimulation for production. There are currently no identified contingent shale oil, coal oil or tight oil resources in Australia.
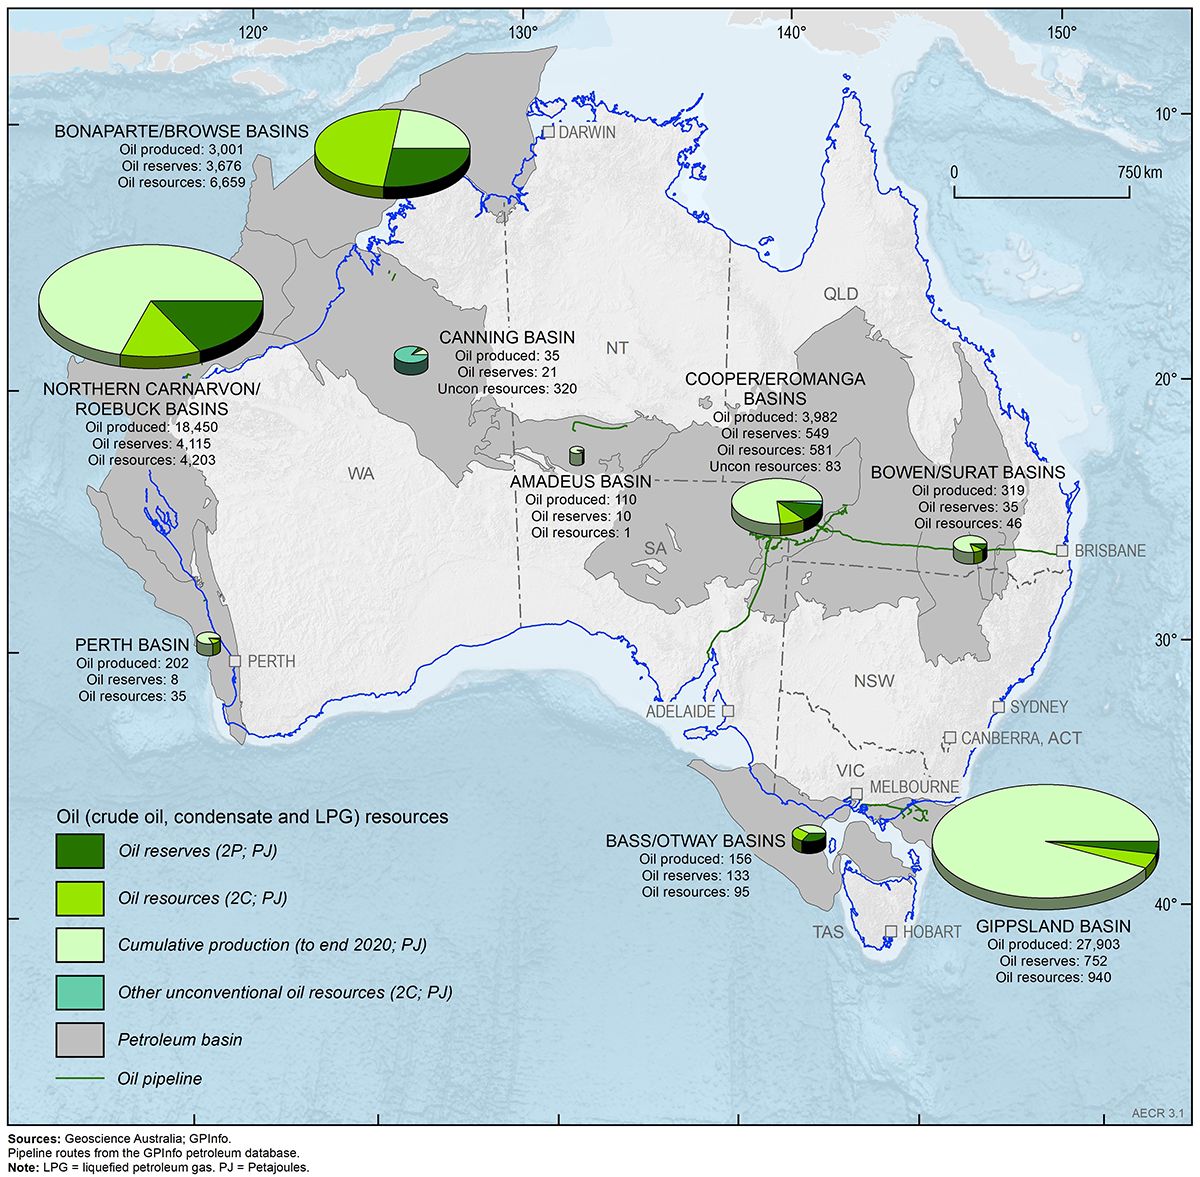
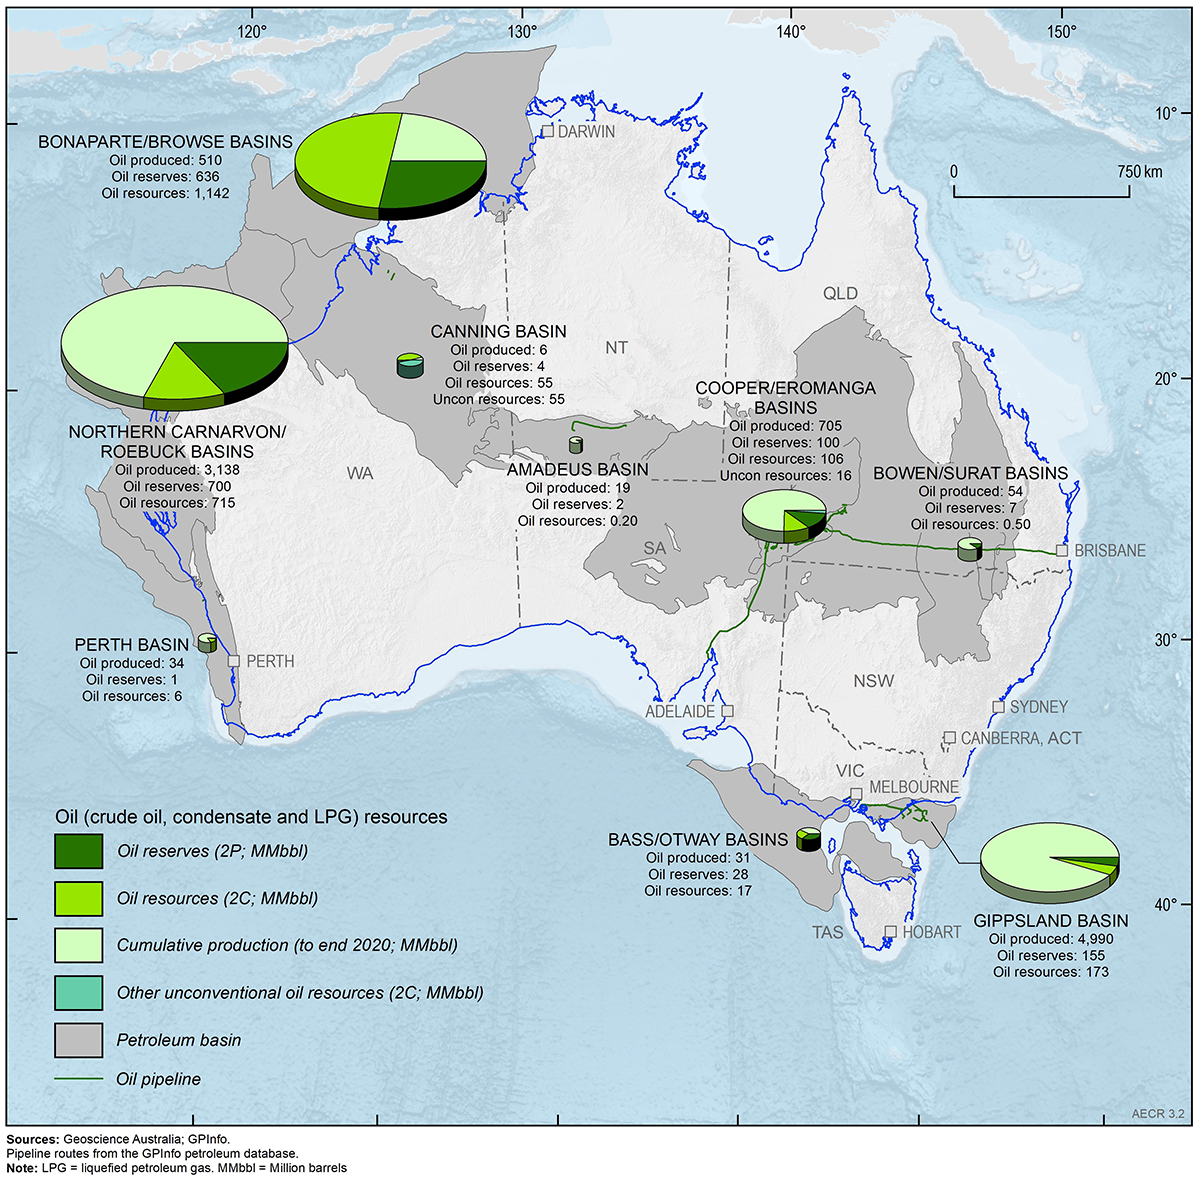
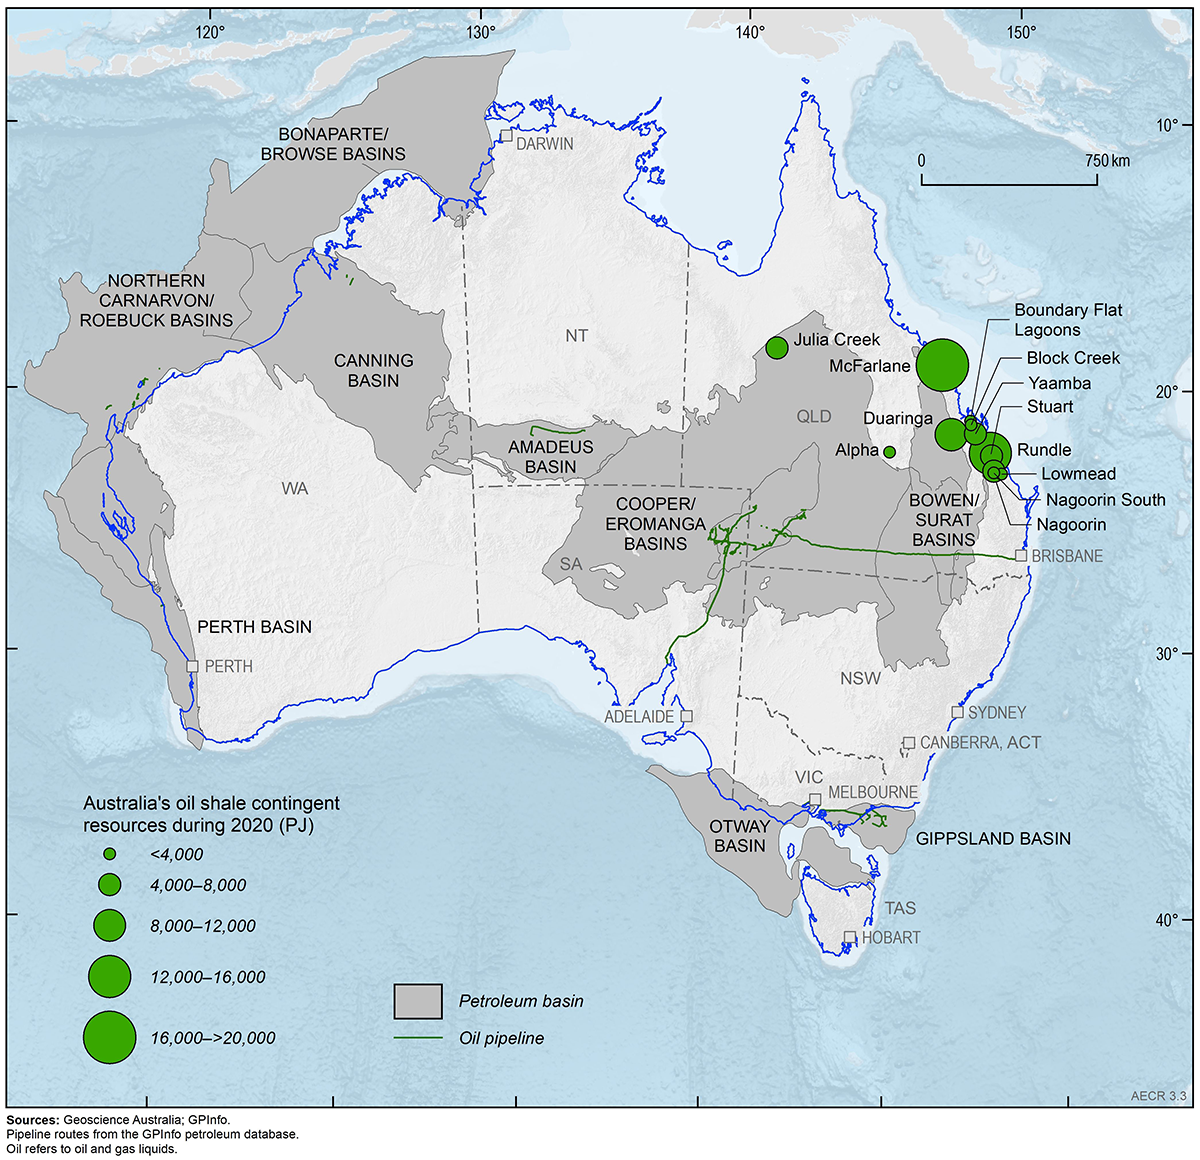
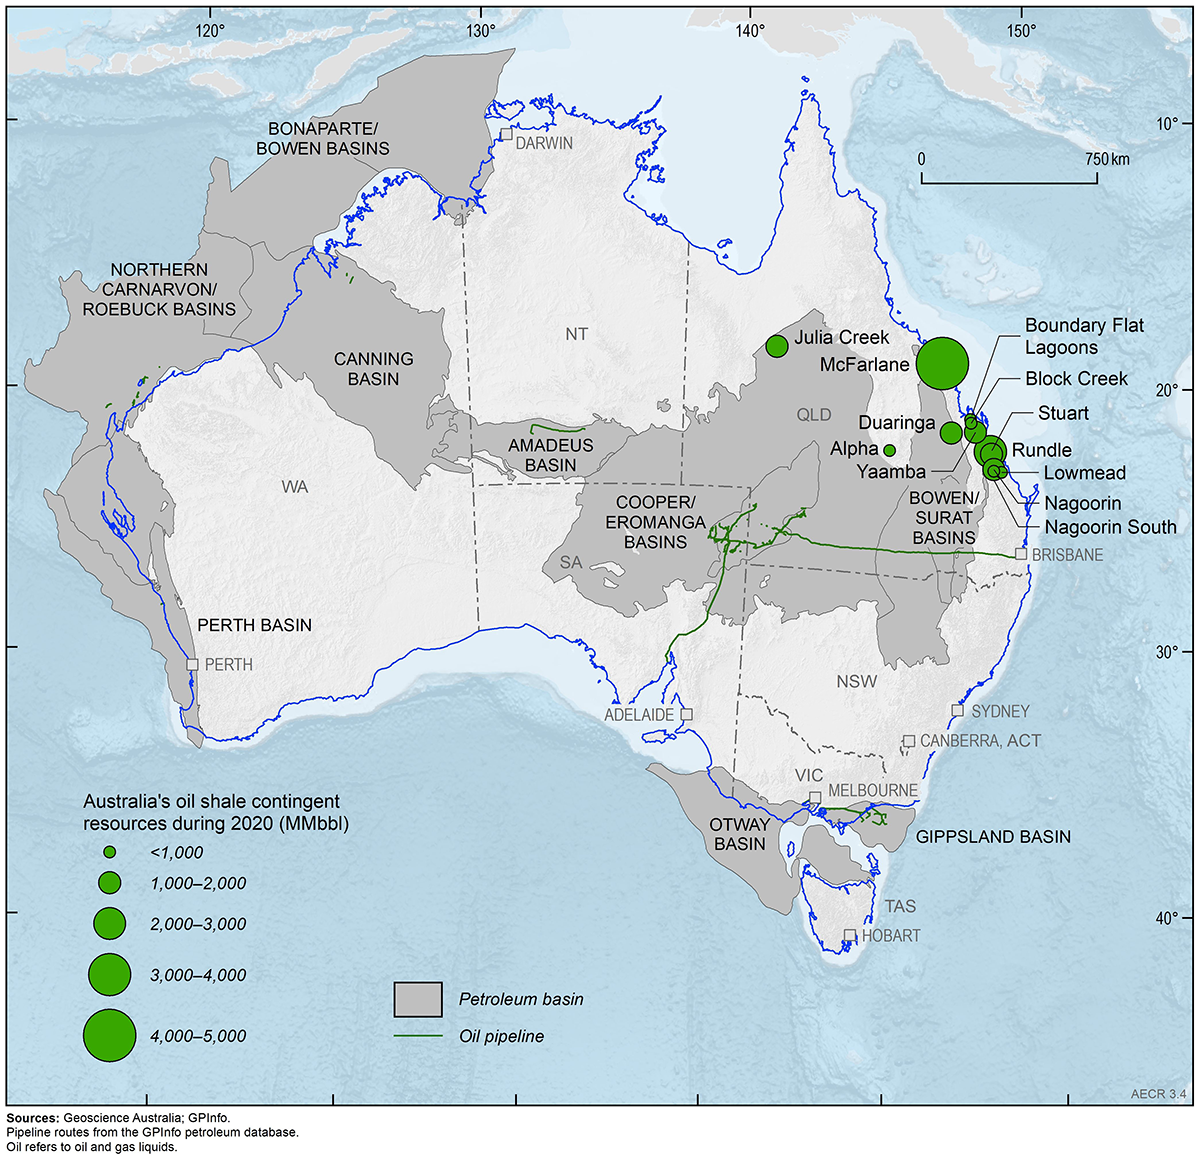
Table 1. Australia's remaining crude oil reserves (2P), contingent resources (2C) and annual production during 2020, and cumulative production to end 2020 (MMbbl)
| Basin | Crude oil (PJ) | Crude oil (MMbbl) | ||||||
|---|---|---|---|---|---|---|---|---|
| Annual Production | Cumulative production | Reserves (2P) | Resources (2C) | Annual Production | Cumulative production | Reserves (2P) | Resources (2C) | |
| Amadeus | 1 | 110 | 10 | 1 | 0.2 | 18.7 | 1.8 | 0.2 |
| Bass/Otway | 0 | 0 | 0 | 40 | 0 | 0 | 0 | 6.7 |
| Bonaparte/Browse | 19 | 2,682 | 189 | 549 | 3.3 | 456.2 | 32.1 | 93.3 |
| Bowen/Surat | 1 | 199 | 11 | 46 | 0.1 | 33.9 | 1.9 | 0.5 |
| Canning | 2 | 35 | 21 | 0 | 0.4 | 5.9 | 3.6 | 0 |
| Northern Carnarvon/Roebuck | 166 | 11,888 | 1,105 | 1,907 | 28.2 | 2,021.7 | 187.9 | 324.3 |
| Cooper/Eromanga | 71 | 2,366 | 363 | 354 | 12.1 | 402.6 | 61.7 | 60.2 |
| Gippsland | 39 | 22,636 | 53 | 512 | 6.6 | 3,849.6 | 9.1 | 87.1 |
| Perth | 1 | 195 | 8 | 35 | 0.2 | 33.2 | 1.4 | 6.0 |
| Total | 300 | 40,111 | 1,761 | 3,444 | 51.0 | 6,821.8 | 299.5 | 578.4 |
Notes: PJ= Petajoules. Data from the former Joint Petroleum Development Area (JPDA) have been omitted from Bonaparte Basin totals. Data sources: Offshore data provided by NOPTA to year-end 2020, except Browse-Bonaparte and Perth Basins which are sourced from company reports; onshore data are sourced from company reports and Australian and state government reporting.
Table 2. Australia's remaining condensate reserves (2P), contingent resources (2C) and annual production during 2020, and cumulative production to end 2020 (MMbbl)
| Basin | Condensate (PJ) | Condensate (MMbbl) | ||||||
|---|---|---|---|---|---|---|---|---|
| Annual Production | Cumulative production | Reserves (2P) | Resources (2C) | Annual Production | Cumulative production | Reserves (2P) | Resources (2C) | |
| Amadeus | 0 | 0 | 0 | 0 | 0 | 0 | 0 | 0 |
| Bass/Otway | 4 | 96 | 59 | 36 | 0.70 | 16.4 | 10.0 | 6.1 |
| Bonaparte/Browse | 148 | 319 | 3,319 | 5,973 | 25.23 | 54.2 | 564.4 | 1,015.8 |
| Bowen/Surat | 0 | 51 | 9 | 0 | 0 | 8.6 | 1.5 | 0 |
| Canning | 0 | <0.1 | 0 | 0 | 0 | <0.001 | 0 | 0 |
| Northern Carnarvon/Roebuck | 265 | 6,562 | 3,010 | 2,296 | 45.12 | 1,116.0 | 511.9 | 390.6 |
| Cooper/Eromanga | 6 | 715 | 94 | 123 | 1.04 | 121.7 | 16.0 | 21.0 |
| Gippsland | 15 | 1,647 | 298 | 231 | 2.50 | 280.1 | 50.6 | 39.4 |
| Perth | 0 | 6 | 0 | 0 | 0 | 1.1 | 0 | 0 |
| Total | 439 | 9,396 | 6,788 | 8,660 | 74.6 | 1,598.0 | 1,154.4 | 1,472.8 |
Notes: PJ= Petajoules. Data from the former Joint Petroleum Development Area (JPDA) have been omitted from Bonaparte Basin totals. Data sources: Offshore data provided by NOPTA to year-end 2020, except Browse-Bonaparte and Perth Basins which are sourced from company reports; onshore data are sourced from company reports and Australian and state government reporting.
Table 3. Australia's remaining LPG reserves (2P), contingent resources (2C) and annual production during 2020, and cumulative production to end 2020 (MMbbl)
| Basin | LPG (PJ) | LPG (MMbbl) | ||||||
|---|---|---|---|---|---|---|---|---|
| Annual Production | Cumulative production | Reserves (2P) | Resources (2C) | Annual Production | Cumulative production | Reserves (2P) | Resources (2C) | |
| Amadeus | 0 | 0 | 0 | 0 | 0 | 0 | 0 | 0 |
| Bass/Otway | 0 | 60 | 75 | 19 | 0 | 14.3 | 17.7 | 4.5 |
| Bonaparte/Browse | 0 | 0 | 168 | 137 | 0 | 0 | 40.0 | 32.6 |
| Bowen/Surat | 0.2 | 69 | 15 | 0 | 0.0 | 11.8 | 3.6 | 0 |
| Canning | 0 | 0 | 0 | 0 | 0 | 0 | 0 | 0 |
| Northern Carnarvon/Roebuck | No data | No data | 0 | 0 | No data | No data | 0 | 0 |
| Cooper/Eromanga | 14 | 901 | 92 | 104 | 3.2 | 180.6 | 21.9 | 24.6 |
| Gippsland | 33 | 3,620 | 401 | 196 | 7.8 | 859.8 | 95.3 | 46.5 |
| Perth | 0 | 0 | 0 | 0 | 0 | 0 | 0 | 0 |
| Total | 47 | 4,650 | 751 | 456 | 11.1 | 1,066.5 | 178.5 | 108.2 |
Notes: PJ= Petajoules. Data from the former Joint Petroleum Development Area (JPDA) have been omitted from Bonaparte Basin totals. Data sources: Offshore data provided by NOPTA to year-end 2020, except Browse-Bonaparte and Perth Basins which are sourced from company reports; onshore data are sourced from company reports and Australian and state government reporting.
Table 4. Australia's unconventional contingent oil resources (2C) during 2020
| Basin / deposit | Type | Oil | Condensate | LPG | Oil | Condensate | LPG | Data Source |
|---|---|---|---|---|---|---|---|---|
| 2C Resources (PJ) | 2C Resources (PJ) | 2C Resources (PJ) | 2C Resources (MMbbl) | 2C Resources (MMbbl) | 2C Resources (MMbbl) | |||
| Canning Basin |
Basin centred gas; tight gas | 0 | 320 | 0 | 0 | 54.5 | 0 |
Buru Energy (2018) Black Mountain (2021) |
| Cooper/Eromanga | Undifferentiated | 0 | 53 | 30 | 0 | 9.0 | 7.2 | Beach Energy (2021) |
| Total | 0 | 373 | 30 | 0 | 63.5 | 7.2 |
Notes: PJ = Petajoules; MMbbl = Million barrels
Table 5. Australia's oil shale contingent resources (2C) during 2020
| Type | Basin / deposit | Oil | Data Source | |
|---|---|---|---|---|
| 2C Resources (PJ) | 2C Resources (MMbbl) | |||
| Oil Shale | Alpha deposit | 58 | 10 | Geoscience Australia (AERA 2018) |
| Block Creek deposit | 1,355 | 230 | Geoscience Australia (AERA 2018) | |
| Boundary Flat Lagoons deposit | 1,535 | 261 | Geoscience Australia (AERA 2018) | |
| Duaringa deposit | 8,485 | 1,443 | Geoscience Australia (AERA 2018) | |
| Julia Creek deposits (aggregated) | 6,023 | 1,024 | Geoscience Australia (AERA 2018) | |
| Lowmead deposit | 1,253 | 213 | Geoscience Australia (AERA 2018) | |
| McFarlane deposit | 28,745 | 4,889 | Geoscience Australia (AERA 2018) | |
| Nagoorin deposit | 6,305 | 1,072 | Geoscience Australia (AERA 2018) | |
| Nagoorin South deposit | 415 | 71 | Geoscience Australia (AERA 2018) | |
| Rundle deposit | 15,533 | 2,642 | Geoscience Australia (AERA 2018) | |
| Stuart deposit | 7,711 | 1,311 | Geoscience Australia (AERA 2018) | |
| Yaamba deposit | 7,018 | 1,194 | Geoscience Australia (AERA 2018) | |
| Total | 84,436 | 14,360 | ||
Notes: PJ = Petajoules; MMbbl = Million barrels
Recent oil resource updates
The Bedout Sub-basin (Roebuck Basin) continues to be one of the most actively explored regions for new oil resources following the Dorado discovery in 2018. In March 2022, Santos and Carnarvon Energy announced a significant new oil discovery in the Bedout Sub-basin following the drilling of Pavo 1, which has a gross 2C contingent resource assessed at 43 MMbbl of oil (Santos, 2022). The oil discovery at Pavo 1 occurs in the same high quality Caley Member reservoir interval as Dorado and offers a potential low-cost tie-back to the proposed Dorado facility. Additional oil resources may also occur in a separate southern culmination of the greater Pavo structure. The contingent resource for Pavo 1 is outside of the reporting period for AECR 2022 and is therefore not included in the reserves and resources compilation.
Australia's prospective oil resources
Undiscovered resources can be assessed and classified using the SPE-Petroleum Resources Management System (PRMS). These are defined as Prospective Resources as they estimate potentially recoverable quantities of hydrocarbons from undiscovered accumulations, referred to as prospects, assuming that a discovery is made and developed. Individual prospects are defined by a range of possible resource outcomes and also carry both a geological risk of discovering oil and gas, as well as a risk of developing any resources in the event of a discovery. Estimating prospective resources at a prospect level is therefore subject to a range of uncertainty of the potentially recoverable quantities of hydrocarbons. The PRMS provides requirements for determining low, best and high case estimates of prospective resources. However, the methodologies used to assess prospective resources varies across basins, reservoir types, trap types and available sources of data. As such, each reporting entity has the flexibility to calculate resource estimates based on internal best practices.
Prospective resource estimates therefore need to be evaluated in the context of the assessment areas for which they have been generated, the resource type assessed (conventional or unconventional), the assumptions and methodologies used in the assessments, and with an understanding of the risk associated with these resources being realised. For example, the Apus prospect in WA-437-P (Roebuck Basin) had gross mean recoverable resource estimates of 235 MMbbl of oil and 408 Bcf of gas prior to drilling. However, after the drilling of the Apus-1 well in April 2022, it was subsequently found to contain no commercial oil or gas resources (Carnarvon Energy, 2022a and 2022b). The implications of such ‘well failures’ for related exploration targets and prospective resource estimates need to be subsequently evaluated through post-drill analysis to determine if the failure occurred due to local prospect factors such as trap integrity, or more regional factors such as lack of hydrocarbon charge.
Due to their risk and uncertain nature, only a limited set of prospective resource estimates are published each year by petroleum exploration companies and other reporting entities. Consequently, it is not possible to provide an accurate aggregation of all prospective oil resources in Australia using published prospective resource estimates. A bibliography of all published prospective resource estimates for the 2020 reporting year accessed by Geoscience Australia is provided at the end of this chapter to assist accessing available prospective resource data in each hydrocarbon-bearing basin.
Developing basin scale prospective resource estimates requires a ‘play-based’ regional assessment to calculate the ‘yet to find’ resource potential through evaluating both the chance of success for all potential ‘plays’ (reservoir-seal intervals that host oil and gas accumulations) and the potential prospect size. Geoscience Australia has recently commenced a series of play-based resource assessments for the Pedirka, Simpson, Cooper, Eromanga, Adavale, Galilee and northern Bowen basins under the Exploring For The Future Program and the Trusted Environmental and Geological Information Program. Results from these Geoscience Australia play-based prospective resource assessments will be provided in future editions of AECR.
Production
Australia’s oil production in 2020 totalled 785 PJ (137 MMbbl; Table 6). Nearly two thirds of Australia’s extracted oil in 2020 was condensate and LPG resources associated with producing gas fields.
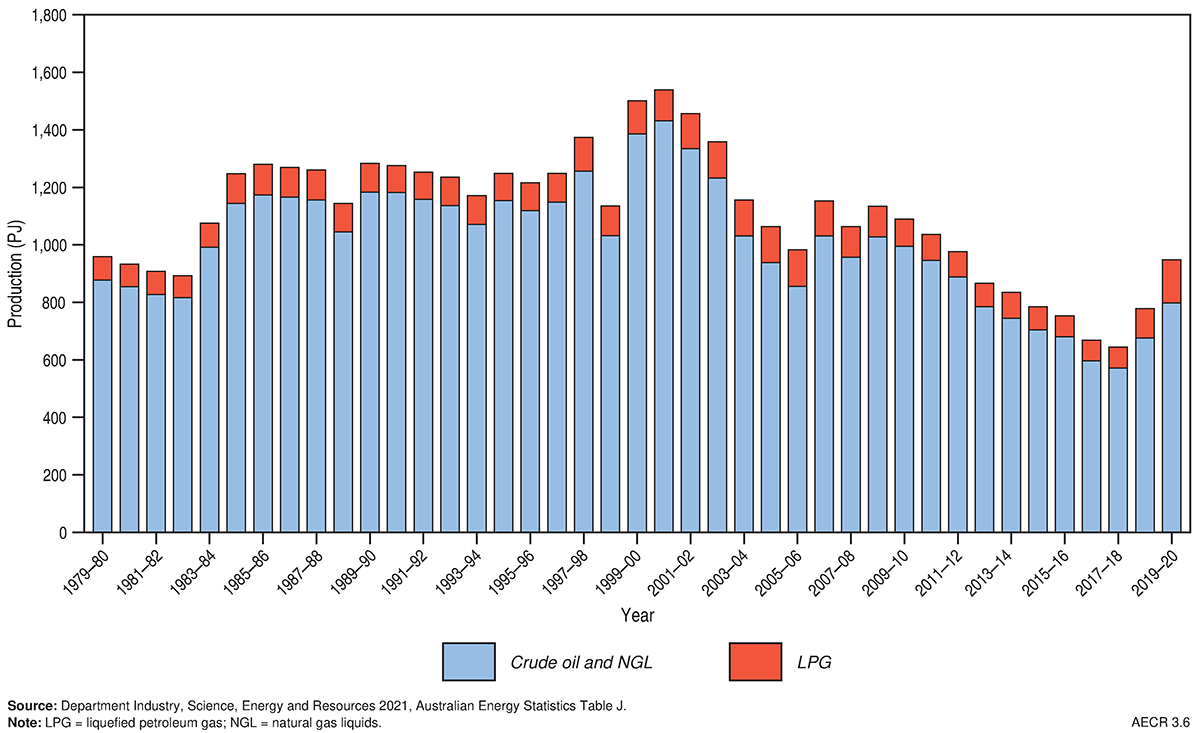
Trends in oil production are captured by the Australian Government’s energy production statistics in Australian Energy Statistics (Department of Industry, Science, Energy and Resources, 2021a). Since 2009 the combined production of crude oil and condensate in Australia has shown a trend of longer-term decline. In 2017–18, Australia produced only 572 PJ (15.5 billion litres) of crude oil and condensate, which represented a 4 per cent fall in production relative to the previous year (Department of the Environment and Energy, 2019). However, in 2018–19 this decline reversed, and crude oil and condensate production has continued to increase, and in 2019–20 it increased by 18 per cent to 798 PJ (Figure 5); Department of Industry, Science, Energy and Resources, 2021a). This increase in production was driven by the recently opened projects on the North West Shelf, mainly from the Ichthys field in the Browse Basin (Department of Industry, Science, Energy and Resources, 2021b). LPG production also grew by 48 per cent to 151 PJ in 2019–20, as a result of a full year of production from the Ichthys gas field. Australia’s overall increase in oil production was the fifth highest in the world during 2020 (bp, 2021).
Table 6. Key statistics for crude oil, condensate and LPG
| Unit | Australia 2020 | OECD 2020 | World 2020 | |
|---|---|---|---|---|
| Resources | ||||
| Proved reserves (at end of year) | PJ | na | 1,599,000b | 10,654,260b |
| Bbbl | na | 260.0b | 1,732.4b | |
| Proved plus Probable reserves (at end of year) | PJ | 9,300a | na | na |
| Bbbl | 1.6a | na | na | |
| of which: crude oil | Bbbl | 0.3a | na | na |
| of which: condensate | Bbbl | 1.2a | na | na |
| of which: LPG | Bbbl | 0.2a | na | na |
| CAGR from 2010 | % | na | 0.9b | 0.6b |
| Production | ||||
| Annual production | PJ | 786a | 63,339b | 198,416b |
| MMbbl | 137a | 10,299b | 32,263b | |
| of which: crude oil | MMbbl | 51a | na | na |
| of which: condensate | MMbbl | 75a | na | na |
| of which: LPG | MMbbl | 11a | 2,383b | 4,273b |
| CAGR from 2010 | % | –1.6b | 3.8b | 0.6b |
| Share of world oil production | % | 0.5b | 31.9b | 100b |
| World ranking | no. | 29b | na | na |
| Exports | ||||
| Oil | PJ | 626c | na | 94,674b |
| Oil export value | A$b | 9.0c | na | na |
| Petroleum products | PJ | 184d | na | 49,176b |
| Petroleum products export value | A$b | 3.7c | na | na |
| Imports | ||||
| Oil | PJ | 696d | na | 94,674b |
| Oil import value | A$b | 9.7c | na | na |
| Petroleum products | PJ | 1,349d | na | 49,176b |
| Petroleum products import value | A$b | 22.7c | na | na |
Notes: BP oil reserves data are proved reserves while Geoscience Australia data are Proved and Probable (2P) reserves. Reserves and production include condensate, natural gas liquids (NGLs) as well as crude oil. Oil exports and imports include crude oil and condensate. Petroleum products include refined products, LPG and bunker fuel. BP data and Geoscience data are as at the end of 2020. Department of Industry, Science, Energy and Resources data (2021 a, b) are from the 2019-20 financial year. OECD = Organisation for Economic Co-operation and Development countries. na = not available. LPG = liquefied petroleum gas. CAGR = compound annual growth rate. MMbbl = million barrels. PJ = petajoules. A$b = billion Australian dollars. Source: aGeoscience Australia; bBP (2021) BP Statistical Review of World Energy; cDepartment of Industry, Science, Energy and Resources (2021a and b) Resources and Energy Quarterly, December 2021 (Tables 1, 2 and 4); dDepartment of Industry, Science, Energy and Resources (2021a) Australian energy statistics (Table A2).
Trade
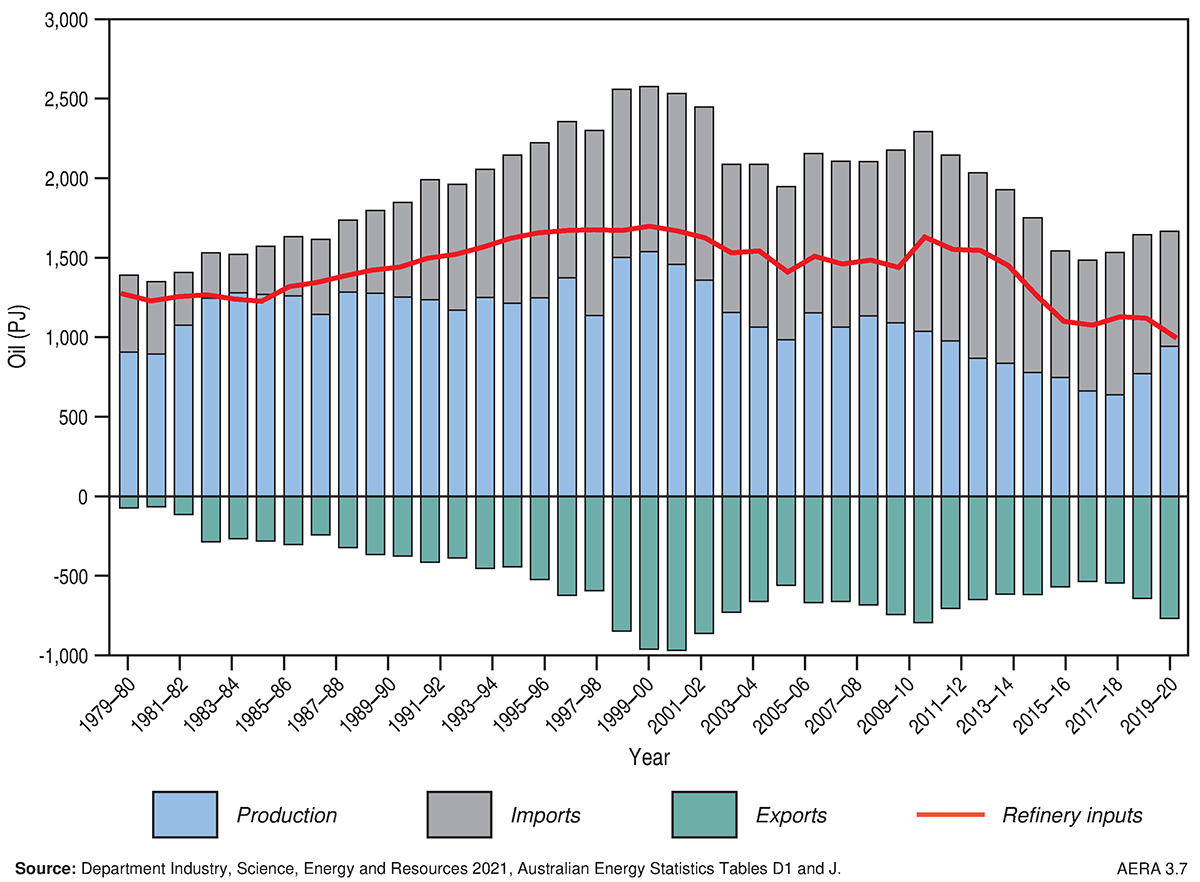
Since the mid-1980's Australia has been a net importer of refined oil products, as well as crude oil and other refinery feedstocks (Figure 6). However, Australia also exports a major share of its crude oil production, predominantly from Western Australia (Figure 6). Australia’s crude oil and condensate exports grew by 15 per cent in 2019–20 to 626 PJ (Department of Industry, Science, Energy and Resources, 2021 a, b). However, associated export earnings remained at about AUD$9 billion, showing the impact of COVID-19 on revenue, as prices dropped dramatically in early 2020.
Nearly 80 per cent of the domestically produced oil resources were exported in 2019–20. This is because Australian basins typically produce light sweet oils, which need to be blended with other heavier crude oils to produce refined fuel products. As most oil in Australia is produced on the North West Shelf at significant distances from refineries in the eastern part of the country, it is more cost effective to transport crude oil to larger refineries in the Asian region and import refined fuel products into Australia. The oil produced from eastern Australian basins is largely consumed domestically. However, falling east coast oil production means that Australia’s two remaining domestic refineries increasingly rely on imported feedstock.
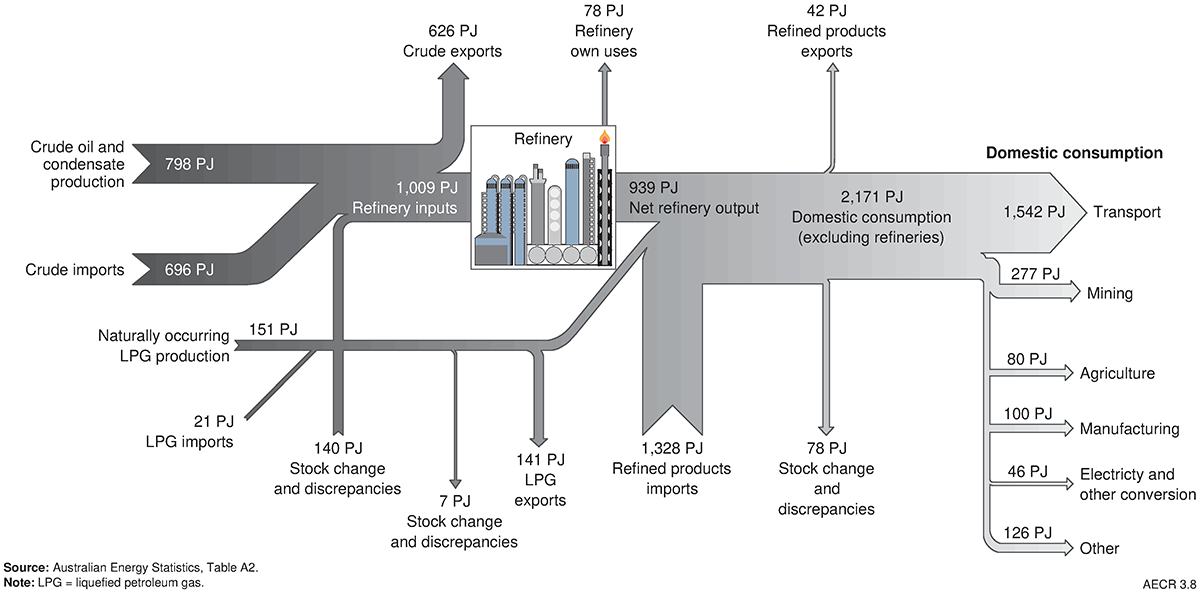
Australia also exported a small volume (about 184 PJ) of refined products and LPG in 2019–20, but this remained as a small proportion of domestically refined products (Figure 7; Department of Industry, Science, Energy and Resources, 2021a). Export earnings from Australia’s refined petroleum products and LPG increased modestly by about 2.5 per cent in 2019–20 to AUD$3.7 billion (Department of Industry, Science, Energy and Resources, 2021b).
The majority of Australia’s energy imports are represented by refined petroleum products (including LPG) and crude oil. Australia’s imports of crude oil decreased by 17 per cent in 2019–20 to 696 PJ, while imports of refined products and LPG remained relatively stable at 1,349 PJ (Department of Industry, Science, Energy and Resources, 2021a). Australia is becoming increasingly reliant on imported refined petroleum products to improve its energy security.
World oil resources
Proved world oil reserves in 2020 are estimated by bp (2021) at 1,732 billion barrels (Bbbl; equivalent to approximately 10,654,260 PJ; Table 6). This represents a minor decrease of 0.1 per cent (2 Bbbl) with respect to 2019 and is approximately 54 years of reserves life at current production rates (bp, 2021).
Global oil reserves have remained relatively stable over the past decade showing an average growth rate of 0.6 per cent per annum. The discovery and development of unconventional oil reserves in the United States, Canada and Venezuela has helped to maintain global oil reserves since the mid-1990’s.
Venezuela held the largest share of world oil reserves in 2020 with proved reserves of 304 Bbbl, accounting for approximately 17.5 per cent of global reserves (Figure 8; bp, 2021). Saudi Arabia and Canada held the second and third largest oil reserves, with proved reserves of 298 Bbbl and 168 Bbbl, respectively (bp, 2021). Nearly half (48 per cent) of total world oil reserves are in the Middle East. Australia’s current global ranking for oil reserves is difficult to determine due to a lack of reported proved reserves since 2014, when Australia was ranked 25th holding 0.2 per cent of the world’s oil reserves (Geoscience Australia, 2018).
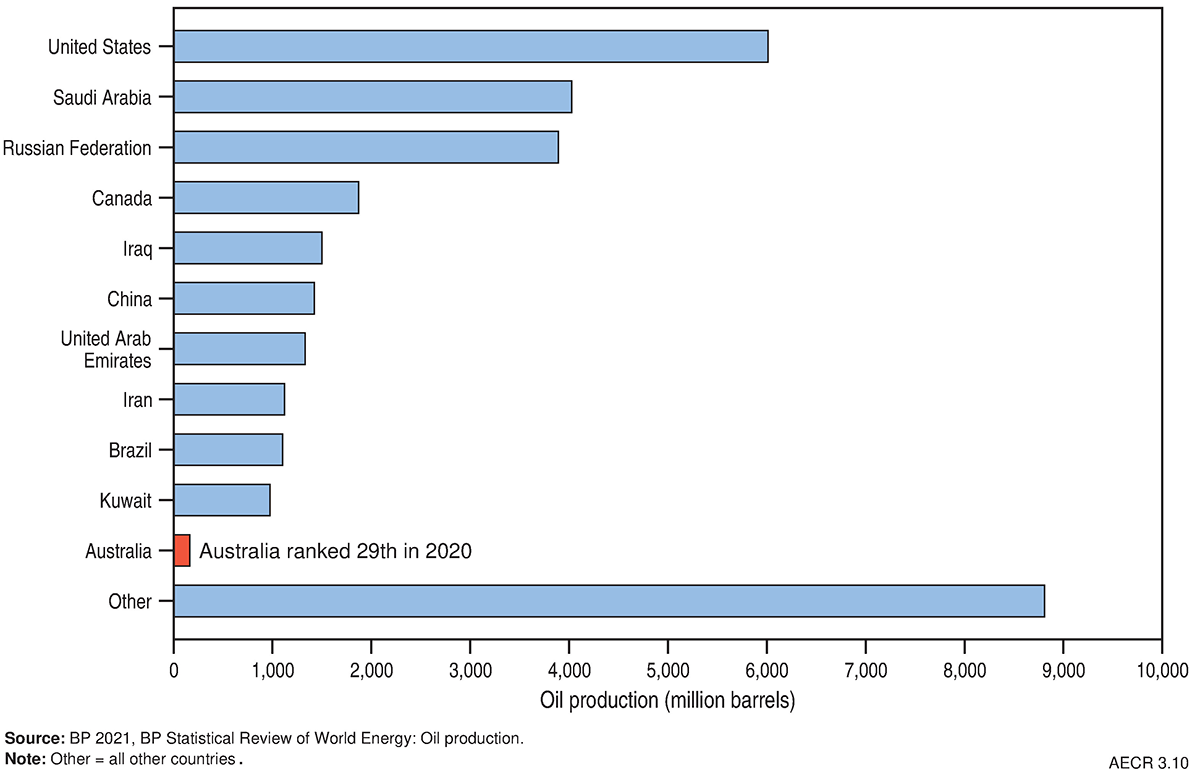
In 2020, total world oil production was approximately 32 Bbbl (equivalent to ~ 198,416 PJ; bp, 2021). The major oil producers were in the Middle East, which held a 31 per cent share of world production. The United States was the largest single producer, accounting for 19 per cent of world production, followed by Saudi Arabia (12 per cent) and the Russian Federation (12 per cent; Figure 8; bp, 2021). Australia is a minor oil producer, ranking twenty-ninth in the world and accounting for 0.5 per cent of total oil production in 2020 (bp, 2021).
References
bp 2021. bp Statistical Review of World Energy, 70th edition (Last accessed 29 June 2022).
Carnarvon Energy Limited 2022a. Apus-1 drilling update, 13 April 2022 (Last accessed 1 June 2022).
Carnarvon Energy Limited 2022b. Apus-1 drilling update, 19 April 2022 (Last accessed 1 June 2022).
Department of the Environment and Energy 2019. Australian Energy Statistics (Last accessed 20 April 2022).
Department of Industry, Science, Energy and Resources 2021a. Australian Energy Update (Last accessed 2 June 2022).
Department of Industry, Science, Energy and Resources 2021b. Resources and Energy Quarterly, December 2021 (Last accessed 2 June 2022).
Dyni, J.R. 2006. Geology and resources of some world oil-shale deposits: U.S. Geological Survey Scientific Investigations Report 2005–5294, 42 p. (Last accessed 06 May 2022).
Geoscience Australia. 2018. Australian Energy Resources Assessment (AERA)
Santos 2022. Significant Pavo oil discovery near Dorado development. ASX/Media Release, 23 March 2022 (Last accessed 31 May 2022).
United States Geological Survey (USGS). 2016. Assessment of undiscovered conventional oil and gas resources of the Cooper and Eromanga basins, Australia, 2016. U.S. Geological Survey Fact Sheet 2016-3050, 2 p. (Last accessed 06 May 2022).
References for onshore reserves, contingent resources, and production data
Armour Energy Limited 2021. Annual Report For the year ended 30 June 2021 (Last accessed 02 May 2022)
Beach Energy Limited 2021. Annual Report 2021 (Last accessed 02 May 2022)
Beach Energy Limited 2020. FY20 Fourth Quarter Activities Report (Last accessed 02 May 2022)
Beach Energy Limited 2021. FY21 Second Quarter Activities Report (Last accessed 02 May 2022)
Bengal Energy Ltd 2021. Annual Information Form for the year ended March 31, 2021 (Last accessed 09 May 2022)
Bengal Energy Ltd 2021. 2021 Annual Report Twelve Months Ended March 31, 2021 (Last accessed 09 May 2022)
Black Mountain Energy 2021. Prospectus (Last accessed 02 May 2022)
Buru Energy Limited 2020. 2020 Annual Report (Last accessed 09 May 2022)
Buru Energy Limited 2018. Independent Assessment of Resources at the Yulleroo Field 18 January 2018 (Last accessed 09 May 2022)
Central Petroleum Limited 2021. 2021 Annual Report (Last accessed 02 May 2022)
Cooper Energy Limited 2021. Annual Report 2021 (Last accessed 02 May 2022)
Cooper Energy Limited 2020. Q4FY20 Quarterly Report for 3 months to 30 June 2020 (Last accessed 02 May 2022)
Cooper Energy Limited 2021. Quarterly Report for the three months ended 31 December 2020 (Last accessed 02 May 2022)
Denison Gas 2019. Media Release - Reserves and Contingent Resources as at 30 June 2019 (Last accessed 02 May 2022)
Empire Energy Group Limited 2021. Material Beetaloo Resource Upgrade (Last accessed 02 May 2022)
New Hope Corporation 2021. Bridgeport Energy Limited- 2021 Petroleum Reserves and Contingent Resources statement (Last accessed 02 May 2022)
NT Department of Industry, Tourism and Trade 2022. NT onshore oil and gas production data (Last accessed 02 May 2022)
Red Sky Energy Limited 2021. Summary of Potential Current Resources (Last accessed 02 May 2022)
ROC Oil Company Pty Ltd 2020. Summary of Reserves and Resources (Last accessed 02 February 2022)
Santos Limited 2020. Annual Report 2020 (Last accessed 02 May 2022)
Santos Limited 2020. 2020 Fourth Quarter Report Data Tables (Last accessed 02 May 2022)
SA Department for Energy and Mining 2021, Sales production statistics FY20/21 (Last accessed 02 May 2022)
Geological Survey of Victoria 2021. Earth Resources Regulation Annual Statistical Report FY2020-21 (Last accessed 02 May 2022)
Published prospective resource estimates (2020 reporting year)
Amadeus Basin
Central Petroleum Limited 2021. 2021 Annual Report (Last accessed 02 May 2022)
Northern Territory Geological Survey (NTGS) 2021. NT Resourcing The Territory Shale Gas and Liquids Factsheet October 2021/March 2022 (Last accessed 02 May 2022)
Northern Territory Geological Survey (NTGS) 2021. NT Resourcing The Territory Conventional Oil and Gas Factsheet October 2021/March 2022 (Last accessed 02 May 2022)
Bonaparte Basin
Melbana Energy 2021. Bonaparte Gulf - Beehive (Last accessed 04 May 2022)
Melbana Energy 2021. Vulcan Sub-basin Exploration (Last accessed 04 May 2022)
Bowen-Surat Basin
Energy Capture 2022. Projects (Last accessed 02 May 2022)
Canning Basin
Black Mountain Energy 2021. Prospectus (Last accessed 02 May 2022)
Buru Energy Limited 2018. Independent Assessment of Resources at the Yulleroo Field 18 January 2018 (Last accessed 09 May 2022)
Cooper-Eromanga Basin
Metgasco Ltd 2021. 2021 Annual Report (Last accessed 02 May 2022)
Georgina Basin
Northern Territory Geological Survey (NTGS) 2021. NT Resourcing The Territory Shale Gas and Liquids Factsheet October 2021/March 2022 (Last accessed 02 May 2022)
Northern Territory Geological Survey (NTGS) 2021. NT Resourcing The Territory Conventional Oil and Gas Factsheet October 2021/March 2022 (Last accessed 02 May 2022)
McArthur Basin (Beetaloo Sub-basin)
Empire Energy Group Limited 2021. Material Beetaloo Resource Upgrade (Last accessed 02 May 2022)
Northern Territory Geological Survey (NTGS) 2021. NT Resourcing The Territory Shale Gas and Liquids Factsheet October 2021/March 2022 (Last accessed 02 May 2022)
Northern Territory Geological Survey (NTGS) 2021. NT Resourcing The Territory Conventional Oil and Gas Factsheet October 2021/March 2022 (Last accessed 02 May 2022)
Tamboran Resources Limited 2021. 2021 Annual Report (Last accessed 02 May 2022)
Perth Basin
Metgasco Ltd 2021. 2021 Annual Report (Last accessed 02 May 2022)
Vintage Energy Ltd 2020 Onshore Perth Basin farm-in to Cervantes oil prospect (Last accessed 09 May 2022)
Roebuck Basin
Carnarvon Petroleum Ltd 2021. Bedout Basin Update (Last accessed 20 May 2022)
Upcoming data releases
- This preliminary release of AECR 2022 includes oil commodity resource maps and a download of data tables for the 2020 reporting period.
- A final report documenting Australia’s identified oil resources, production, trade and world ranking will be available in late June 2022.
- Contact the Energy Resources Advice and Promotion team for more information.
Data download
Australia’s Energy Commodity Resources Data Tables – 2020 Reporting Period