Bauxite
Australia’s EDR of bauxite fell from 6015 Mt in 2017 to 5118 Mt in 2018 (Table 3), a 15% drop (Table 4). Subeconomic resources remained unchanged over the year at 1459 Mt, but Inferred Resources increased 53% from 2079 Mt in 2017 to 3172 Mt on the back of new resource estimates at Weipa and Amrun (South of Embley).
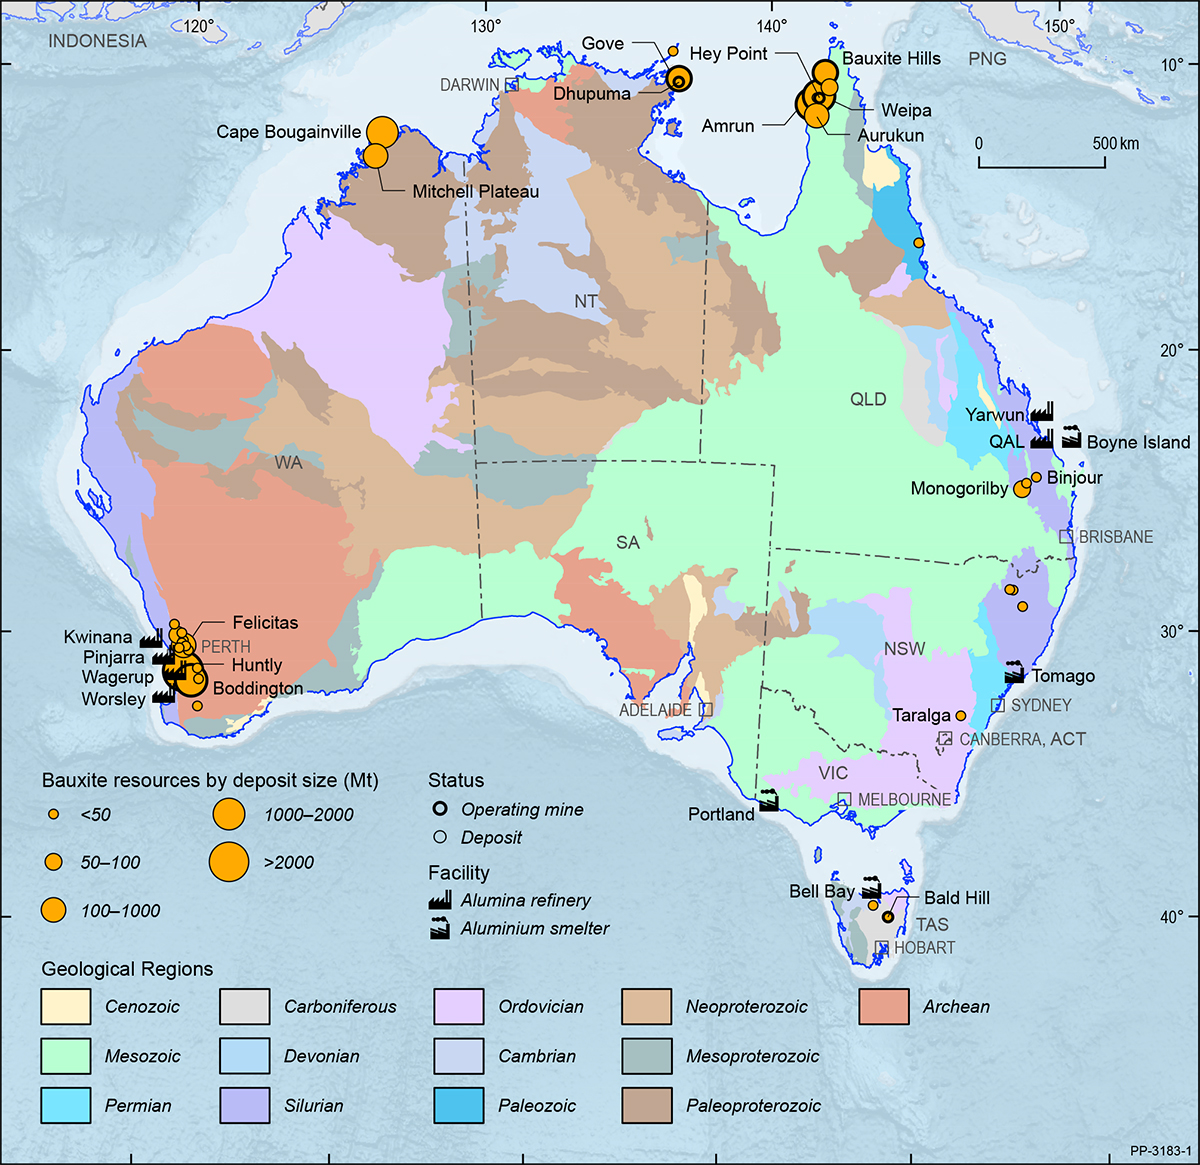
Production increased from 87.9 Mt in 2017 to 96.5 Mt in 2018 (Table 1). This 10% increase was offset by a 10% fall in Ore Reserves. Ore Reserves in 2018 were 1962 Mt (Table 2), reduced from 2170 Mt in 2017. Consequently, Australia’s reserve life for bauxite fell from 25 years to 20 years (Table 2). Resource life (based on AEDR) fell from 70 years to 53 years (Table 9). Major deposits are shown in Figure 3 on a total resource basis.
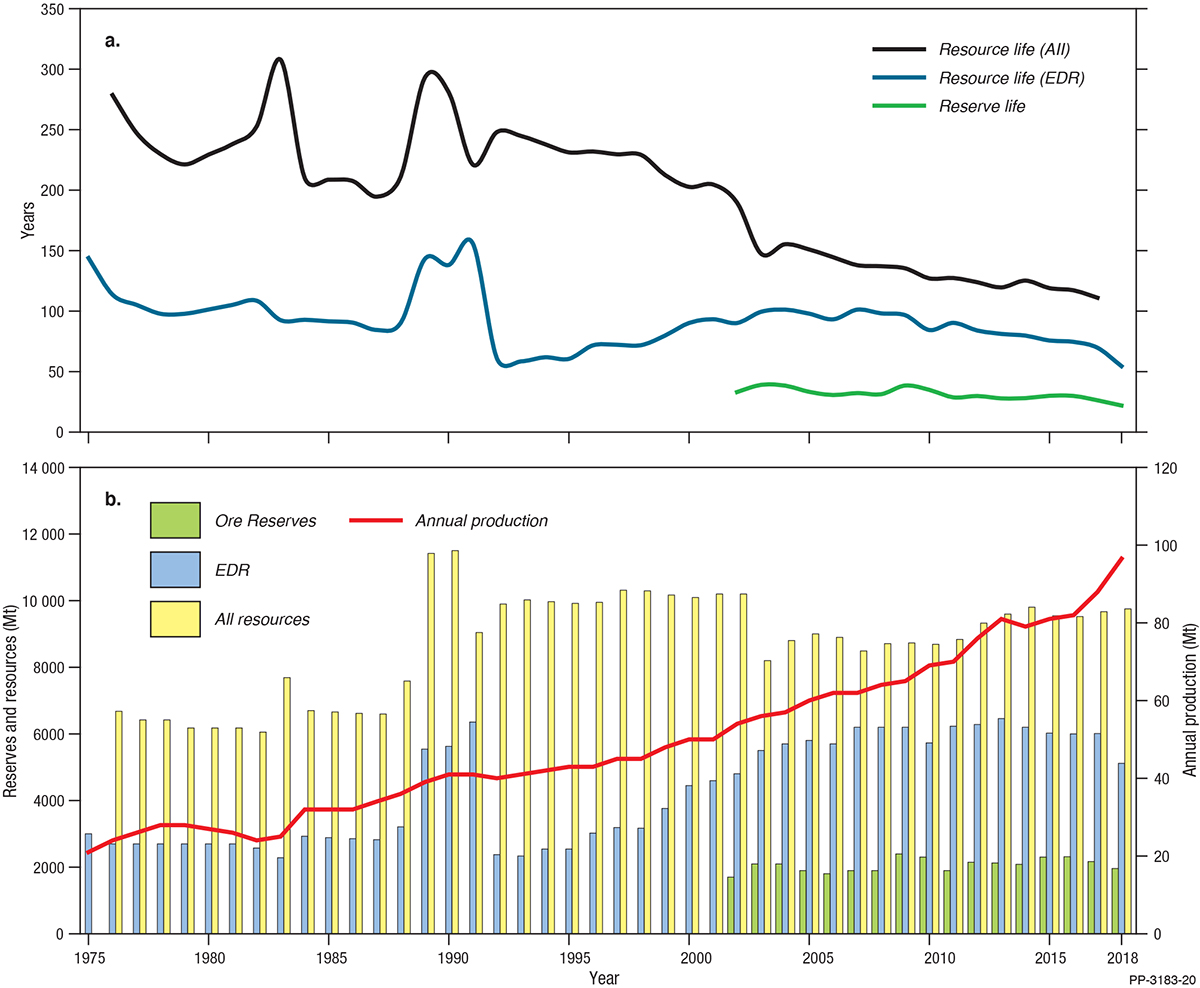
Figure 4 shows that since 1975 bauxite production has increased more rapidly than the bauxite inventory. In 1975, bauxite production was 21 Mt which rose to 96.5 Mt in 2018, an increase of 360%. Bauxite EDR has increased 71% in the same time period (3000 Mt in 1975 to 5118 Mt in 2018) and total resources of bauxite (EDR + Subeconomic + Inferred) have increased from 6678 Mt in 1976 to 9749 Mt in 2018, an increase of 46%.
In addition to increased production, the number of active mines has also increased (Table 1) with new mines in Queensland and the Northern Territory. Rio Tinto Ltd’s major Amrun mine, located south of Weipa on the western side of the Cape York Peninsula in Queensland, came on line in late 2018 and is the second largest in Australia. Also in this region, Bauxite Hills, owned by Metro Mines Ltd, began producing in April 2018 and, in the Northern Territory, the Dhumpuma (Gulkula Mining Company Pty Ltd) mine sent its first production to Rio Tinto’s Gove operation.
In Tasmania, Australian Bauxite Ltd produced from its Bald Hill operation and the company continues to progress its Binjour deposit in Queensland with the announcement of a three-party memorandum of understanding for supply with Tianshan Aluminium Co Ltd and Rawmin Mining and Industries Pty Ltd.
Australia remains the world’s largest producer of bauxite accounting for 30% of global production (Table 8). Australia is also the world’s second largest producer of alumina, after China, with 26% of production, and is ranked sixth in the world for aluminium production (3%). Australia’s resources of bauxite are the second largest in the world with only Guinea holding more, 25% compared to Australia’s 17% (Table 8).
Black Coal
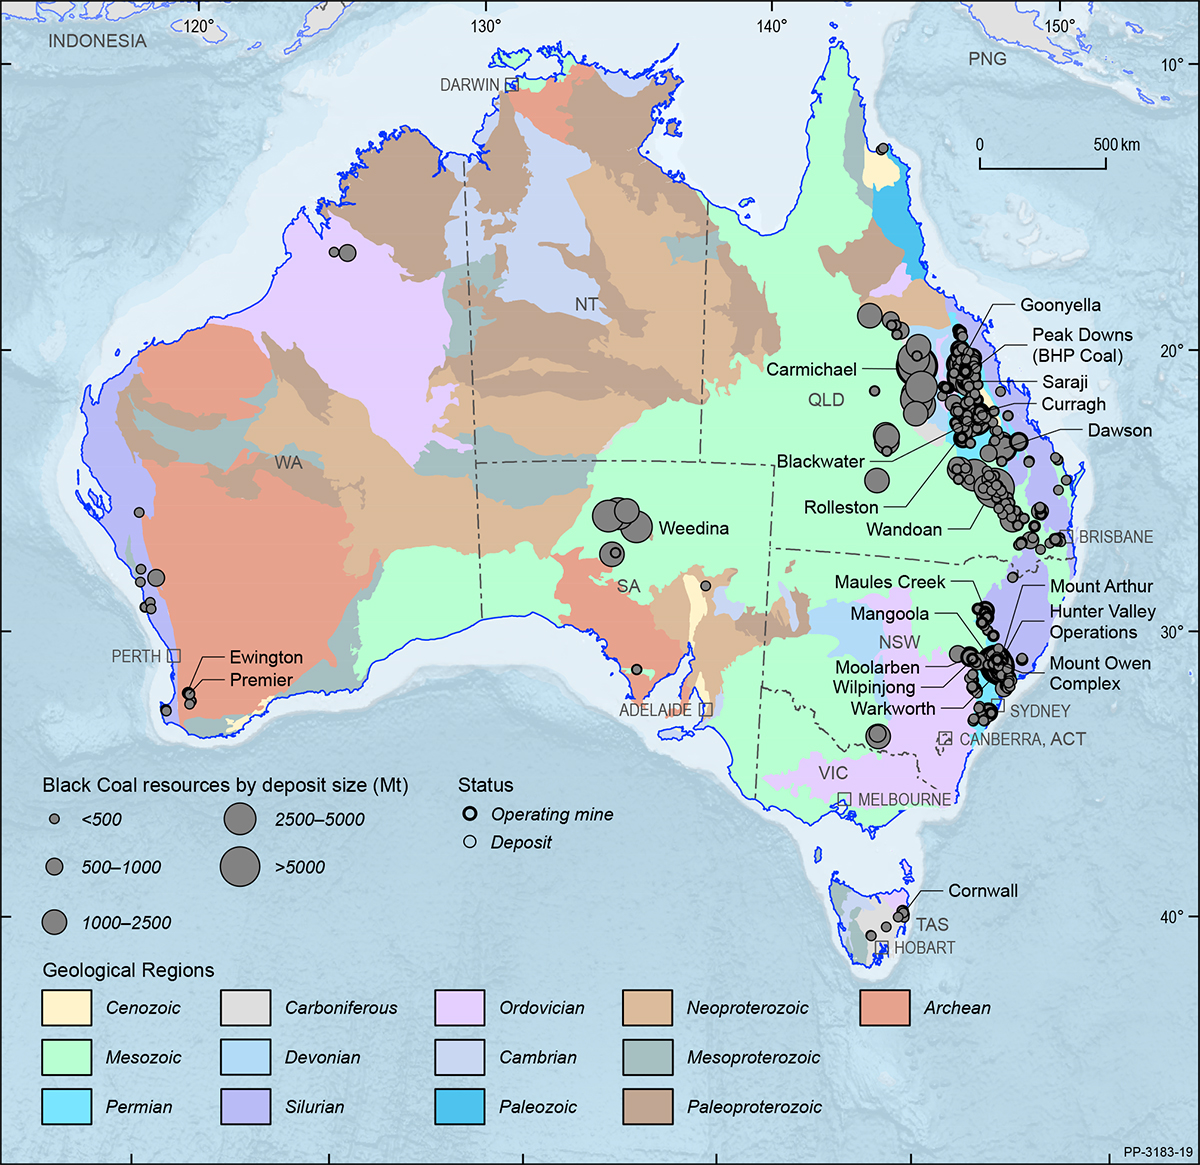
At the end of December 2018, EDR of recoverable black coal were 73 719 Mt (Table 3), a small increase (1%) from 72 571 Mt the previous year (Table 4). Most of Australia’s black coal EDR is in Queensland (64%) and New South Wales (33%), the remainder is in South Australia, Western Australia and Tasmania (Figure 2). Major deposits are shown in Figure 5 on a total resource basis.
Australia holds an estimated 10% of world economic resources of black coal and ranks fourth in the world (Table 8), behind the United States (30%), China (18%) and India (13%). In 2018, Australian black coal production was 578 Mt (Table 1), up by 3% from 559 Mt in 2017, representing 8% of world production.
In 2018, the Newcastle benchmark thermal coal spot price averaged US$105/t, compared to US$87/t in 2017, and the premium hard coking coal spot price averaged US$207/t, compared to US$186/t in 2017. The value of Australia’s exports of coal totalled $66.8 billion, up 17% on $57.1 billion in 2017.
As at December 2018, total Ore Reserves of black coal reported in compliance with the JORC Code amounted to 19 715 Mt (Table 2) of which 12 592 Mt (64%) was attributable to 95 operating mines (Table 1, Figure 1). In 2018, total Ore Reserves increased by 6% from 18 536 Mt to 19 715 Mt, whilst the Ore Reserves at operating mines decreased by almost 1% from 12 713 Mt to 12 592 Mt.
At 2018 production levels, the average reserve life at operating mines for black coal is potentially 22 years (Table 1, Figure 6), a modest change from 23 years in 2017. The Measured and Indicated Mineral Resource life at operating mines is 45 years and the Measured, Indicated and Inferred Mineral Resource life at operating mines is 68 years (Table 1).
Resource life is a snapshot in time derived by taking a reserve or resource number and dividing it by a production number. Last century, resource life (based on EDR) for black coal declined rapidly from more than 300 years in the late 1970s to less than half that by the year 2000 as rapidly increasing production was not matched by new resource delineation. Since the turn of the century, however, the reserve/production and resource/production ratios for recoverable black coal have been generally steady because companies have been demarcating new Ore Reserves and Mineral Resources at approximately the same rate that they have been increasing production (Figure 6).
Spending on coal exploration in 2018 was $173 million, a 40% increase on 2017 ($124 million) with most of the exploration expenditure occurring Queensland. In 2017, the New South Wales Department of Planning and Environment, and the New South Wales Planning Assessment Commission, rejected the Rocky Hill Coal Project near Gloucester. New operations did, however, commence in 2018 at the following locations: Isaac Plains East, a satellite of the Isaac Plains mine near Moranbah in Queensland; Meteor Downs South, near Emerald in Queensland; and Mount Pleasant in New South Wales. In 2019, the New South Wales Independent Planning Commission refused development consent to the Bylong Coal Project on environmental grounds, whilst the United Wambo project in the Hunter Valley (also New South Wales) gained conditional approval.
Brown Coal
At the end of December 2018, EDR of recoverable black coal were 73 719 Mt (Table 3), a small increase (1%) from 72 571 Mt the previous year (Table 4). Most of Australia’s black coal EDR is in Queensland (64%) and New South Wales (33%), the remainder is in South Australia, Western Australia and Tasmania (Figure 2). Major deposits are shown in Figure 5 on a total resource basis.
Australia holds an estimated 10% of world economic resources of black coal and ranks fourth in the world (Table 8), behind the United States (30%), China (18%) and India (13%). In 2018, Australian black coal production was 578 Mt (Table 1), up by 3% from 559 Mt in 2017, representing 8% of world production.
In 2018, the Newcastle benchmark thermal coal spot price averaged US$105/t, compared to US$87/t in 2017, and the premium hard coking coal spot price averaged US$207/t, compared to US$186/t in 2017. The value of Australia’s exports of coal totalled $66.8 billion, up 17% on $57.1 billion in 2017.
As at December 2018, total Ore Reserves of black coal reported in compliance with the JORC Code amounted to 19 715 Mt (Table 2) of which 12 592 Mt (64%) was attributable to 95 operating mines (Table 1, Figure 1). In 2018, total Ore Reserves increased by 6% from 18 536 Mt to 19 715 Mt, whilst the Ore Reserves at operating mines decreased by almost 1% from 12 713 Mt to 12 592 Mt.
Cobalt
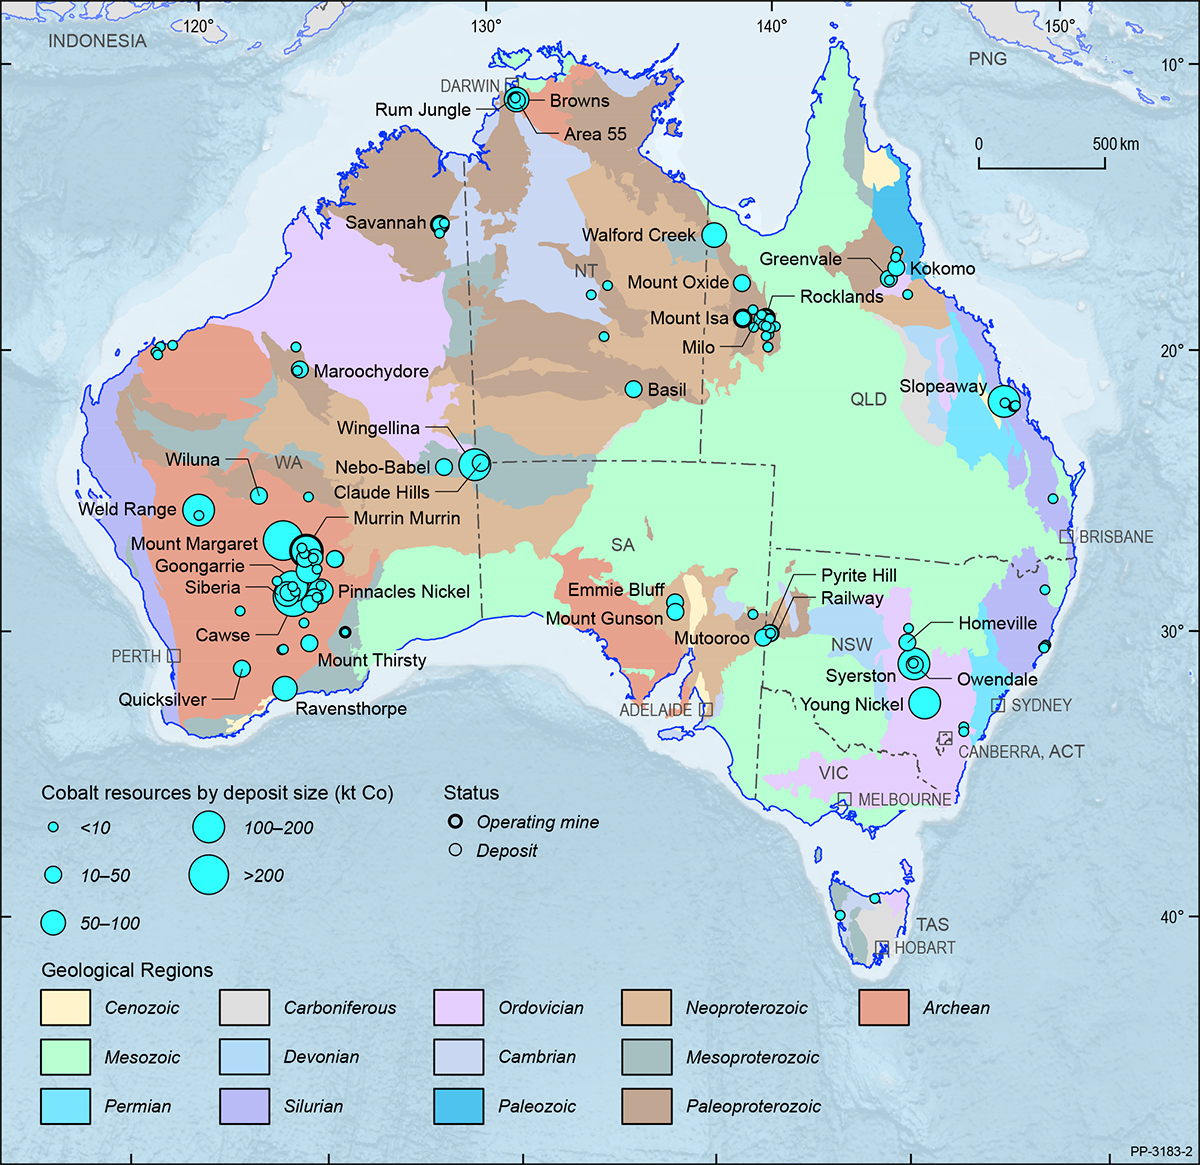
Australia’s EDR and Ore Reserves of cobalt significantly increased in 2018. Cobalt EDR were 1353 kt (Table 3), an increase of 11% from the 2017 estimate of 1222 kt (Table 4), and total Ore Reserves were 635 kt (Table 2), up 52% from 307 kt in 2017. Most cobalt deposits in Australia occur in Western Australia (Figure 7), which hosts the largest proportion of cobalt EDR (70%). Queensland has the second largest EDR (15%) followed by New South Wales (14%) and South Australia (1%). Major deposits are shown in Figure 7 on a total resource basis.
In world rankings, Congo dominates the global economic resources of cobalt with an estimate of 3400 kt which is equivalent to 49% of the global inventory. Australia follows with 20% of global economic resources with Cuba third (7%). In 2018, Australia produced 4.9 kt of cobalt (Table 3) ranking third globally (Table 8), behind Congo and Russia.
Cobalt is used as a metal in numerous diverse commercial, industrial and military applications, many of which are strategic and critical. Its main use is in rechargeable battery electrodes. Cobalt is also used in superalloys for gas engine components, as a catalyst for the petroleum and chemical industries, in alloys for tools and in many industrial products such as paints, magnets and tyres. The United States Department of the Interior included cobalt in its published list of 35 critical minerals6.
The present upward trend of electric vehicle production has increased the interest in cobalt mineral exploration and project development. Commonly, cobalt minerals occur as accessories to nickel and copper, thus it is usually produced as a by-product of nickel and copper mining. However, as the electric car battery industry grows globally, it has been accompanied by increased development activity at deposits where cobalt is regarded as the primary resource.
The USGS notes the 2018 average cobalt price was higher than that of 2017, owing to strong demand from consumers in the rechargeable battery and aerospace industries and to limited availability of cobalt metal7. However, by the end of 2018, the cobalt price was down 66% from its peak value of $55/lb, reached in April 2018. The high price of cobalt had caused a widespread push by battery and car makers to reduce the amount of cobalt needed in batteries, negatively impacting demand. Despite the fallen price, the long-term outlook for cobalt is still strong with predicted growth in demand and a tightening in supply.
Recent activity in Australia has seen CuDeco Ltd, a copper producer, partnering with Cobalt Blue Holdings Ltd to assess the potential of recovering cobalt from the tailings of the Rocklands mine in Queensland. Cobalt Blue has also partnered with Broken Hill Prospecting Ltd in the Thackaringa cobalt project that includes the Railway and Pyrite Hill deposits in New South Wales.
6 United States Government Federal Register, 2018. Final List of Critical Minerals 2018. A Notice by the Interior Department on 05/18/2018. Document 83 FR 23295.
7 United States Geological Survey, 2019. Mineral Commodity Summaries, Cobalt.
Copper
Australia’s EDR of copper were 88.17 Mt at the end of December 2018 (Table 3), a modest increase from 87.47 Mt in 2017 (Table 4). South Australia holds 66% of Australia’s copper EDR, followed by New South Wales (15%), Queensland (12%), Western Australia (6%) and Tasmania (1%), with minor (<1%) EDR each held by the Northern Territory and Victoria (Figure 2).
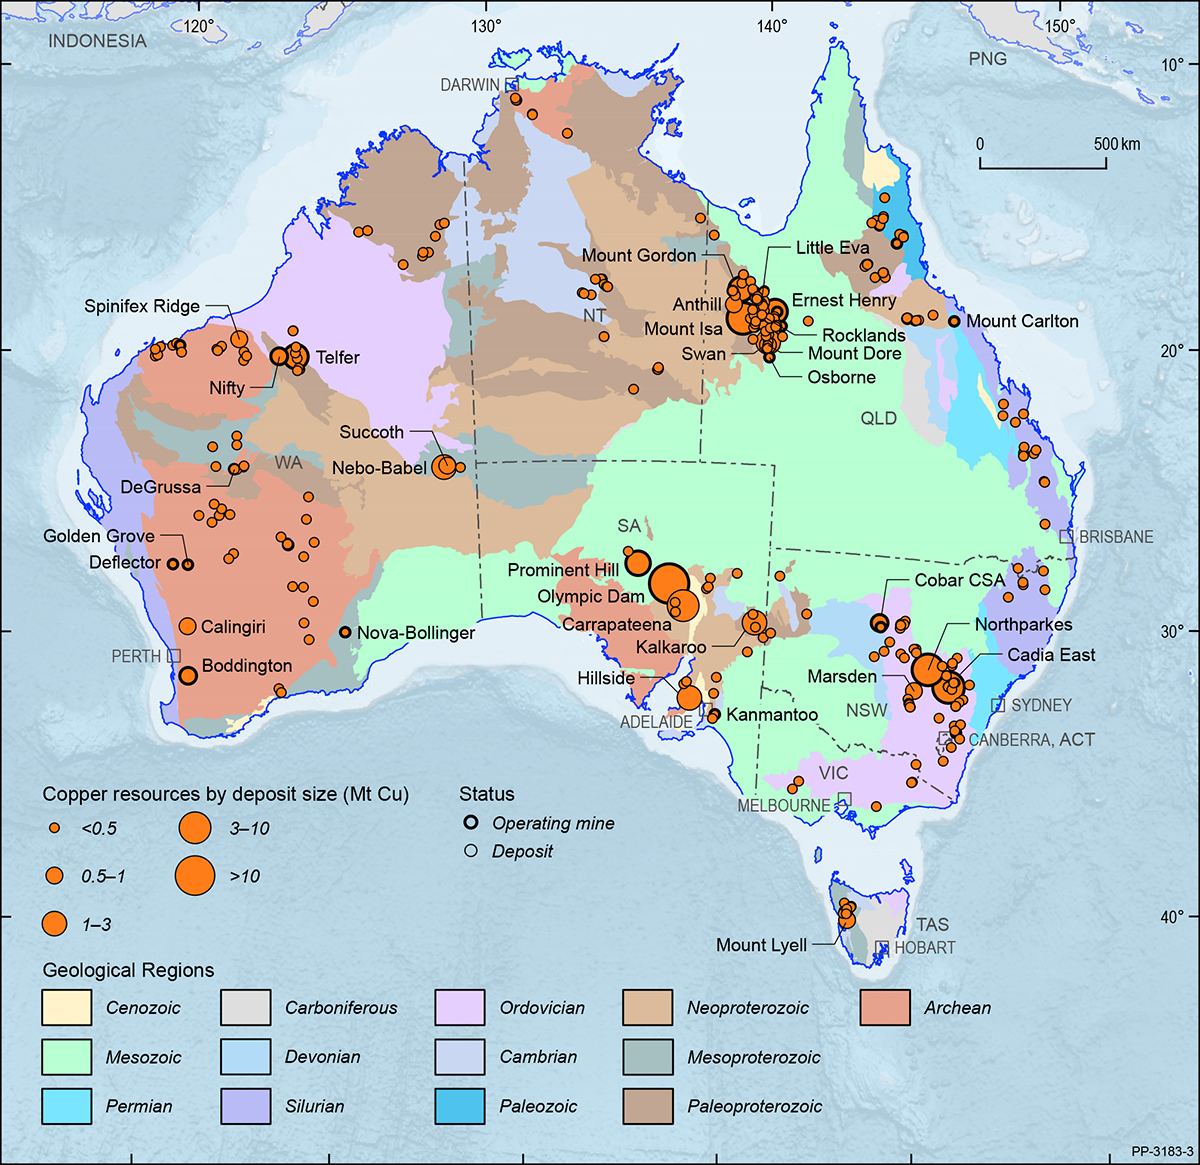
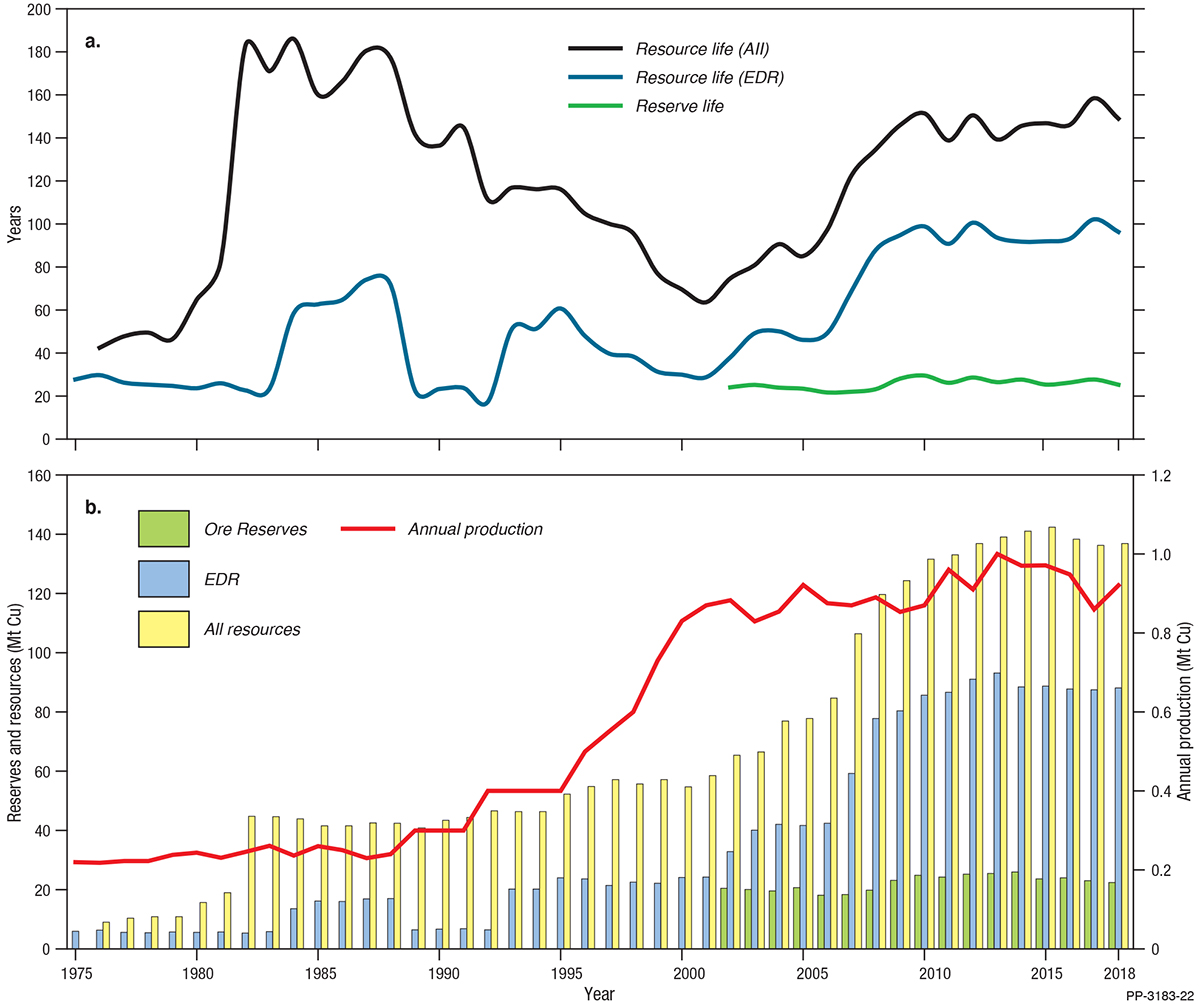
As at December 2018, total Ore Reserves of copper reported in compliance with the JORC Code amounted to 22.38 Mt (Table 2) of which 19.13 Mt (85%) was attributable to 36 operating mines (Figure 1, Table 1). Ore Reserves at operating mines decreased by nearly 5% from 20.08 Mt in 2017 to 19.13 Mt in 2018 as a result of increased production, which totalled 0.920 Mt (Table 1), up 7% on 2017 levels and accounting for 4% of global supply (Table 8). At 2018 production levels, the reserve life at operating mines for copper was potentially 21 years. Total Ore Reserves at all deposits also decreased in 2018, from 23.03 Mt in 2017 to 22.38 Mt (Table 2). At 2018 production levels, the Measured and Indicated Mineral Resource life at operating mines is 79 years and the Measured, Indicated and Inferred Mineral Resource life at operating mines is 112 years. Operating mines and deposits are shown in Figure 8 on a total resource basis.
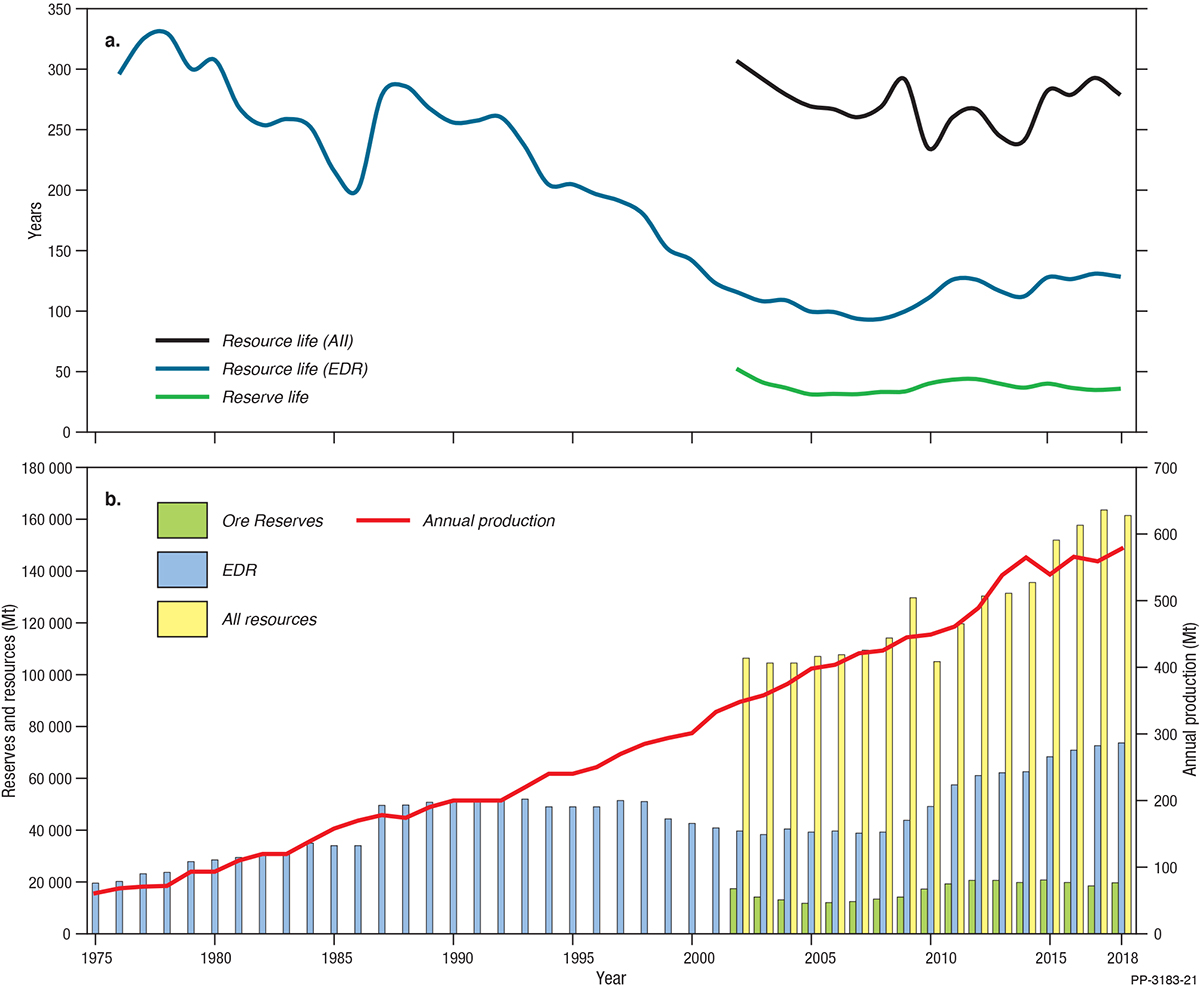
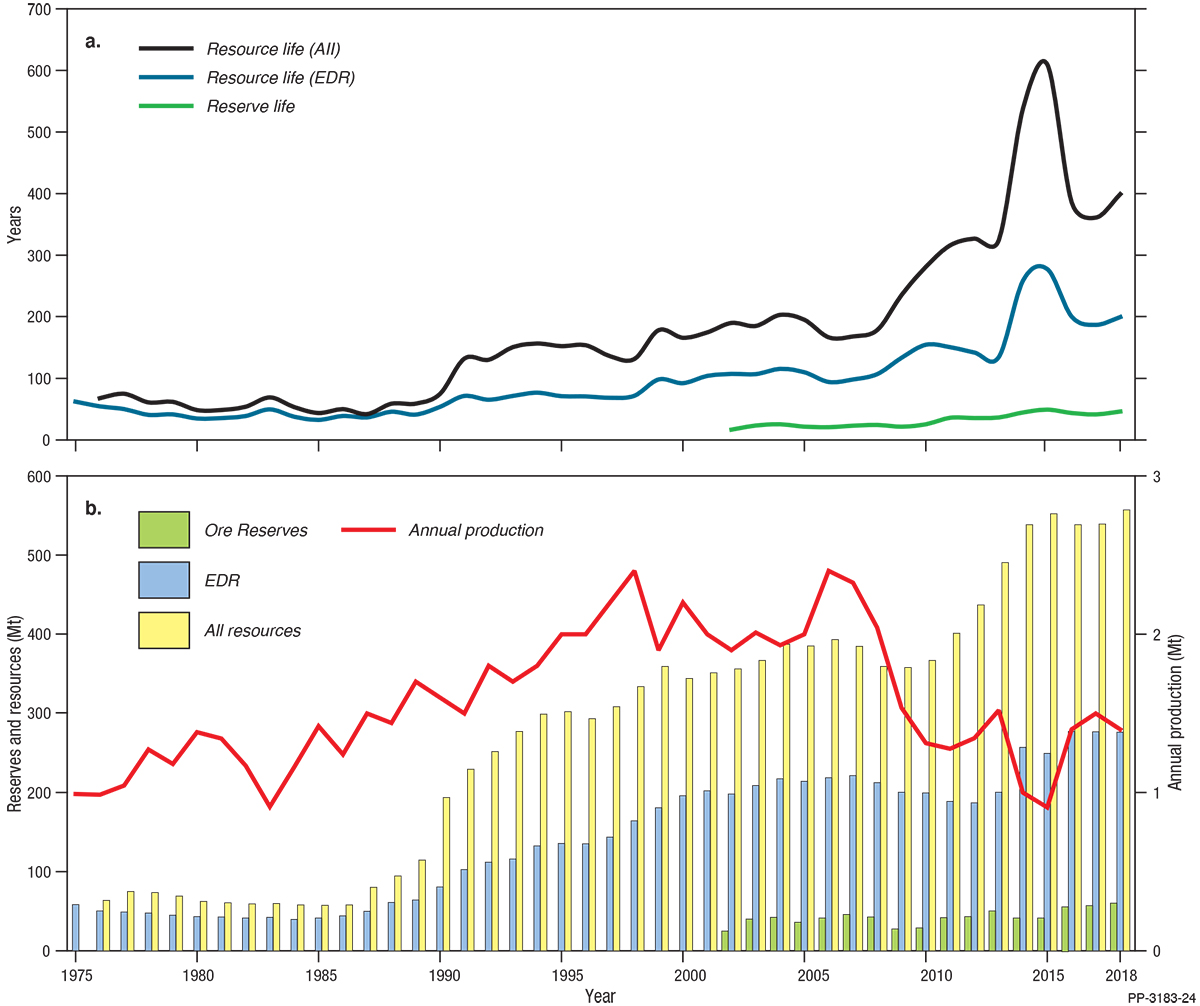
Resource life is a snapshot in time derived by taking a reserve or resource number and dividing it by a production number. While copper reserve life has been broadly constant (Figure 9), resource life (EDR) increased rapidly from 30 years in 2001 to 100 years in 2009 as new resources were added to the inventory but were not matched by increasing production rates (Figure 9). Since 2009, resource life (EDR) has ranged between 90 and 100 years reflecting a congruency between production and resource replacement (Figure 9).
Spending on copper exploration in 2018 was $260 million, a 70% increase on 2017 ($155 million) with increases in copper exploration expenditure occurring over the last two years still not reaching the levels seen in 2012 ($414 million). Exploration activity in 2018 included drilling at Rio Tinto Ltd’s tenements in the Yeneena Basin of the Paterson Province (Western Australia), resulting in the discovery of copper-gold mineralisation at the Winu project. Talisman Mining Ltd was granted two exploration licenses in the Boona project area (New South Wales) and, as of October 2019, exploration drilling continues. In 2018, Hammer Metals Ltd reported a maiden Inferred Resource at the Jubilee copper-gold deposit in the Mount Isa region of Queensland and Thor Mining PLC also reported a maiden Inferred Resource at the Bonya copper project in the Northern Territory.
Australia hosts 11% of the world’s copper resources (Table 8), second only to Chile and ahead of Peru. For global production, Australia ranks sixth (Table 8), behind Chile, Peru, China, the United States and Congo. The value of Australia’s exports of copper concentrates and refined copper in 2018 totalled $9.3 billion (Table 11), up 22% on $7.6 billion in 2017. In 2018, the London Metal Exchange cash price averaged US$6525/t, an increase from US$6164/t in 2017.
Diamond
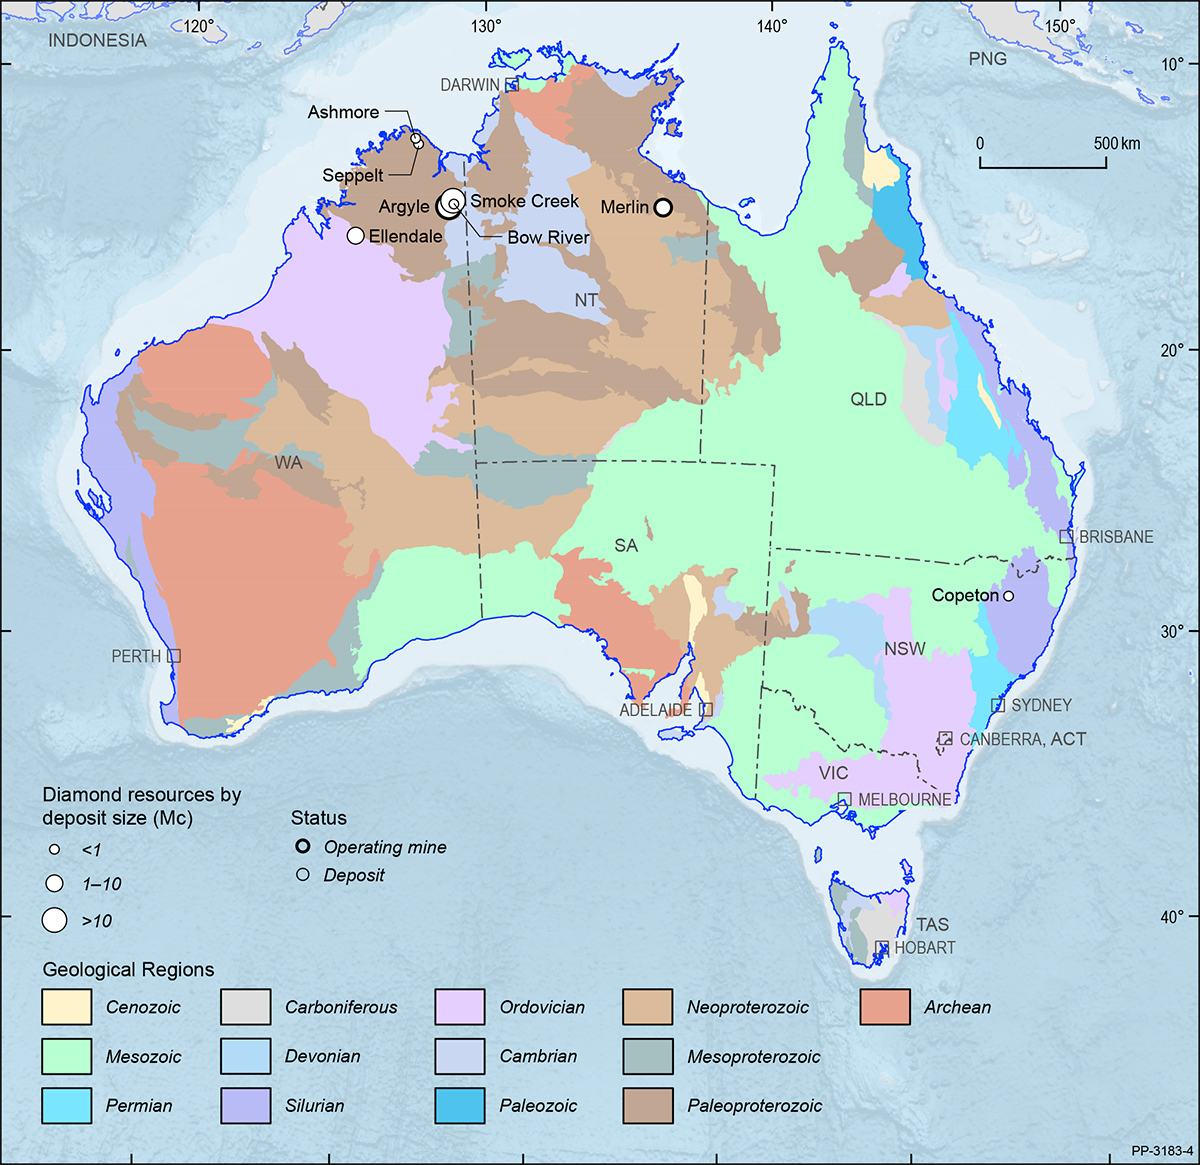
In 2018, Australia’s total EDR of diamond were 25.48 Mc (Table 3), down 36% from 39.68 Mc in 2017 (Table 4). This is largely owing to resources at Argyle being depleted by mining. Despite a 145% increase in export volume of sorted gem diamonds (Table 12), total production also decreased, from 17.14 Mc in 2017 to 14.07 Mc in 2018 (Table 3). This combination of declining resources and mine production has resulted in an Australian diamond resource life of only two years or less (Table 9).
The Argyle lamproite pipe in the east Kimberley region of Western Australia was responsible for almost all diamond production in Australia, with small-scale mining at the Merlin mine in the Northern Territory contributing a small quantity of diamonds. Operating mines and deposits for diamond are shown in Figure 10 on a total resource basis.
Graphite
Demand for graphite by manufacturers of electric vehicles and battery storage technology is increasing. Graphite mining occurs globally, with China the leading producer in 2018 accounting for 68% of world supply, followed by Brazil (10%). Economic resources of graphite have shown notable increases since 2013, with Turkey hosting the largest graphite inventory (30%) in 2018, followed by China and Brazil (both 24%).
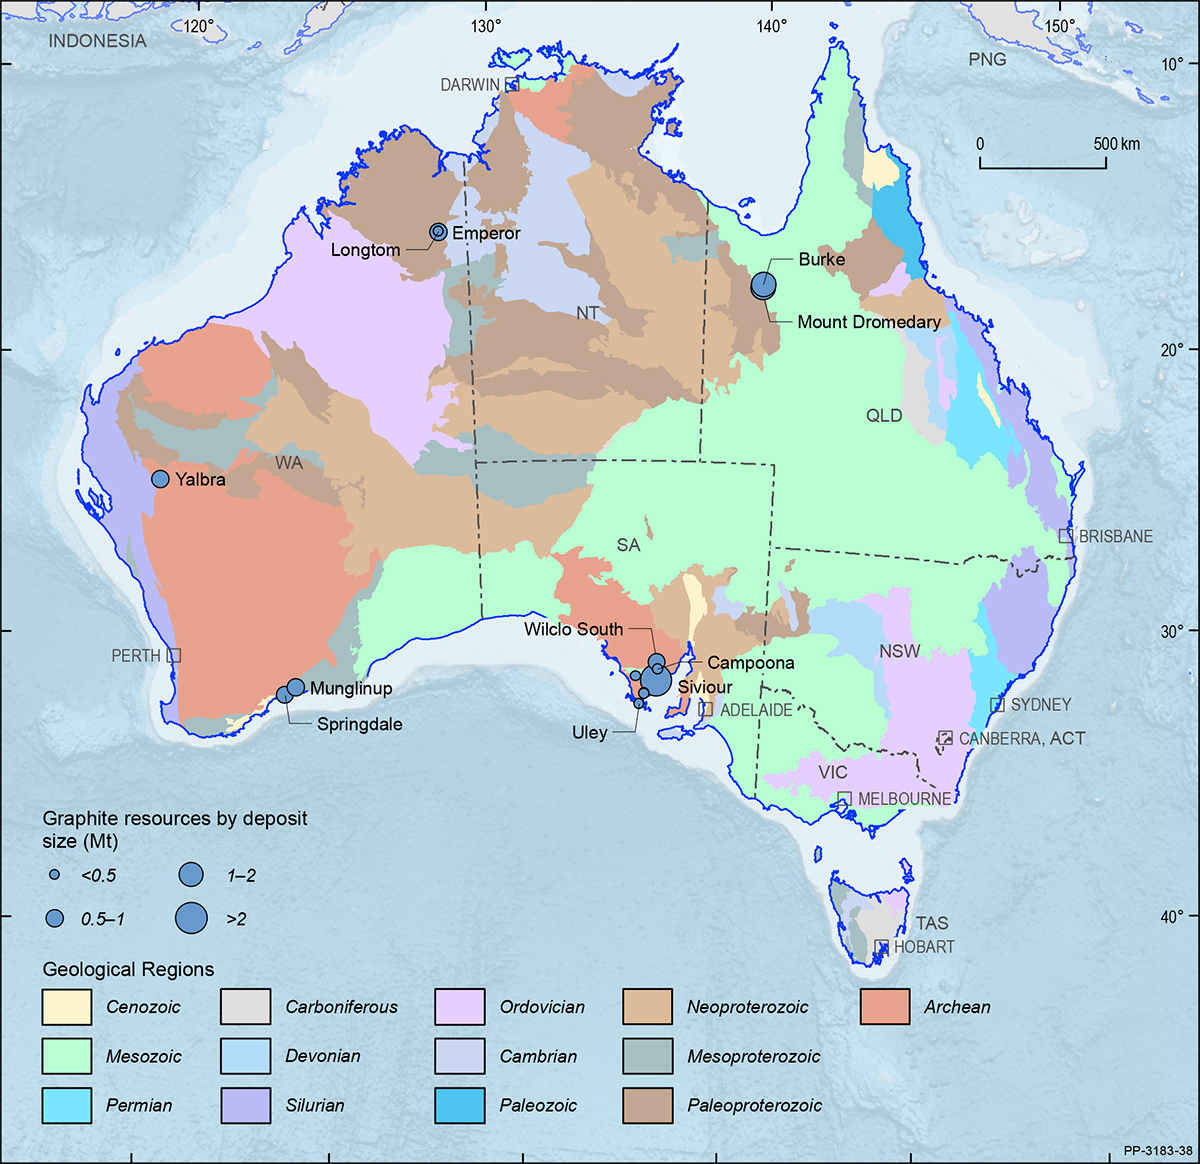
Australia’s EDR of graphite in 2018 were approximately 7.25 Mt (Table 3), a 2% increase from the previous year’s estimate (Table 4). In contrast, Australia’s total graphite Ore Reserve in 2018 was estimated to be 5.17 Mt (Table 2), a 393% increase since 2017. Inferred Resources of graphite were estimated at 6.98 Mt, up 15% from 6.05 Mt in 2017.
Graphite deposits occur across Queensland, Western Australia and South Australia. South Australia hosts 65% of graphite EDR, followed by Queensland (18%) and Western Australia (17%). Graphite deposits include: Uley, Oakdale, Siviour, Kookaburra Gully, Wilclo South, Koppio and Campoona in South Australia; Mount Dromedary and Burke in Queensland; and Springdale, Emperor, Longtom, Munglinup and Yalbra in Western Australia (Figure 11).
Gold
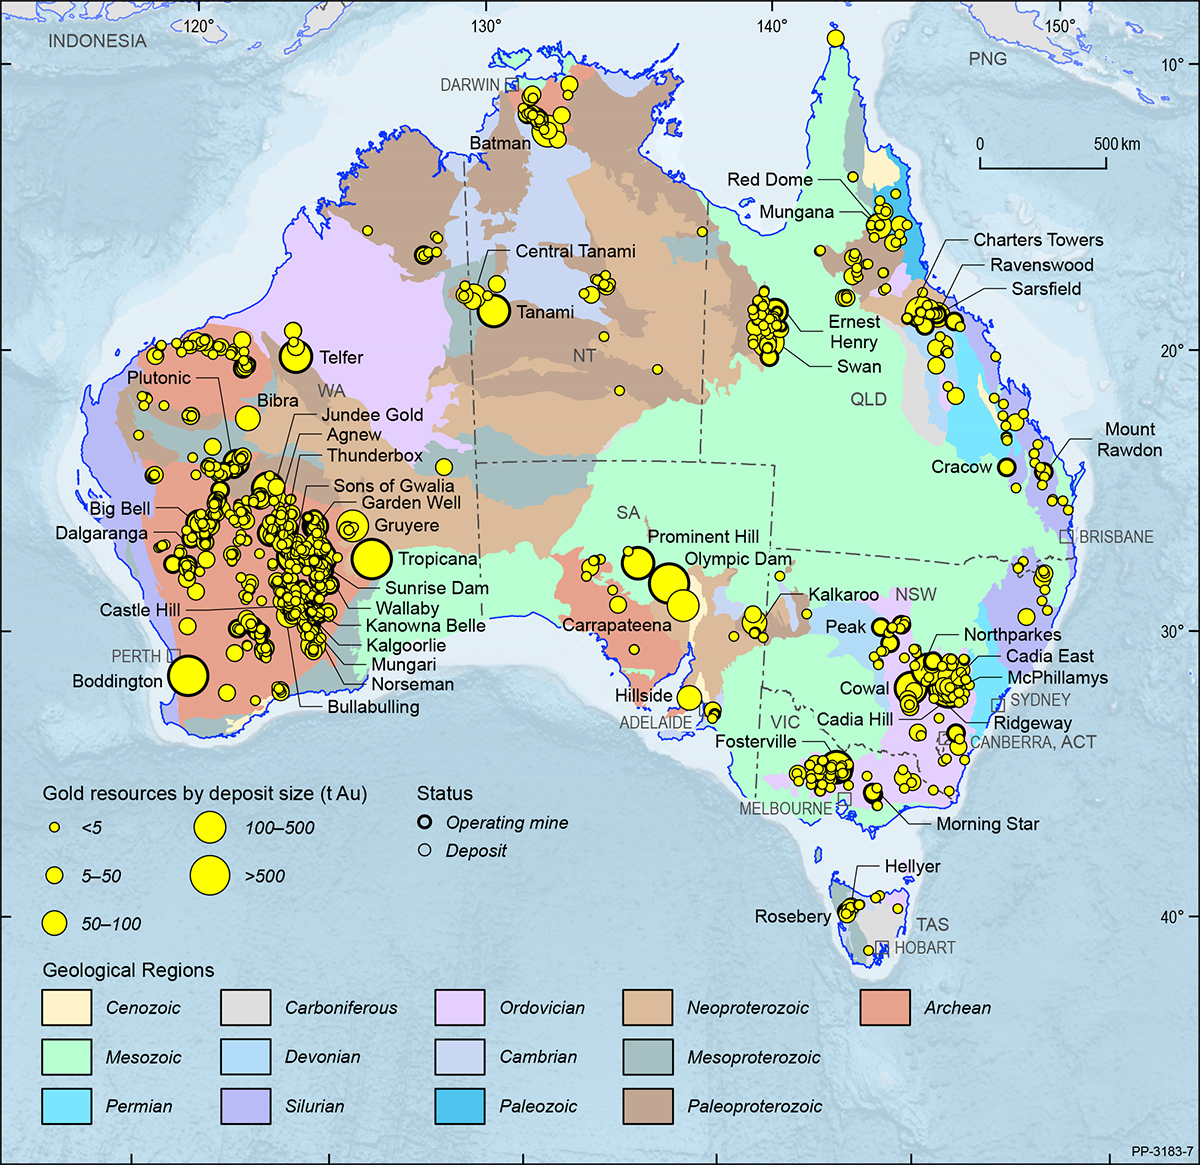
Australia’s gold resources occur in all states and the Northern Territory (Figure 12). In 2018, EDR of gold increased 95 t to 10 165 t (Table 3), up by 1% from 2017 (Table 4). Western Australia has the largest share of EDR (44%), followed by South Australia (25%) and New South Wales (16%): collectively, these three states hold slightly less than 86% of the national EDR (Figure 2). Based on estimates provided by the USGS and adjusted for Australia by Geoscience Australia, world economic resources of gold in 2018 were 54 000 t (Table 3). Australia, with EDR of 10 165 t, or slightly less than 19% of world resources (Table 8), has the largest share ahead South Africa with 6000 t (11%), Russia with 5300 t (10%) and the United States with 3000 t (6%).
Paramarginal Resources of gold declined by 28 t to 157 t in 2018. Submarginal Resources increased by 138 t in 2018 to 200 t. Inferred Mineral Resources of gold in Australia had an increase of 641 t, or 14%, to total 5268 t (Table 3). Western Australia’s Inferred Mineral Resources remain the largest of any state or territory at 2615 t, followed by South Australia with 1206 t and Queensland with 710 t.
Total Ore Reserves reported in compliance with the JORC Code increased by 149 t in 2018 to 4018 t (Table 2) and comprised 40% of EDR (Table 6). Ore Reserves at operating mines, based on 2018 production rates, have a reserve life of 9 years, which extends to 13 years when reserves at other deposits are included.
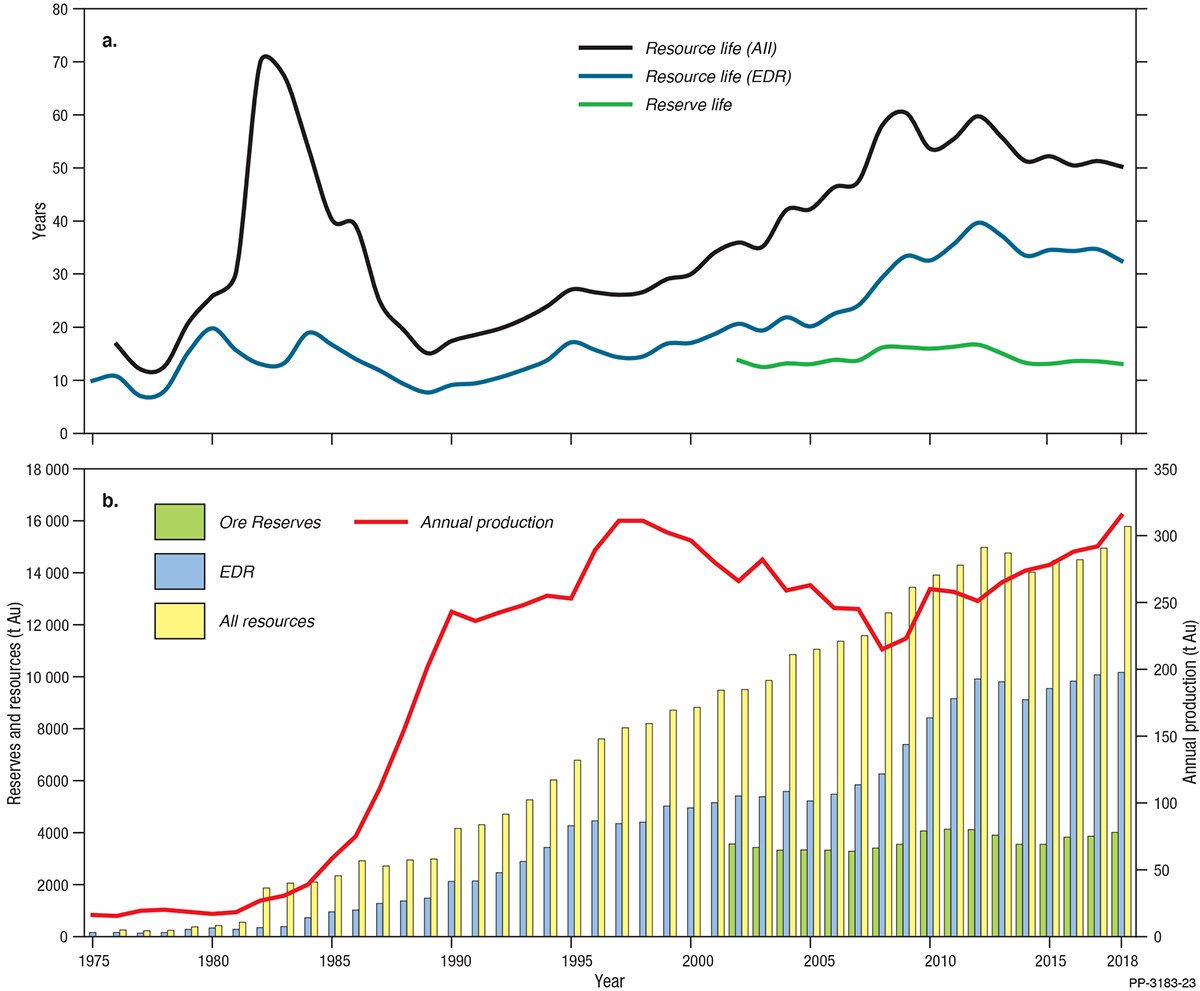
Reserve/resource life is a snapshot in time derived by taking a reserve or resource number and dividing it by a production number. Resource life for Australian gold dramatically increased, briefly, during the early 1980s as the introduction of new gold extraction technologies stimulated exploration (Figure 13). It then declined rapidly as gold production surged 800% from 27 t in 1982 to 243 t in 1990. Since 1990, resource life for gold has generally trended upward as new resource delineation has outpaced increases in production. It is only since 2012 that gold resource life has decreased owing to favourable exchange rates stimulating increased production but with slower increases in new resource delineation (Figure 13).
Exploration drilling expenditure for gold reached an all-time high in 2018 increasing by 19% from 2017 ($892.1 million). This is higher than the previous peak of $740.9 million in 2012. Gold had the highest exploration expenditure of all commodities in 2018, ahead of iron ore ($300.9 million) and copper ($260.8 million) reflecting the strong price of gold in Australian dollars, which had a monthly average price of $1697/oz in 2018, $56/oz higher than in 2017.
Domestic mine production increased by 23 t in 2018 to 315 t (Table 1). Western Australia maintained the highest output of gold at 211 t. New South Wales gold production retained second position at 39 t and Queensland had the third highest production at 18 t. As a percentage, Western Australia’s share of production was 67% followed by New South Wales (12%) and Queensland (6%). According to the USGS, the world produced 3260 t of gold from mining in 2018 (Table 3). Thus, Australia’s mine production of 315 t accounts for 10% of world production (Table 8) and was second to that of China (12%), but ahead of the Russia (9%) and the USA (6%). In 2018, Australia exported 341 t gold valued at $18 856 million (Table 11).
Australian gold deposits can be grouped into a number of geological or metal-association types with differing contributions to production and resources. In 2018, lode-gold deposits (e.g, Kalgoorlie Super Pit) yielded 216 t or 69% of Australian mine production, more than double the next largest producing type—copper-gold deposits. Copper-gold deposits include porphyries (e.g. Cadia) and the iron oxide-copper-gold deposits (e.g. Olympic Dam). Gold output in 2018 from these deposits amounted to 77 t or 24% of national production. Production for the year from polymetallic and other deposits, including epithermal and antimony-gold deposits totalled 22 t (7% of national production).
Iron Ore
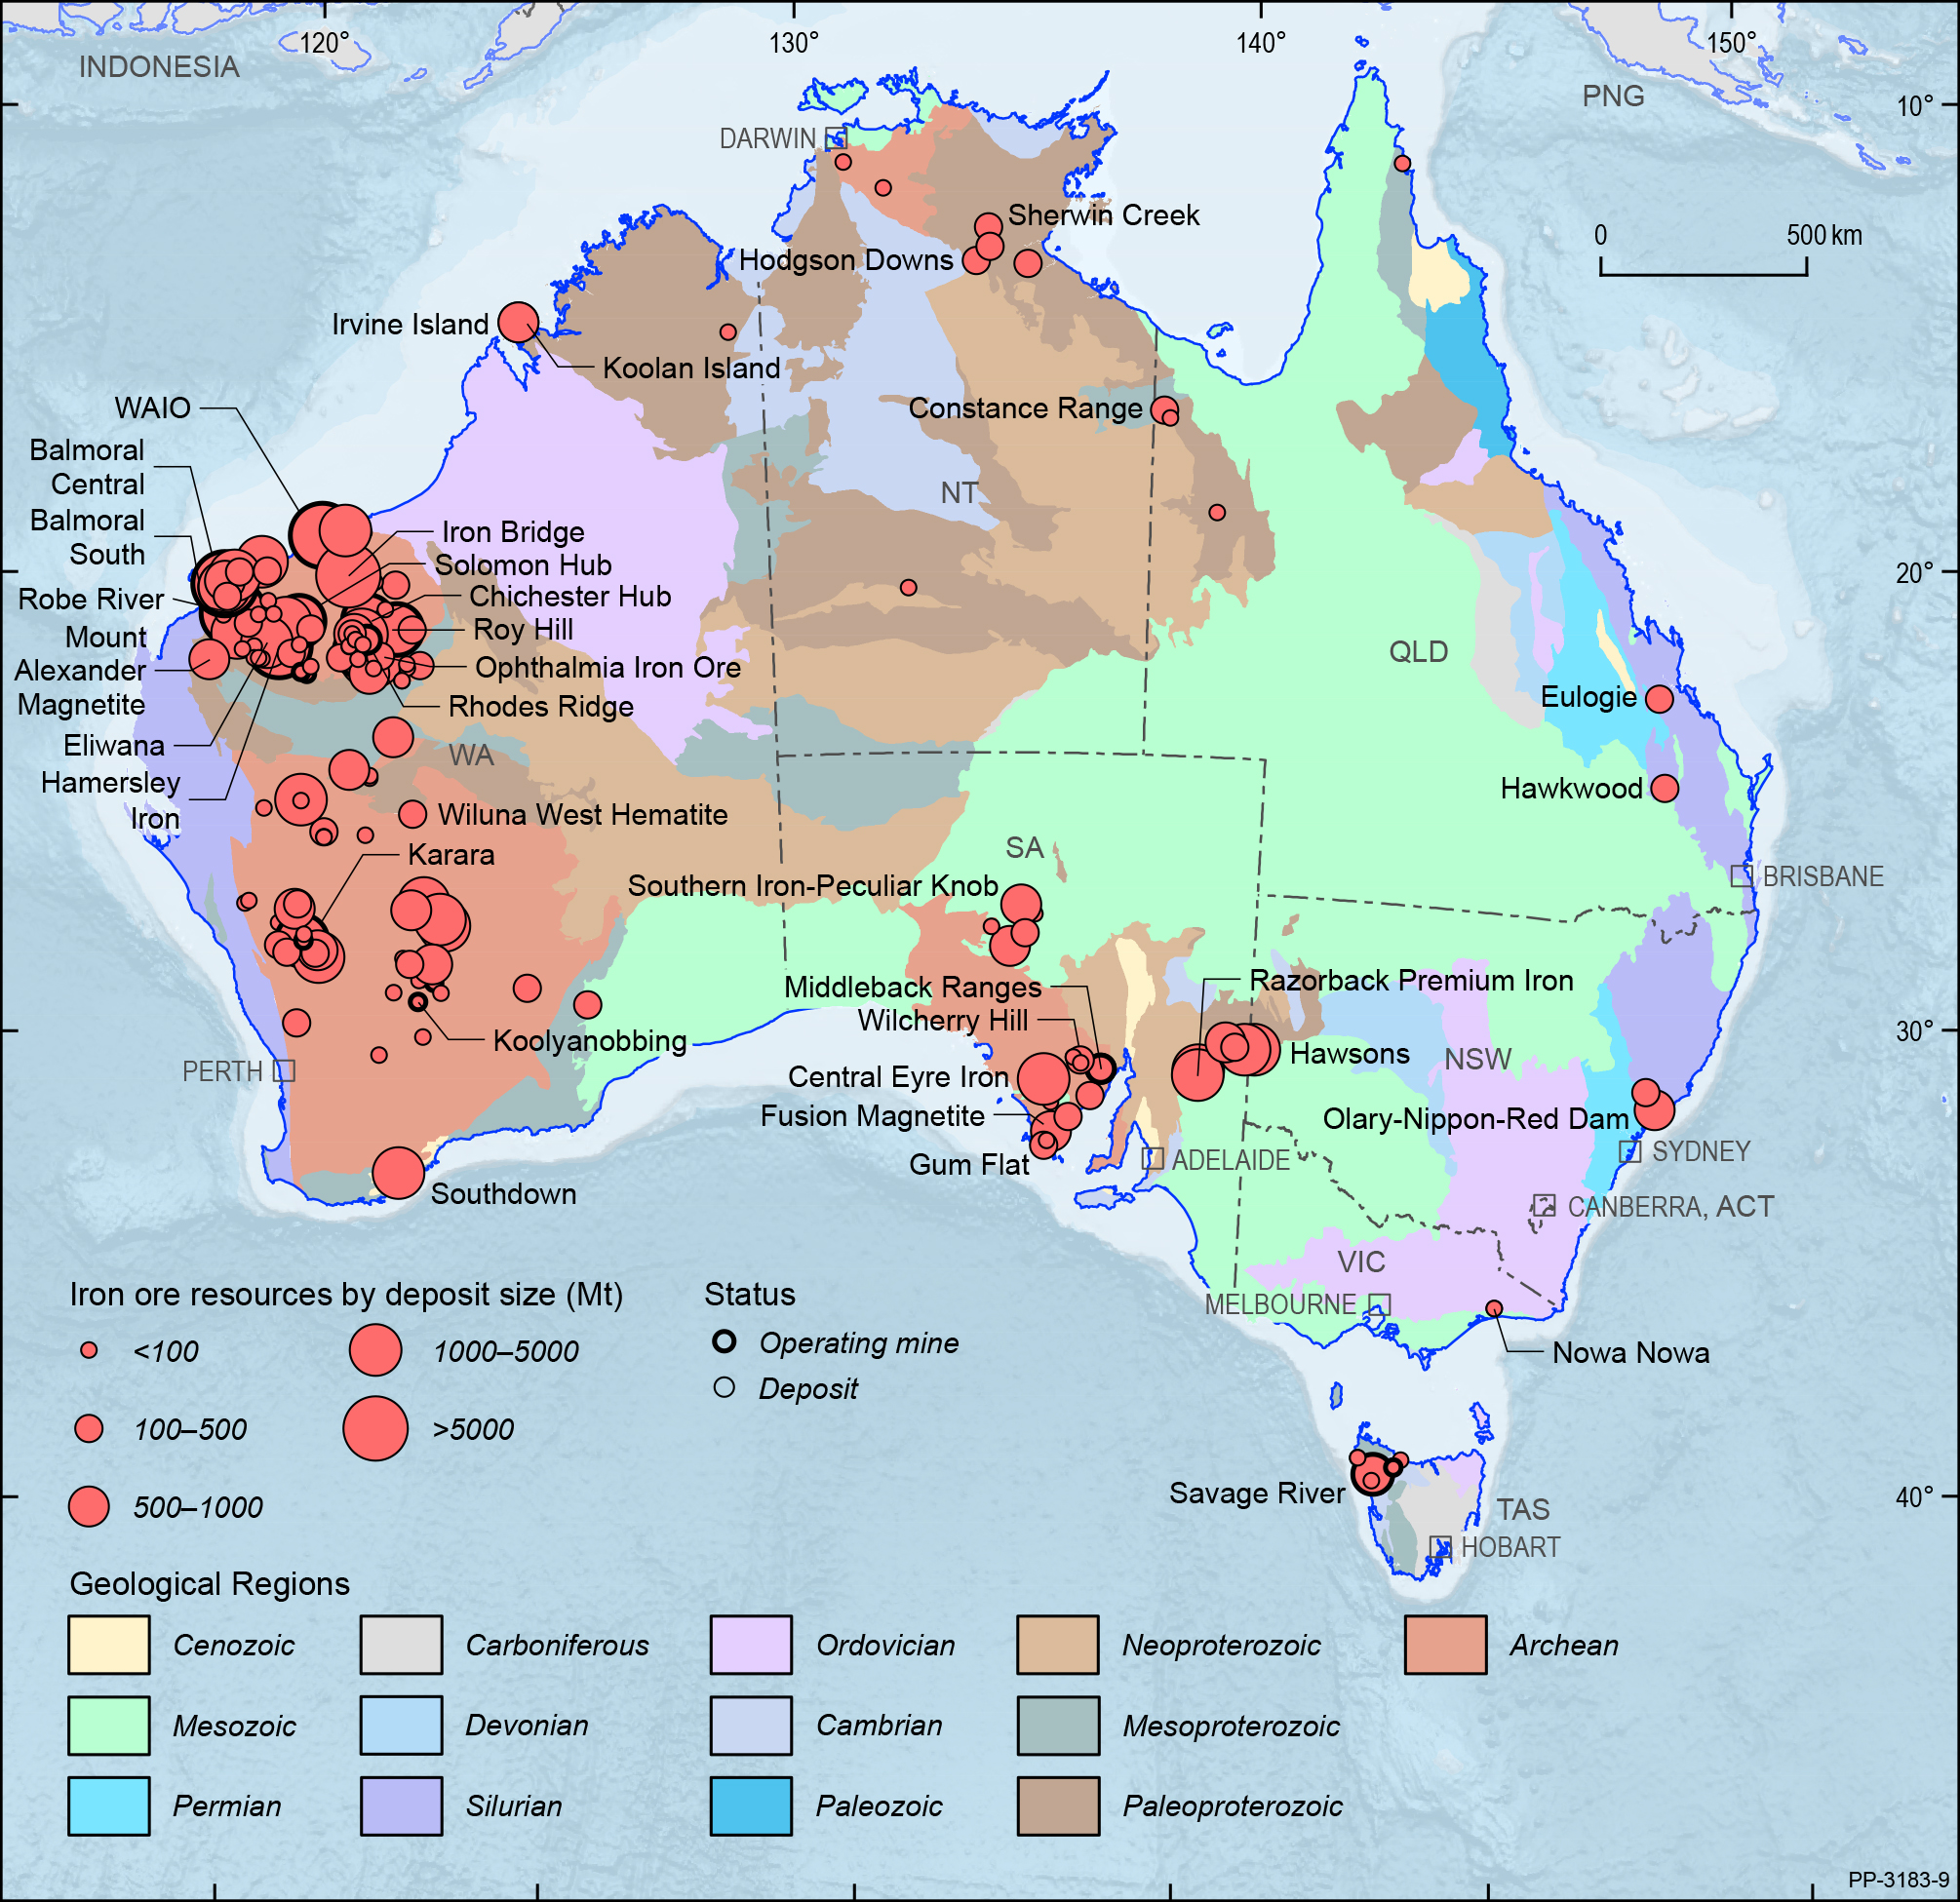
Australia’s EDR of iron ore increased by 3% to 49 604 Mt during 2018 (Table 4) with the EDR of contained iron estimated to be 24 122 Mt (Table 3). Of this, 92% of EDR occurs in the Pilbara region of Western Australia. Major deposits are shown in Figure 14 on a total resource basis. The slight increase in iron ore resources in the Pilbara was the upshot of regional project expansion and developments by Australia’s major producers—BHP Ltd, Rio Tinto Ltd and Fortescue Metals Group Ltd.
The market price of iron ore recovered marginally during late 2018 and, although remaining volatile, it was enough to encourage project owners to embark on expansions and new developments. For instance, a US$2.9 billion development of the South Flank project was announced by BHP in June 2018. Product output from this project will replace the 80 million tonnes per annum (Mtpa) production at the company’s depleting Yandi mine. Another project approval during the period was Fortescue’s US$1.275 billion Eliwana project. Output from the Eliwana operation will ensure Fortescue maintains its minimum production rate of 170 Mtpa. Also adding to the new mine developments in the region is Rio Tinto’s Koodaideri iron ore mine. The projected capacity at Koodaideri is around 43 Mtpa with production expected in late 2021. The previously halted Koolan Island mine by Mount Gibson Ltd has also re-started with the operation’s first ore sale reported in early 2018. The main pit at Koolan Island has a JORC-compliant Ore Reserve of 21 Mt at a grade of 65.5% Fe and it is expected to be mined over the next five and half years.
At end of December 2018, Australia’s identified magnetite resource was 18 356 Mt, representing 37% of the national iron ore EDR. Not unexpectedly, most of the magnetite EDR also occurs in Western Australia (80%), followed by South Australia (13%), with the remaining resource occurring in Tasmania, New South Wales and Victoria. Australia’s JORC Inferred Resources have also increased marginally (2%) to 94 100 Mt. Correlative to the EDR, the Inferred Resource increases were generated from resource drilling at brownfield projects rather than from greenfield exploration.
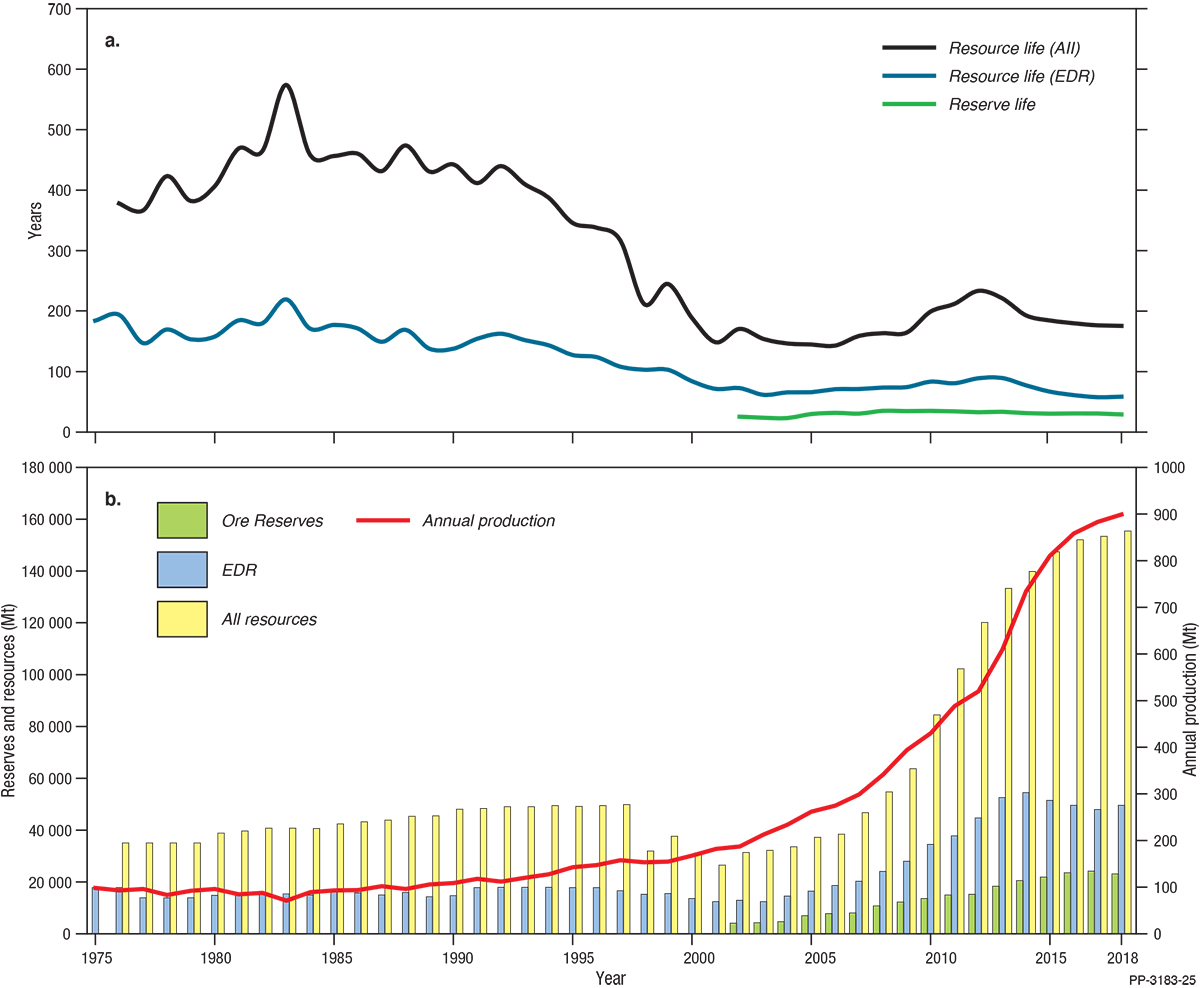
Reserve or resource life is a snapshot in time derived by taking a reserve or resource number and dividing it by a production number. Resource life for iron ore is expected to fluctuate as mine production responds to market demand. This is clearly seen with the falling resource life for iron ore from the 1980s to around the turn of this century as new resource discoveries were outpaced by rising production (Figure 15). It is only since 2003 that exploration drilling has added to the resource base enabling resources to keep pace with rising production.
In 2018, total Australian production of iron ore was 899 Mt (Table 1) with Western Australia producing 897 Mt, or 99%. Iron ore expenditure in Australia during 2018 was $300.9 million, accounting for 14% of Australia’s total mineral exploration expenditure.
Australia has the world’s largest EDR of iron ore (29%; Table 8), followed by Brazil (18%). Australia also ranks first for global production of iron ore, accounting for 36% in 2018, followed by Brazil (20%) and China (14%) (Table 8).
Lead, Zinc and Silver
Australia’s EDR of lead were 35.78 Mt in 2018 (Table 3), down 2% from 36.42 Mt in 2017 (Table 4). Australia ranks first globally with 38% of the world’s economic resources (Table 8), and second for production (11%; Table 8), behind China (47%).
Australia’s EDR of zinc were 66.96 Mt in 2018 (Table 3), down 1% from 67.52 Mt in 2017 (Table 4). Australia ranks first globally with 29% of the world’s economic resources (Table 8), and third for production (9%; Table 8), behind China (33%) and Peru (12%).
Australia’s EDR of silver were 88.36 kt in 2018 (Table 3), down 2% from 90.31 kt in 2017 (Table 4). Australia ranks third globally with 16% of the world’s economic resources (8), behind Chile and Poland, and sixth for production (5%; Table 8), behind Mexico (23%), Peru (16%), China (13%), Chile (5%) and Poland (5%).
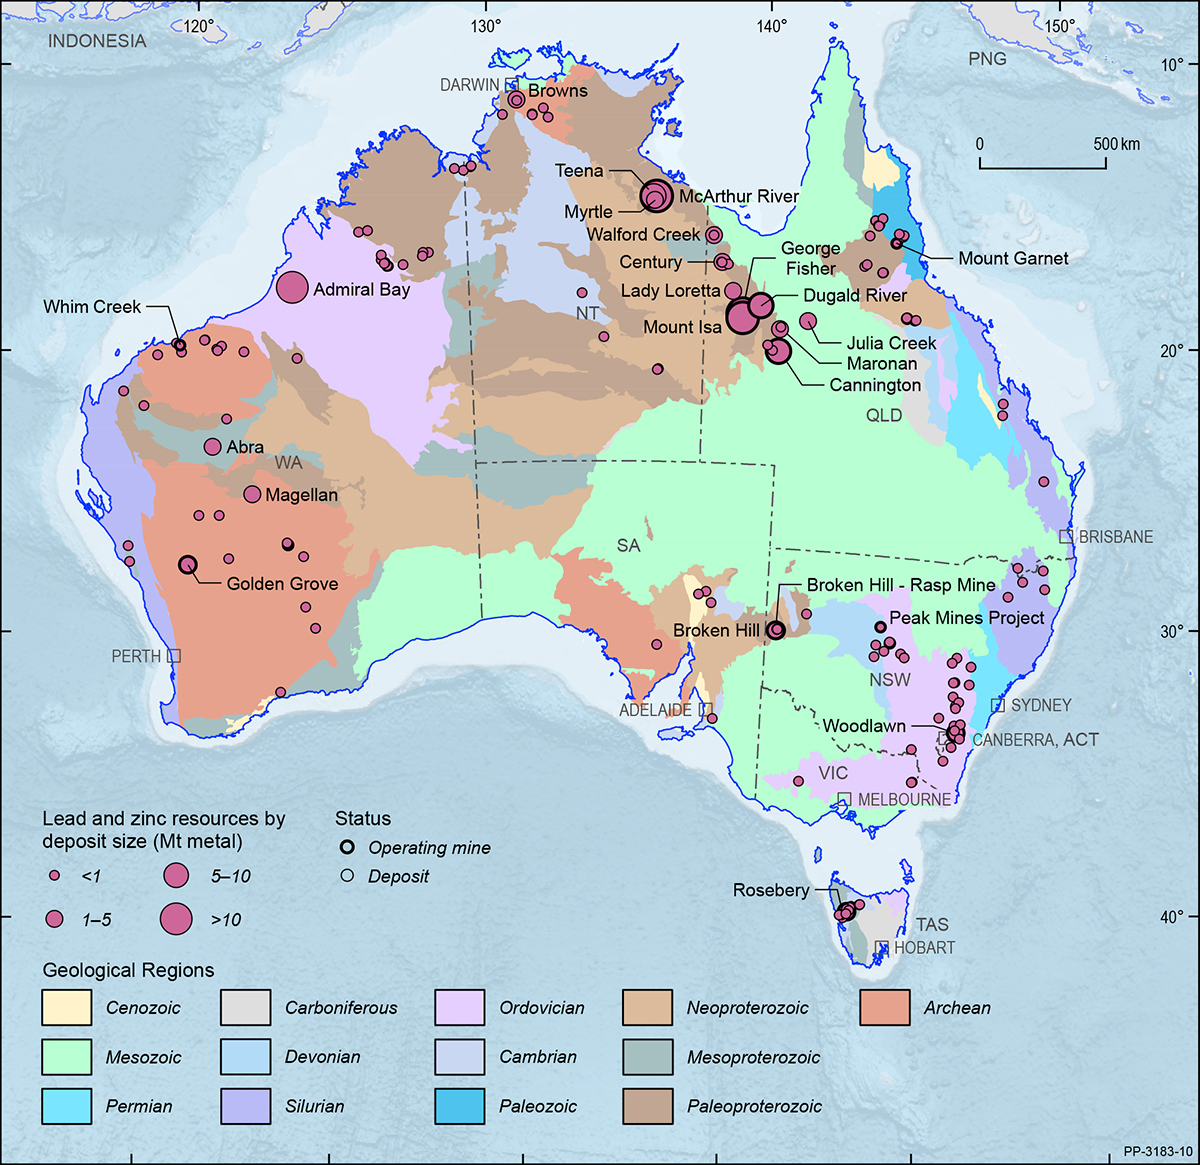
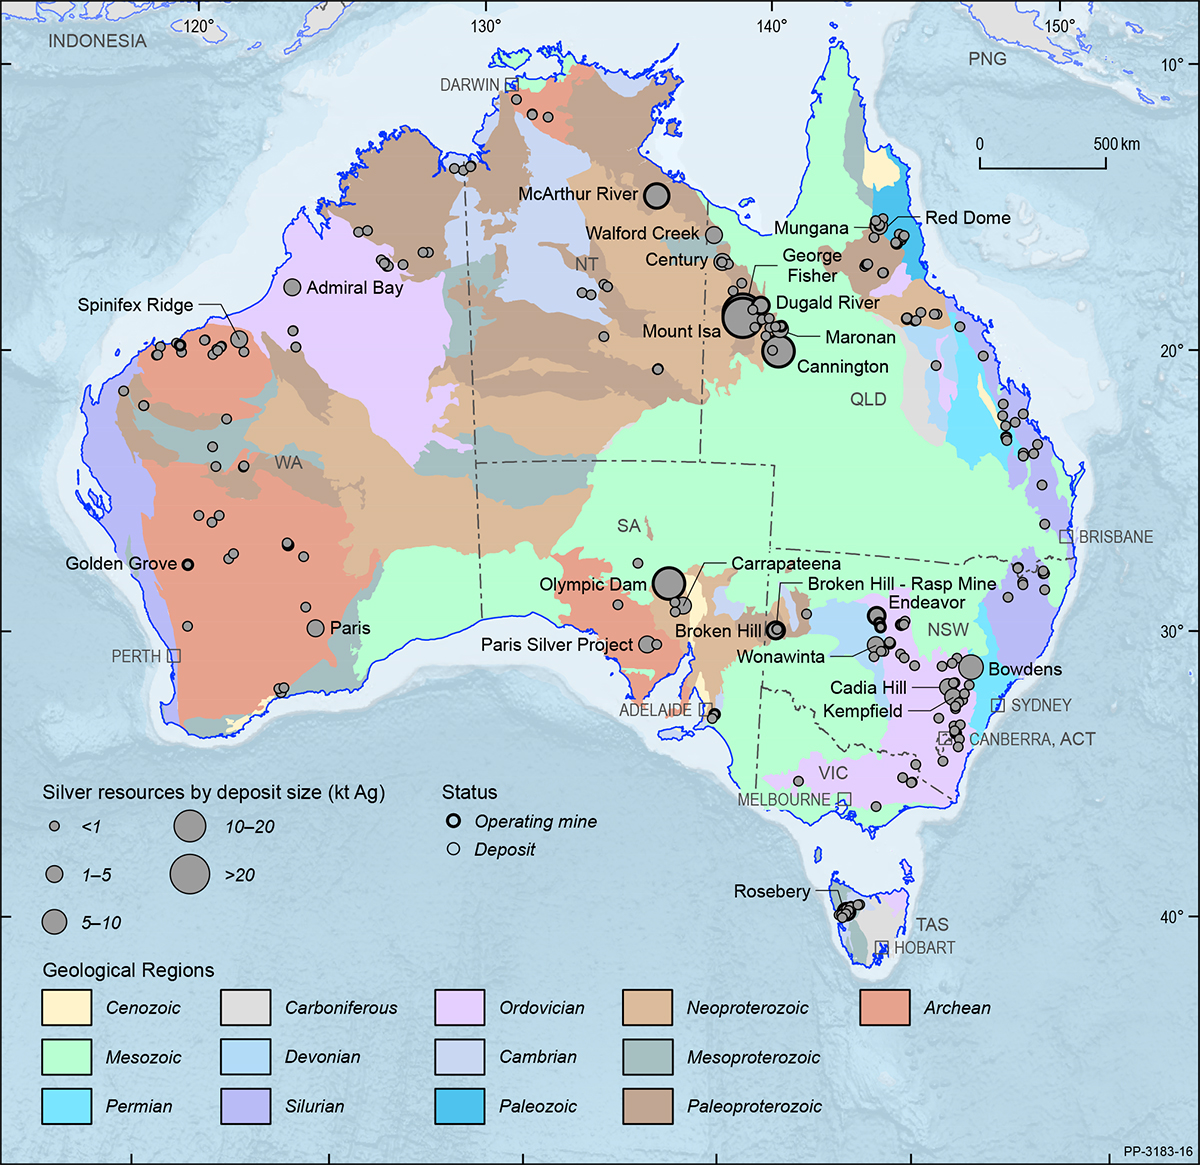
Operating mines and deposits for lead and zinc are shown in Figure 16 and silver in Figure 17, on a total resource basis. Virtually all of Australia’s EDR of zinc, lead and silver occur within hard-rock sulphide deposits, with resources in all states and the Northern Territory, but with the largest proportion of EDR for all three metals in Queensland (Figure 2). The Carpentaria Zinc Belt, which extends from northwest Queensland into the northeast Northern Territory is the largest repository of zinc-lead-silver deposits in Australia, including the major George Fisher-Hilton and McArthur River mines as well as some smaller, but still globally significant, deposits.
Between 2012 and 2016, five major global zinc deposits, including the Century and Black Star (Mount Isa) deposits in Queensland, closed. In 2015, Glencore Pty Ltd decreased its global zinc production by one third, partly from deposits in northern Australia. The closures and decreased zinc (and lead) production initially resulted in increasing zinc and lead prices until mid-2018.
Exploration spend has increased over the last two years since the trough in expenditure from 2014 to 2016. Exploration for zinc, lead and silver deposits in Australia since 2012 has been geographically targeted, with much of the exploration concentrated in the Carpentaria Zinc Belt. Other areas that have produced significant results include other parts of the Northern Territory, western and central New South Wales and northeastern Queensland. The most significant discovery in the last decade was the Teena deposit near McArthur River, discovered in 2013. The Walford Creek deposit has also seen significant exploration and an upgrade to resources, which include copper and cobalt in addition to zinc, lead and silver. In New South Wales, the Woodlawn and Hera zinc-lead-silver mines have (re)opened since 2012, and exploration in the Cobar region has seen some significant discoveries.
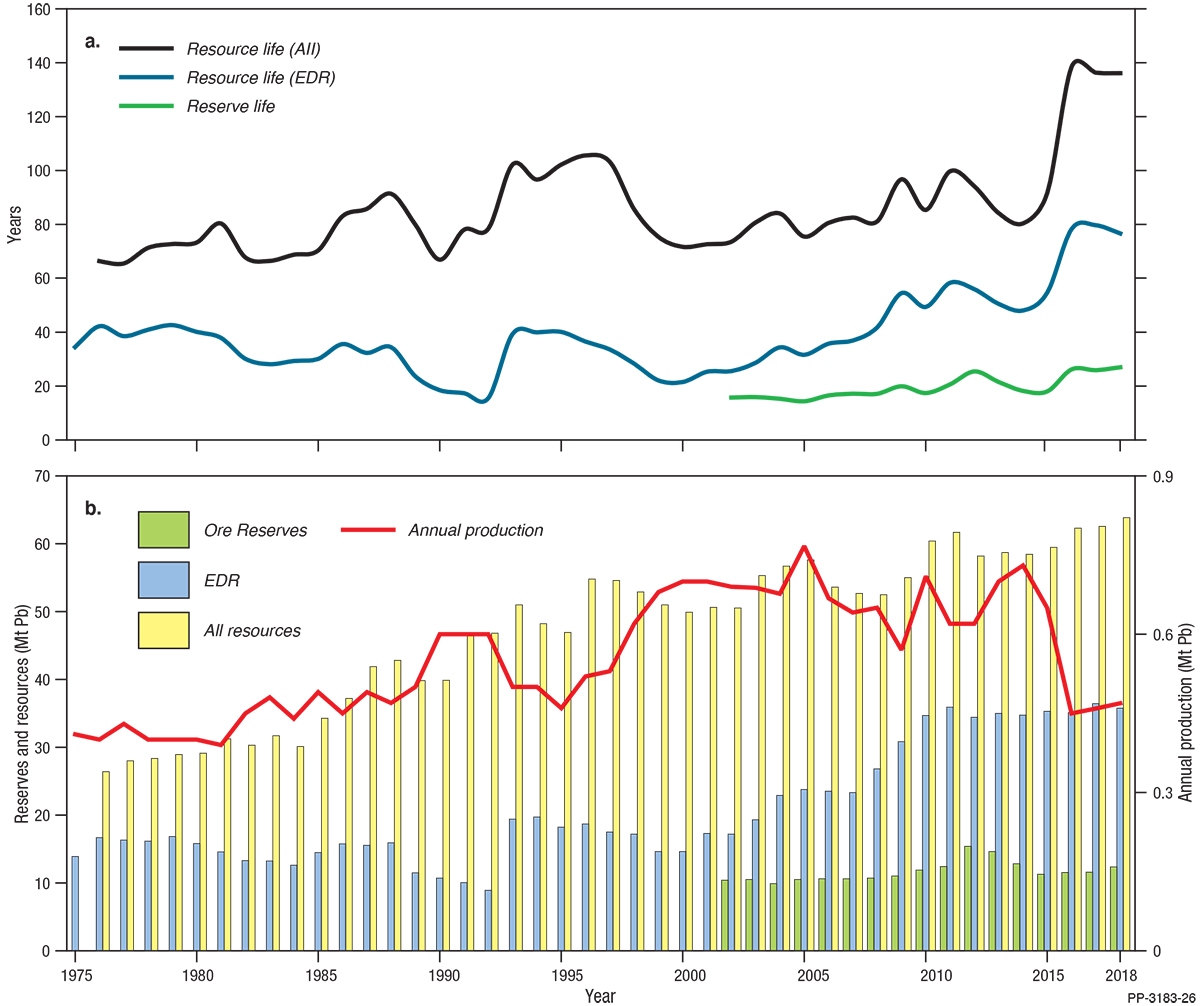
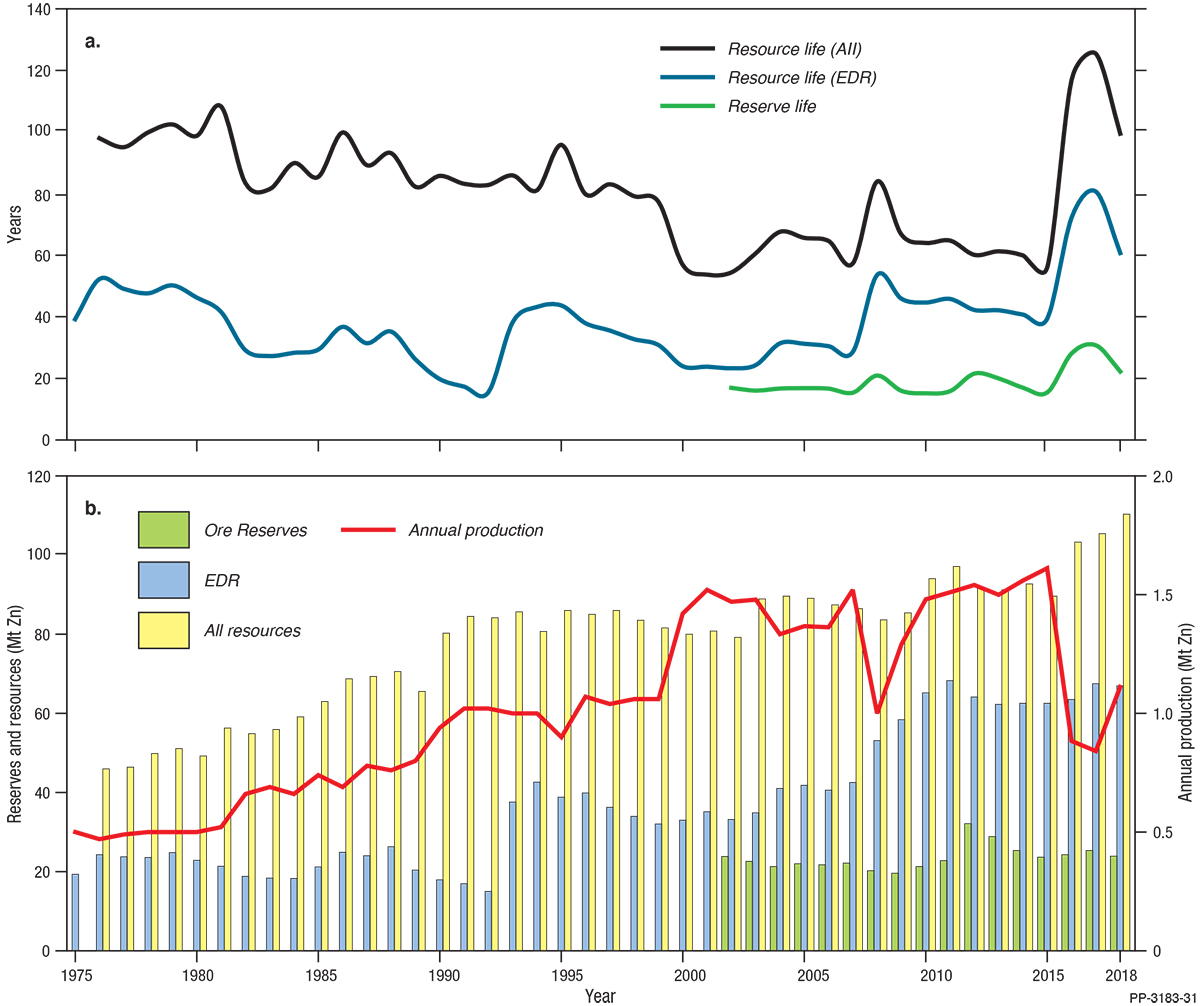
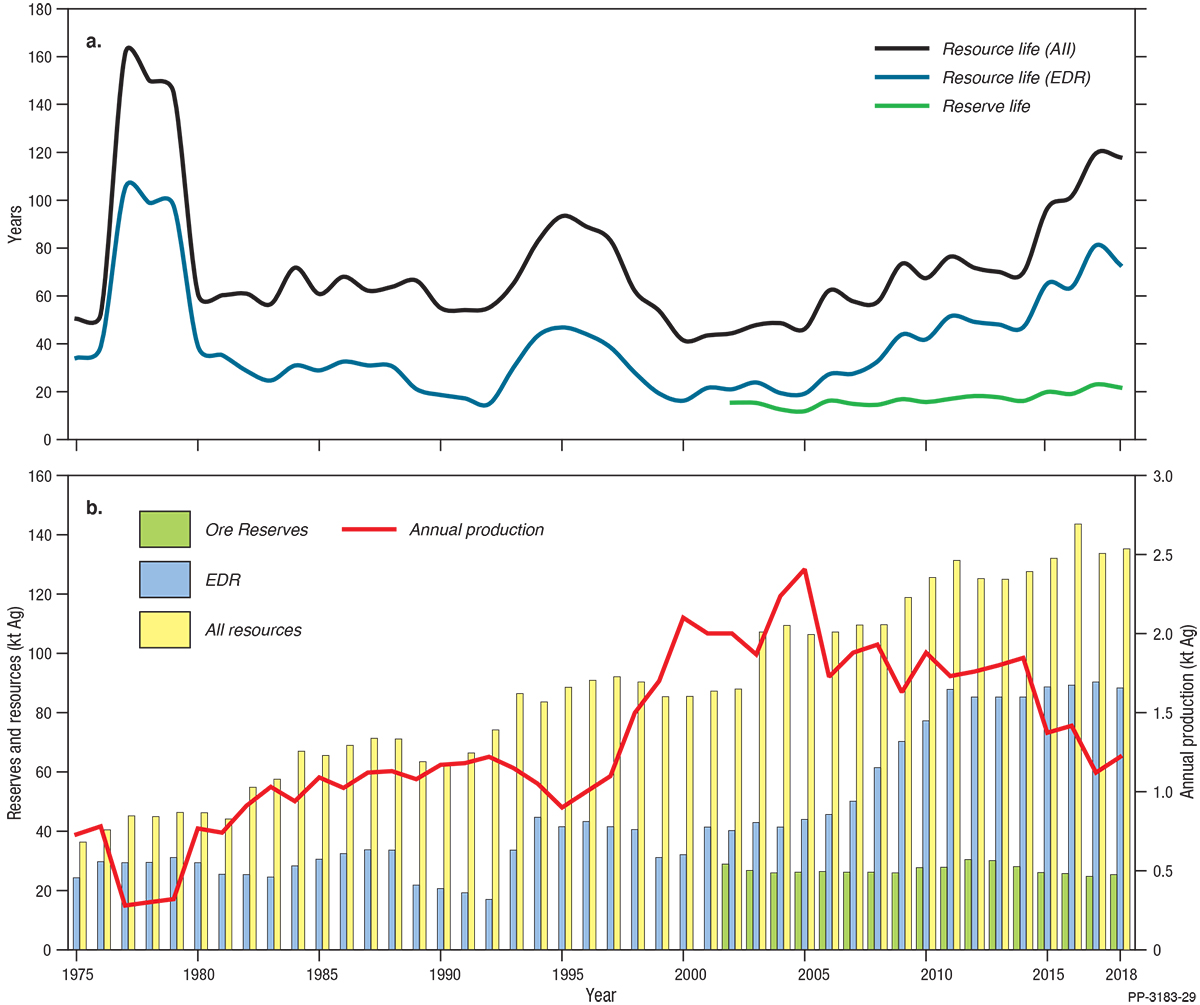
Ore Reserves of zinc, lead and silver (Table 2) have remained relatively constant over recent years (Figure 18, Figure 19, Figure 20). Reserve life, the ratio of reserves to production, was 22, 26 and 21 years for zinc, lead and silver, respectively (Table 9). The 2018 reserve life for zinc is significantly lower than that of 2017 and reverses a trend of increasing reserve life since 2015 (Figure 19). This is due mostly to increased production, but also to the minor fall in Ore Reserves. For lead, the reserve life is similar to 2016 and 2017: changes in production and reserves were small and offsetting (Figure 18). For silver, 2018 reserve life (21 years) is similar to 2017 (22 years), and follows a broad trend of increasing reserve life since 2005 (Figure 20). The overall increase in reserve life for all three metals since 2015 is largely owing to the decision to decrease production by Glencore at that time.
Lithium, Tantalum and Niobium
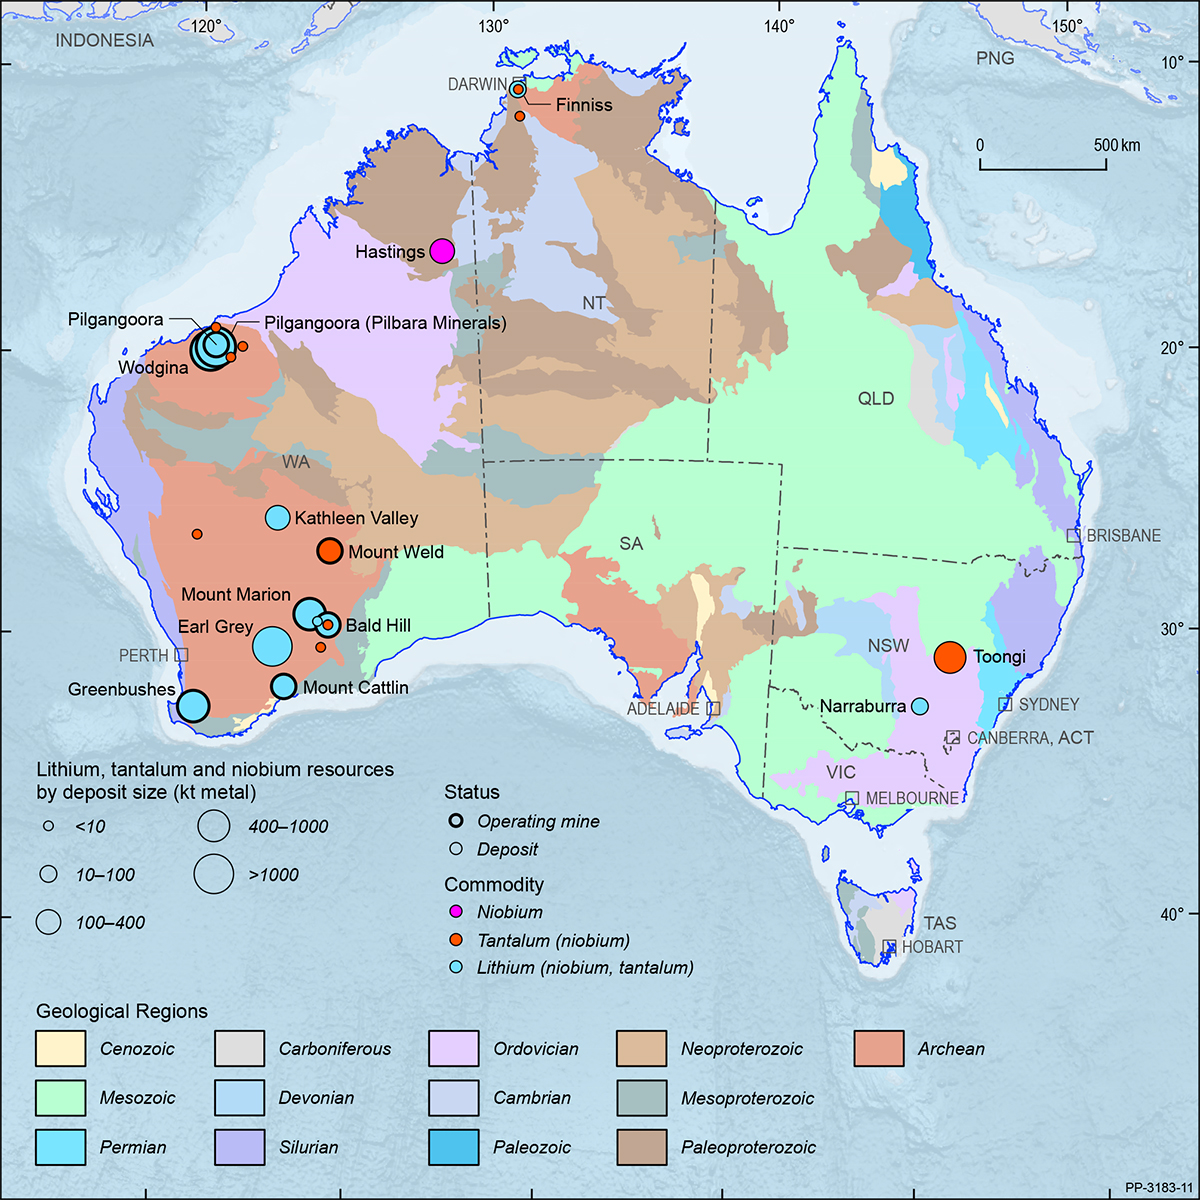
Australia’s EDR of lithium were 4718 kt in 2018 (Table 3), up 68% from 2803 kt in 2017 (Table 4). Australia ranks second globally with 30% of the world’s economic resources (Table 8), behind Chile, and first for production (63%; Table 8). All of Australia’s EDR of lithium occur within hardrock pegmatite deposits and most deposits occur in Western Australia. Over 85% of Australia’s lithium EDR is hosted by four deposits: Greenbushes, Wodgina, Pilgangoora (Pilbara Minerals Ltd) and Earl Grey. Other resources occur at: Mount Cattlin, Mount Marion, Bald Hill and Kathleen Valley in the Yilgarn region of Western Australia; at Wodgina and Pilgangoora (Altura Ltd) in the Pilbara region of Western Australia; and at the Grants deposit (Finniss Project) in the Northern Territory. Operating mines and deposits are shown in Figure 21 on a total resource basis.
Over the last five years, there has been heightened activity in the Australian lithium industry with significant increases in resources as well as the commencement of production from a number of deposits in Western Australia: Wodgina, Pilgangoora (both deposits), Mount Cattlin, Mount Marion and Bald Hill, in addition to continuing production at Greenbushes. Both Chengdu Tianqi Industry Group Co and Albemarle Corp (owners of the Greenbushes deposit) are in the process of building processing plants in Western Australia, utilising their respective shares of the lithium concentrate from the Greenbushes deposit to produce (higher value) battery-grade lithium hydroxide.
The relatively rapid growth in lithium in Australia is also evidenced by the large increases in total resources (>1000%) over the last ten years, for which total Ore Reserves have increased by more than 2000% and EDR by more than 800%. Increases in annual production have also been significant, up 20% since 20178, and over nine times as much as a decade ago. Ore Reserves at operating mines, based on 2018 production rates, have a reserve life of 47 years which extends to 59 years when Ore Reserves at other deposits are included (Table 9).
Softer demand and lower prices for lithium in 2019 has seen both production decreases and revised infrastructure timetables at a number of Australian deposits. This downturn is also expected to affect tantalum production as the majority of Australia’s EDR of tantalum occurs within the same hard-rock pegmatite deposits.
Australia’s EDR of tantalum were 99.3 kt in 2018 (Table 3) up from 55.4 kt in 2017 (Table 4) and 75.7 kt in 20169. Australia ranks first globally with 67% of the world’s documented economic resources (Table 8). However, it should be noted that the USGS figures, on which the ranking is based, do not include resource data for Rwanda, Congo, Nigeria, Brazil or China, all significant tantalum producers. Australia ranks seventh for tantalum production with 3% of the total world production (Table 8).
Western Australia hosts 88% of Australia’s EDR of tantalum, with over 61% occurring at the Greenbushes and Wodgina deposits. Other resources include the lithium pegmatites at Pilgangoora, Kathleen Valley, Mount Cattlin, Bald Hill and the Pilgangoora deposits (all in Western Australia), and at the Dubbo (Toongi) zirconium-hafnium-niobium-yttrium-rare earth deposit in New South Wales (Figure 21). Over the last two years, Australia’s tantalum Ore Reserves have increased 21% from 36.7 kt in 2016 to 44.4 kt in 2018. Similarly, tantalum production in Australia has increased by 121% over this period to 60 t in 201810. Increases in tantalum resources, reserves and production are largely a by-product of the heightened activity in the Australian lithium industry over the last five years.
Australia’s EDR of niobium were 216 kt in 2018 (Table 3), unchanged from 2017 figures (Table 4). Niobium commonly occurs within lithium-tantalum pegmatite deposits, but all of Australia’s EDR of niobium occur at two (per)alkaline deposits: the Brockman rare earth-niobium-zirconium project (also known as Hastings), in Western Australia, and the Dubbo deposit in New South Wales (Figure 21).
Although Australia ranks third in the world for economic resources of niobium, it only holds 4% (Table 8), as world resources are overwhelmingly dominated by Brazil. Australia’s total Ore Reserves of niobium, as of 2018, were 58 kt (Table 2), all from the Dubbo deposit. This is unchanged from 2017 but is a significant decrease from 116 kt of Ore Reserves in 2016. This decrease reflects a reappraisal of the Dubbo deposit, including a shift to a 20-year mine life. Annual production figures for Australia are not known but are not considered to be significant.
8 Based on spodumene production figures within The Western Australia Department of Mines, Industry Regulation and Safety, 2018-19 Major commodities resource file.
9 2016 figures are used because the 2017 figures were atypical, reflecting a temporary reclassification of EDR as Inferred Resources at the Wodgina deposit that year.
10 Based on tantalite production figures within The Western Australia Department of Mines, Industry Regulation and Safety, 2018-19 Major commodities resource file.
Magnesite
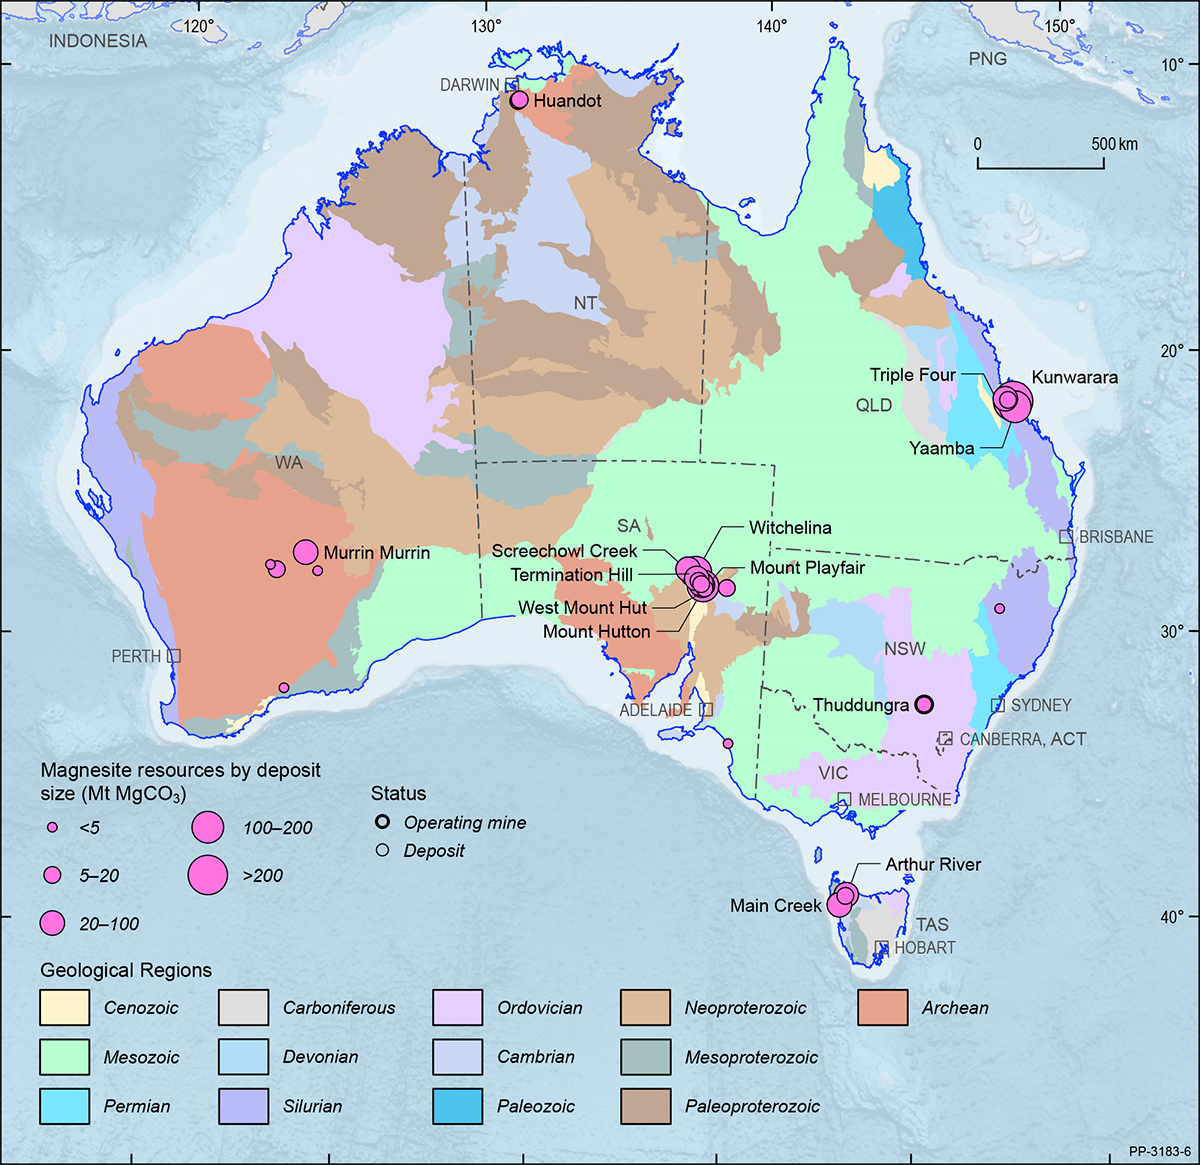
In 2018, Australia’s EDR of magnesite were 316 Mt (Table 3), unchanged from the previous year (Table 4), representing approximately 4% of the world total (Table 8). The Department of Premier and Cabinet South Australia reported magnesite production of 4587 t in 2018, significantly up (42%) from 3241 t in 2017. The Queensland Department of Natural Resources Mines and Energy reported magnesite production of 258 859 t in 2017–18, also up (25%) from 207 859 t in 2016–17. Apart from South Australia and Queensland, magnesite EDR also occur in New South Wales, Western Australia and the Northern Territory (Figure 22).
Manganese
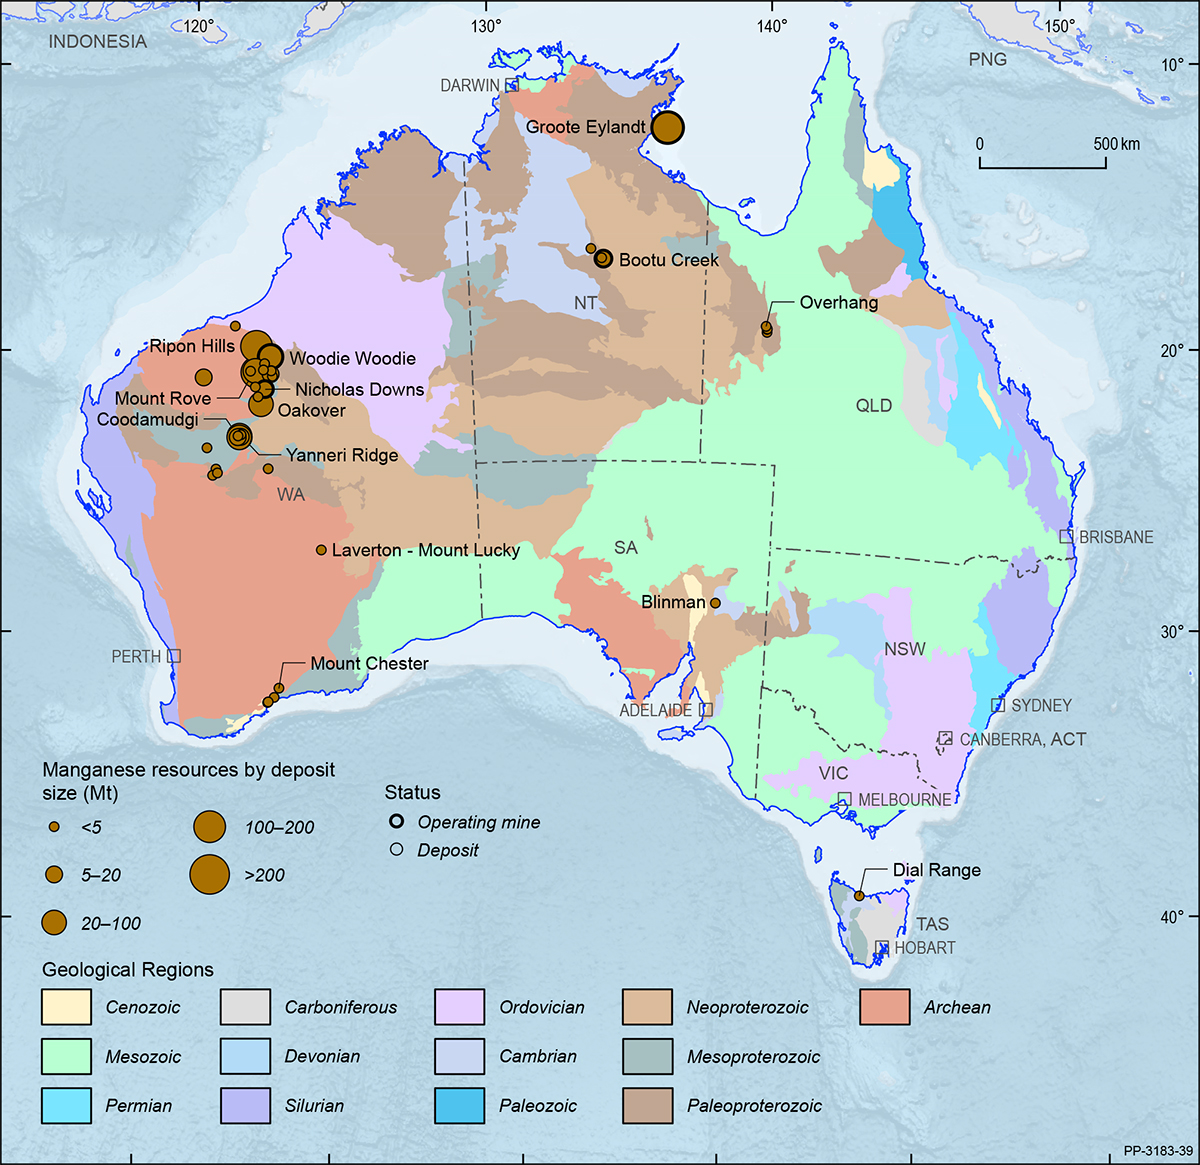
Australia’s EDR of manganese remained steady in 2018 at 232 Mt (Table 3), a small increase of 1 Mt over 2017 (Table 4). This ranks Australia’s resources as the world’s fifth largest (Table 8) behind South Africa, Ukraine, Brazil and China. All EDR of manganese ore occur in the Northern Territory and Western Australia (Figure 2), although minor deposits also occur in other Australian states (Figure 23). Australia’s mine production of manganese ore increased to 7.0 Mt in 2018, a 25% increase over the previous year’s production estimates, due to increased production at all three of Australia’s operating manganese mines—Groote Eylandt, Woodie Woodie and Bootu Creek (Table 1). Australia’s manganese ore production is ranked third (Table 8) behind China and South Africa.
Mineral Sands
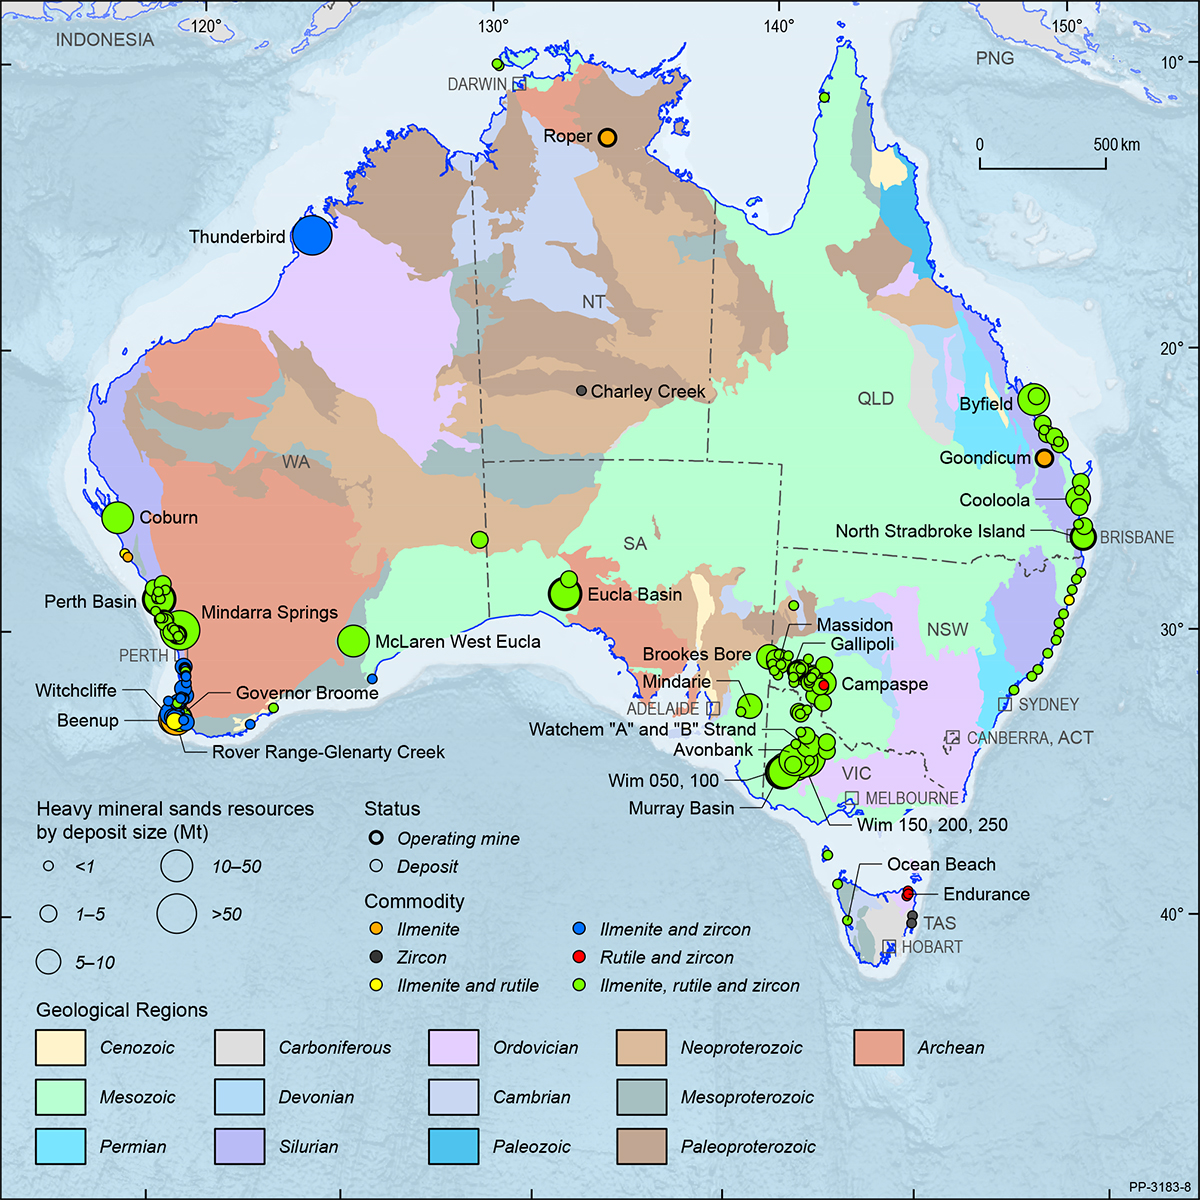
Every Australian state and the Northern Territory hosts heavy mineral sand deposits. The deposits contain a variety of minerals depending on their original source rock and the natural processes they have undergone during their formation. The main minerals of commercial interest are zircon and the titanium-bearing minerals ilmenite, rutile and leucoxene. Minor amounts of other minerals such as monazite and xenotime may also be present but are not currently exploited. The majority of Australia’s mineral sand resources are in the Murray Basin, encompassing parts of Victoria, New South Wales and South Australia; the Eucla Basin, in South Australia and Western Australia; and the Perth and Canning basins in Western Australia.
In 2018, Australia’s mineral sand EDR were estimated to be 276.3 Mt of ilmenite, 35.4 Mt of rutile and 79.9 Mt of zircon (Table 3). Compared to 2017, these estimates are largely unchanged for ilmenite and up for rutile and zircon (Table 4). These resources represent:
- the world’s second largest economic resources of ilmenite (19% of the global economic resource; (Table 8) after China (29%) and ahead of India (11%);
- the largest economic resource of rutile in the world (50%; Table 8) followed by Kenya (20%), South Africa (12%) and India (11%); and
- and the largest economic resource of zircon in the world (63%; Table 8) followed by South Africa (17%).
Australia also had Inferred Resources of 264.6 Mt of ilmenite, 35.8 Mt of rutile and 62.9 Mt of zircon plus smaller amounts regarded as subeconomic (Table 3). Heavy mineral sand deposits and operating mines are shown in Figure 24 on a total resource basis.
In terms of total Ore Reserves, Australia had an estimated 60.3 Mt of ilmenite, 8.7 Mt of rutile and 22.1 Mt of zircon in 2018 (Table 2). Twelve operating mines produced a total of 1.4 Mt of ilmenite, 10 mines produced 0.2 Mt of rutile and 10 produced 0.5 Mt of zircon (Table 1), largely unchanged from 2017 production. Ore Reserves at these mines accounted for 27%, 22% and 18% of Australia’s ilmenite, rutile and zircon Ore Reserves, respectively (Figure 1).
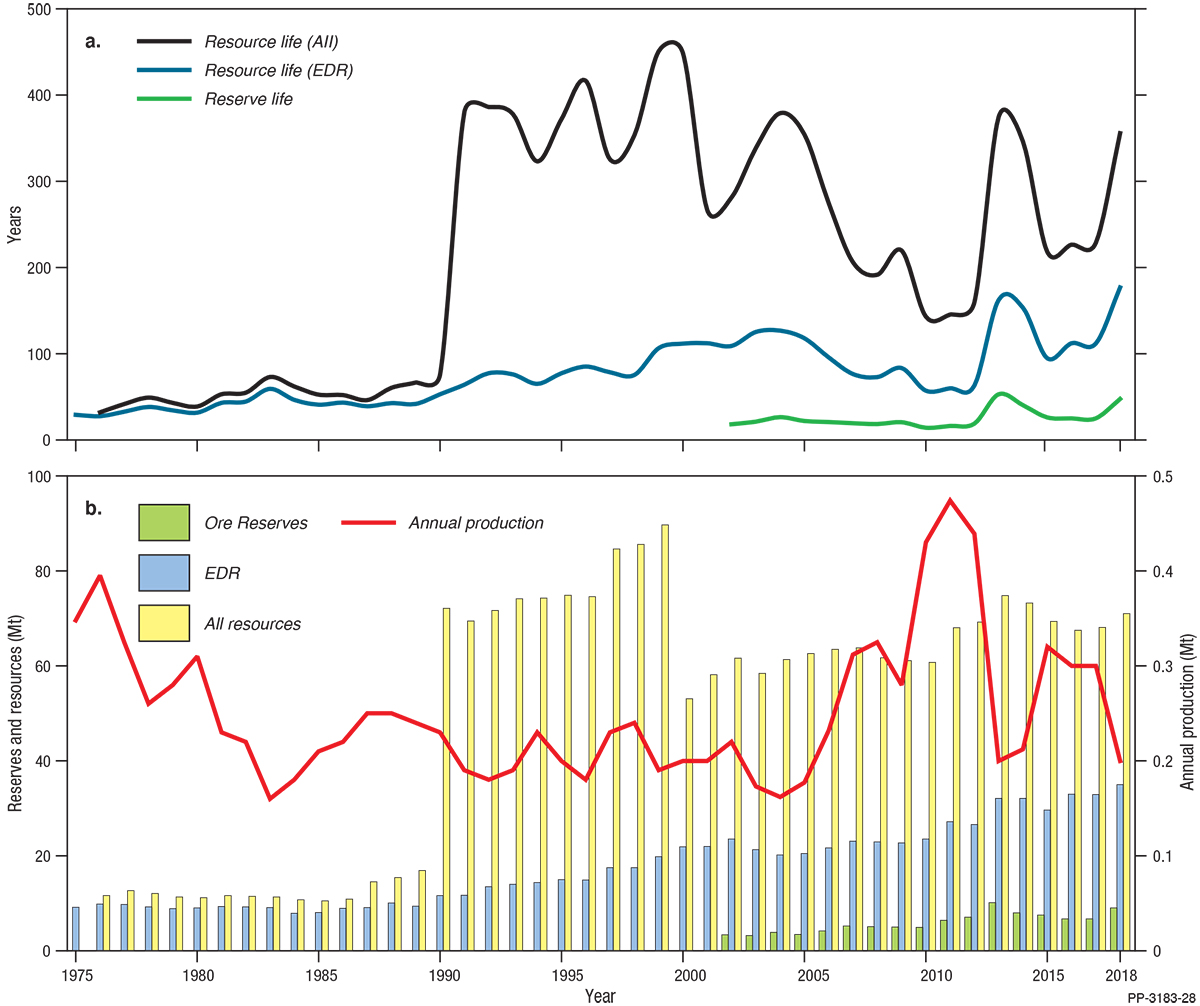
From 1990 onward, new mineral sand discoveries resulted in significant increases in mineral resource estimates (Figure 25, Figure 26, Figure 27). Initially, ilmenite production almost kept pace with the new discoveries so resource life only increased gradually (Figure 25). In the 2000s, however, lower than average production rates resulted in larger increases to resource life and, since 2011, ilmenite resource life has again been boosted with new resource delineation combining with dramatically decreased production from 2014 (Figure 25).
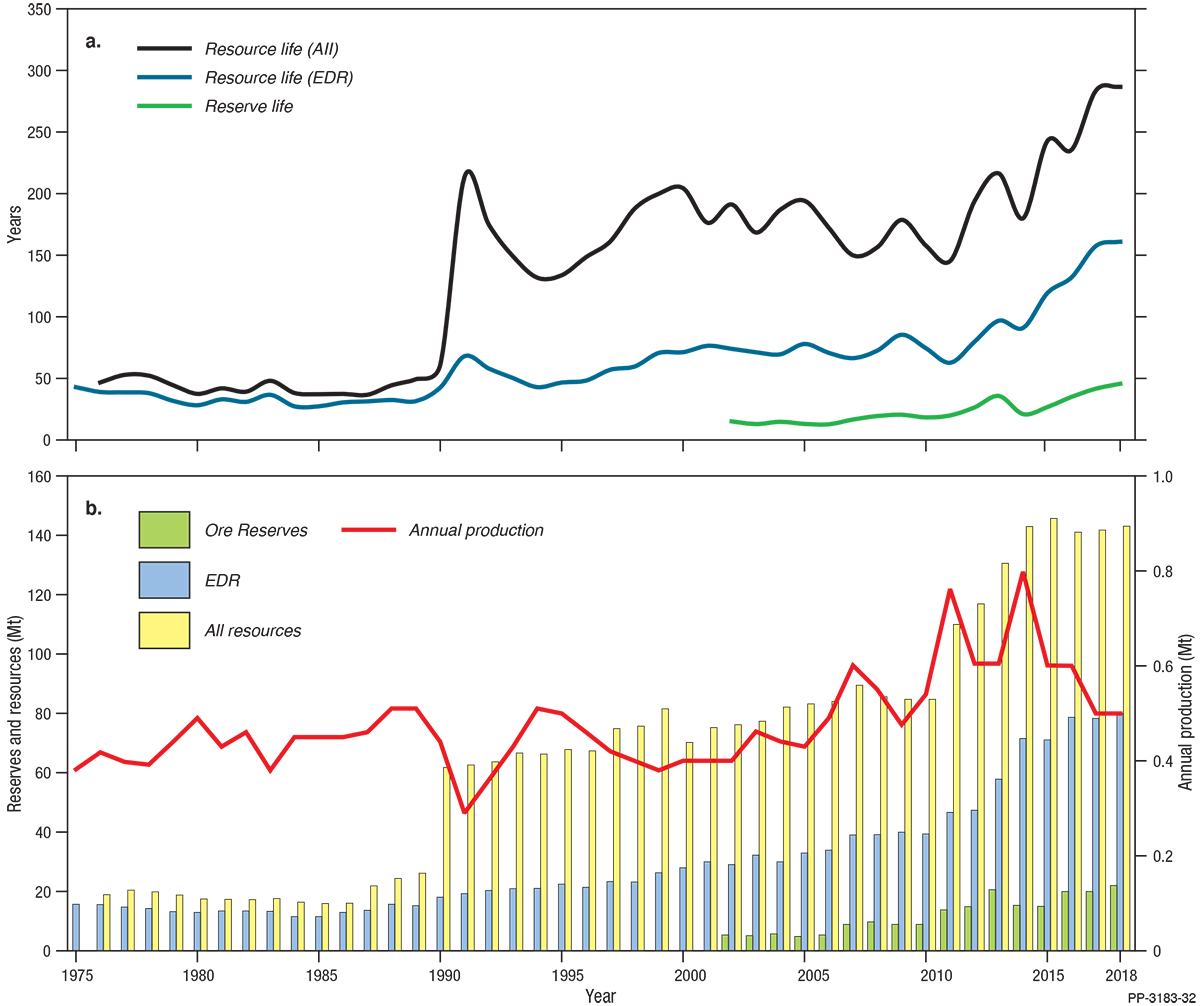
Unlike ilmenite, production rates for rutile and zircon from around 1987 to 2006 decreased slightly or were steady, although these minerals also had increased resource estimates (Figure 26 and Figure 27). As a result, the significant increases in resources estimates from around 1990 caused dramatic increases in resource life (Figure 26 and Figure 27). Since 1990, the resource life for rutile and zircon has increased and decreased conspicuously in response to variable production rates (Figure 26 and Figure 27). Increased zircon resource delineation since 2011 has also contributed to the most recent increase in resource life (Figure 27).
Exploration expenditure for mineral sand exploration during 2018 was approximately $34.5 million, an increase of almost 66% since 2017 ($20.8 million). In 2018, an estimated 804 kt of ilmenite concentrate, 312 kt of rutile concentrate and 617 kt of zircon concentrate were exported from Australia, down 17%, up 9% and up 9%, respectively, on 2017 export figures.
Molybdenum
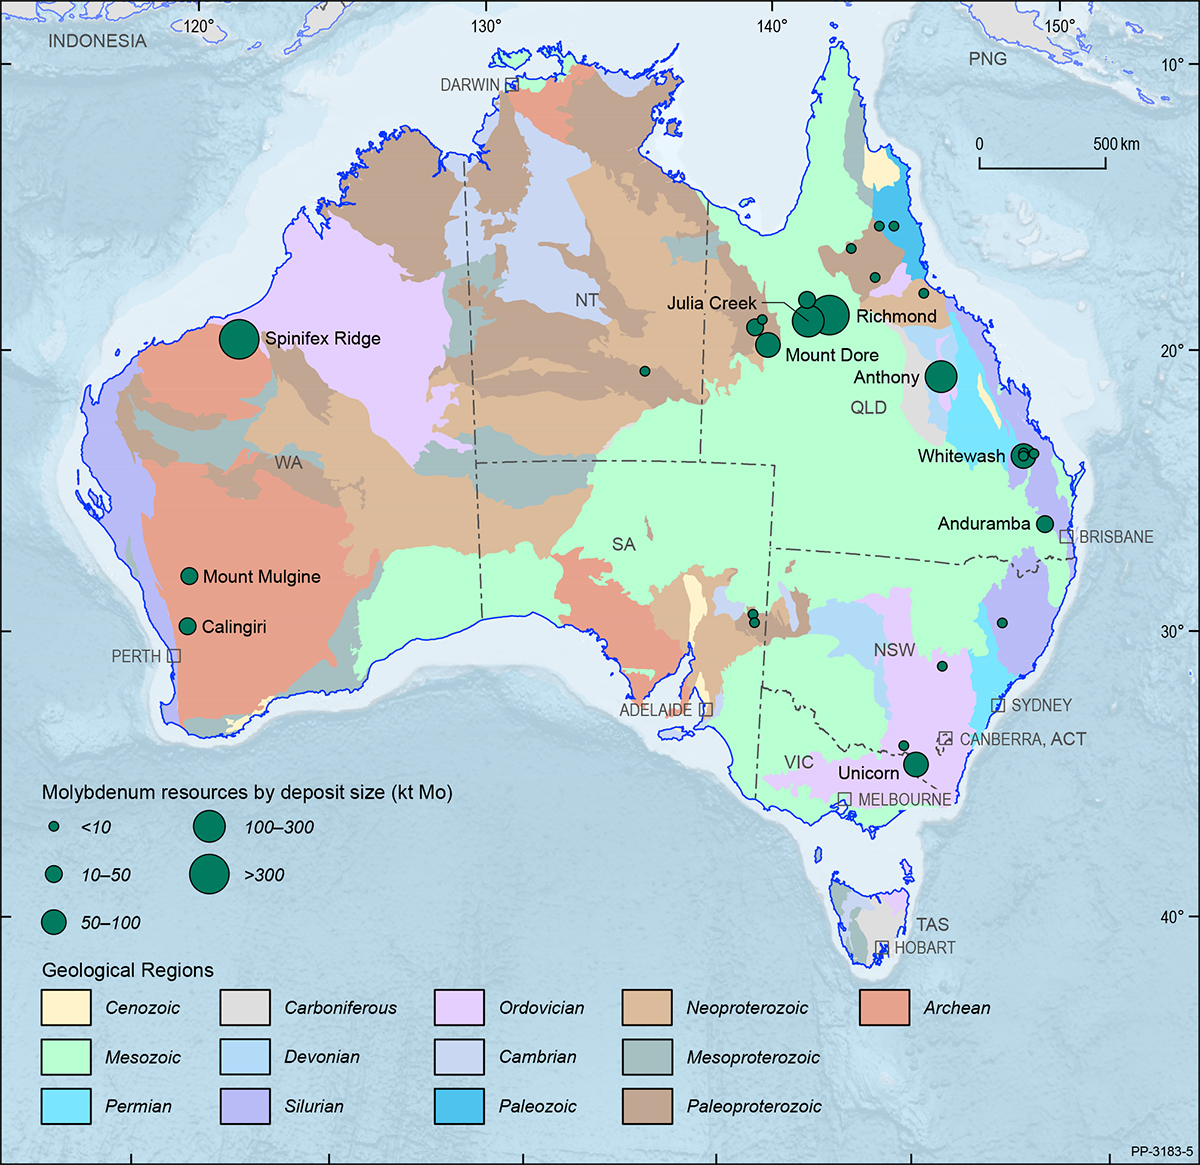
Australia’s EDR of molybdenum in 2018 were 171 kt (Table 3), a 7% increase from 160 kt in 2017 (Table 4). Australia ranks eighth globally for economic molybdenum resources but only hosts approximately 1% of world resources (Table 8), which are dominated by China, the USA, Peru and Chile. The bulk of Australia’s EDR of molybdenum occurs in Queensland (89%), followed by Western Australia (7%) and the Northern Territory (3%; Figure 28). In 2018, Inferred Resources of molybdenum in Australia totalled 1233 kt and another 366 kt of molybdenum were categorised as paramarginal (Table 3).
Nickel
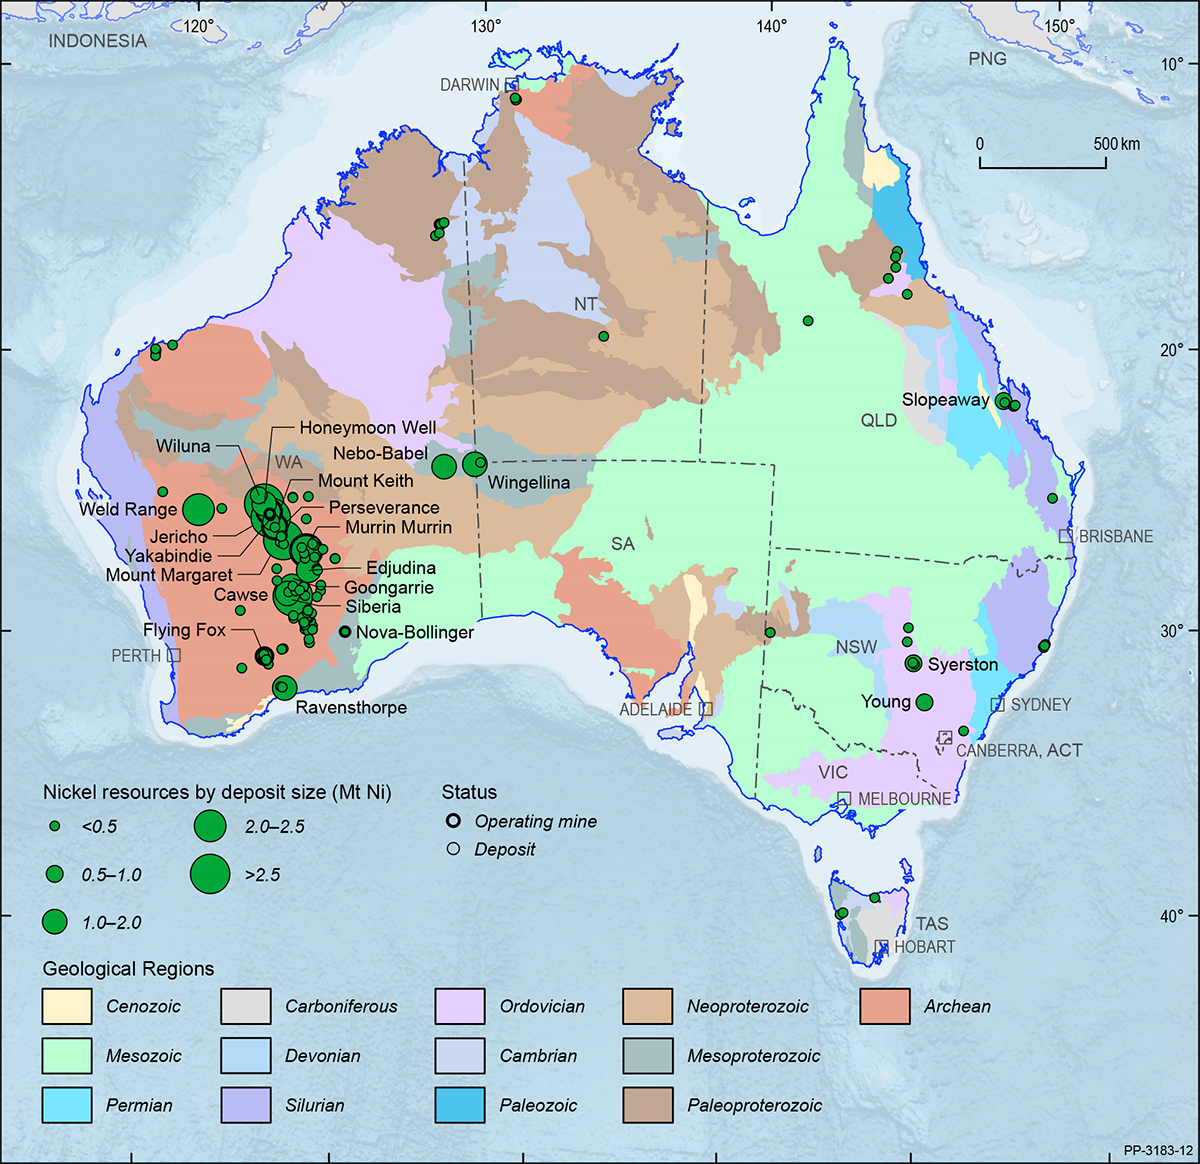
Australia’s EDR of nickel were 19.7 Mt in 2018 (Table 3), unchanged from 2017 (Table 4). Australia ranks second globally with 23% of the world’s economic resources, and sixth for production (6%; Table 8). Australia’s nickel deposits and operating mines are shown in Figure 29 on a total resource basis.
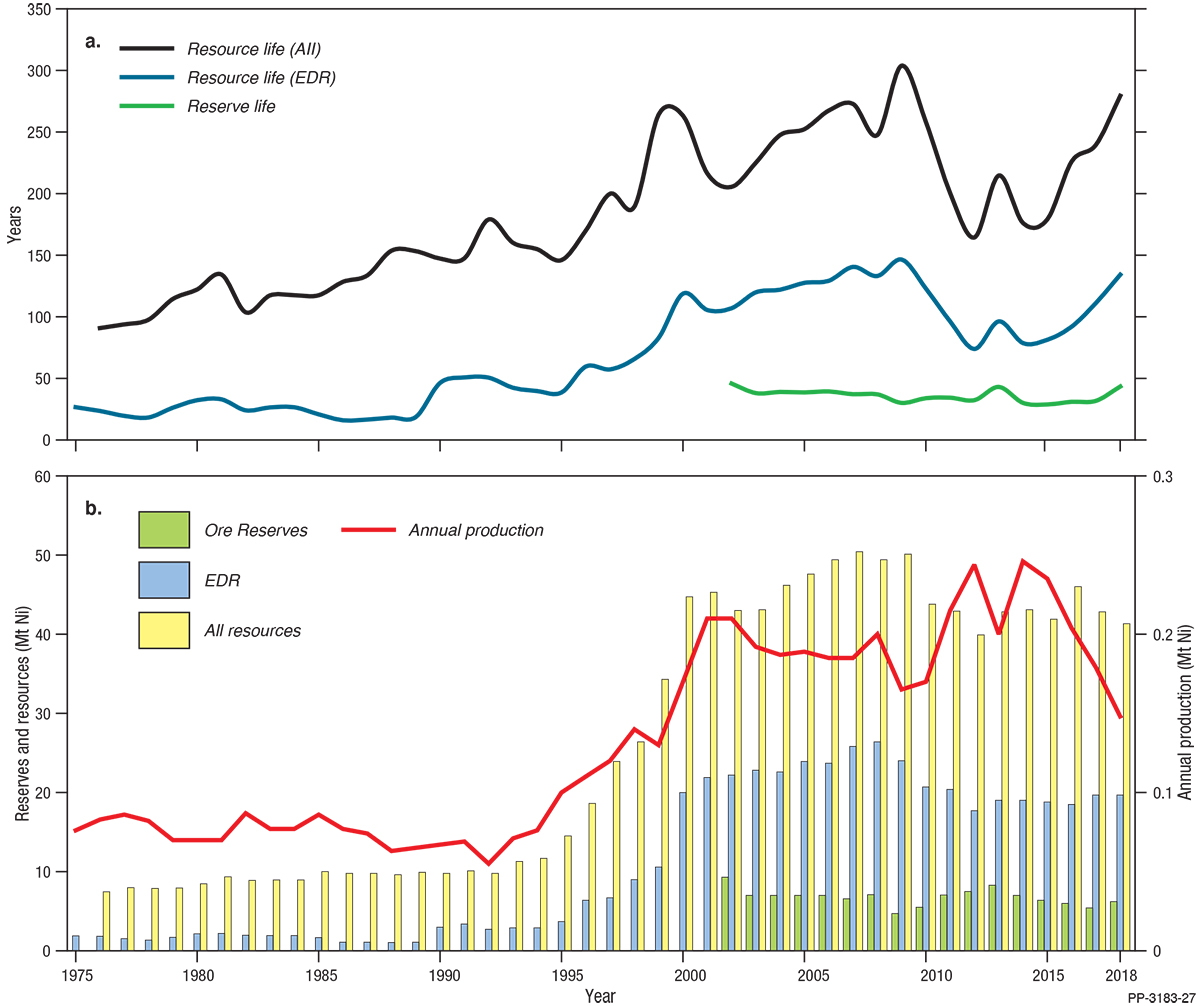
Australia’s total Ore Reserves of nickel were 6.2 Mt in 2018 (Table 2), up 15% from 5.4 Mt in 2017. Twelve operating mines (Table 1) produced 0.148 Mt of nickel in 2018 (Table 1), down 17% from 0.179 Mt in 2017. The USGS notes that, in recent years, production of refined nickel decreased as stainless steel producers preferred lower cost nickel pig iron11. At the same time, production of nickel chemicals has increased, particularly nickel sulphate used in the production of batteries. Industry analysts project a significant increase in global nickel consumption in batteries for energy storage and electric vehicles.
In 2018, exports of nickel ore and concentrates (0.164 Mt) and intermediate and refined nickel (0.234 Mt) had a combined export value of $4285 million (Table 11), significantly up from $2445 million in 2017 owing to improved nickel prices, despite lower production (Table 12).
At 2018 rates of nickel production, the average reserve life at operating mines is seven years and demonstrated resource life (Measured and Indicated categories) is 37 years (Table 1).
If Ore Reserves at mines on care and maintenance, developing mines and undeveloped deposits are also considered, the average reserve life of nickel is potentially 42 years (Table 2) and if accessible EDR is used as an indication of long-term potential supply, then Australia’s nickel resources could last 133 years at 2018 rates of production (Table 9). At 2018 rates of production, and even with increased rates of production, Australia has the potential to produce nickel for many decades into the future.
Reserve life for nickel shows a general decline since 2002 because companies have been replacing Ore Reserves at a slower rate than production has been depleting them (Figure 30). Resource life for nickel gradually rose from 1990 to 2009 because companies delineated new resources faster than they increased production (Figure 30). Since the 2009 peak, resource life has declined but has begun to increase again in recent years owing to falling production (Figure 30).
In second half of 2018, Panoramic Resources Ltd restarted production at its Savannah nickel-copper-cobalt mine in Western Australia. A number of other companies are developing projects for cobalt production that should become operational in the next two to three years (e.g. the Australian Mines Ltd Sconi battery metals project in Queensland; the Clean TeQ Holdings Ltd Sunrise nickel-cobalt project in New South Wales). In 2018, Carnavale Resources Ltd acquired the Grey Dam nickel-cobalt project in Western Australia and is evaluating the potential for a shallow, low strip-ratio open pit.
11 United States Geological Survey, 2019. Mineral Commodity Summaries, Nickel.
Oil shale
Resources of oil shale predominantly occur in sedimentary basins around Gladstone, Mackay and Proserpine in central Queensland. Subeconomic (contingent) resources were estimated at 2287 GL (14 385 million barrels), and Inferred (prospective) resources were estimated at 1472 GL (9261 million barrels) in 2018 (Table 3). Australia currently has no EDR of oil shale, with all resources being assessed as subeconomic. There is currently no production from oil shales in Australia.
Phosphate
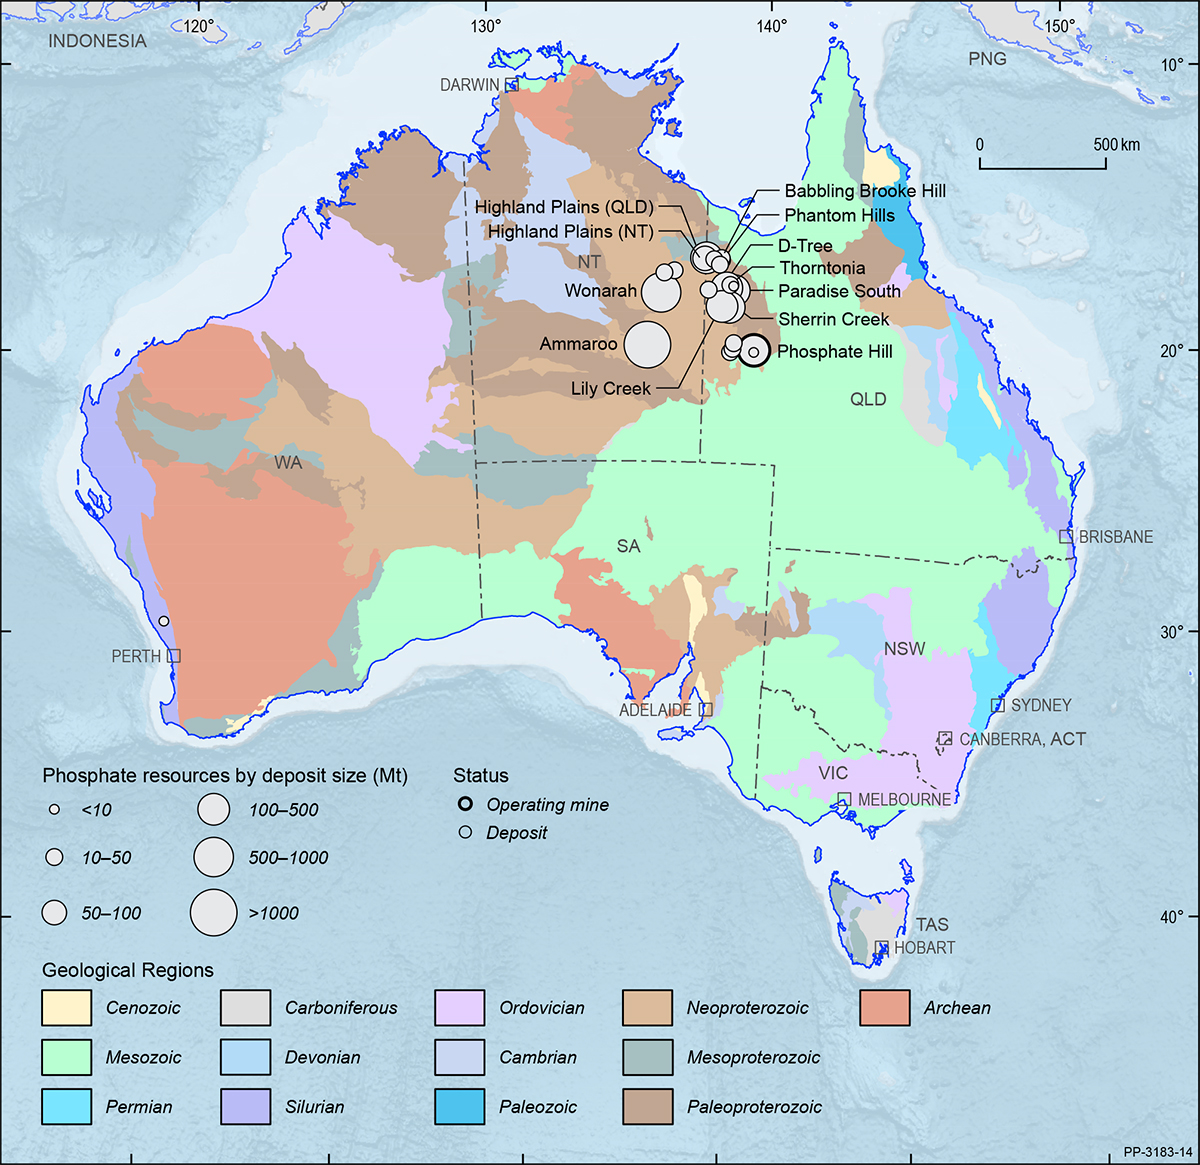
Geoscience Australia assesses both phosphate rock (phosphorite and guano) and contained P2O5 which, as well as being a component of phosphate rock, can be found in other rock types in which alternative minerals are the primary target. Australia’s EDR of phosphate rock were 1091 Mt in 2018 (Table 3), down 7% from 1170 Mt in 2017 (Table 4). Contained P2O5 EDR in 2017 decreased 10% to 178 Mt (Table 3) from 198 Mt the previous year (Table 4). The phosphorites of the Georgina Basin (encompassing parts of Queensland and the Northern Territory; Figure 31) account for almost all of Australia’s EDR of phosphate rock and 93% of Australia’s EDR of contained P2O5. The remaining phosphate rock occurs at Christmas Island. The rare earth deposits at Mount Weld (Western Australia) and Nolans Bore (Northern Territory) also have EDR of contained P2O5. Australia hosts less than 2% of the world’s economic resources of phosphate rock (Table 8) with Christmas Island and Phosphate Hill (Queensland) the only significant producers.
Platinum Group Elements
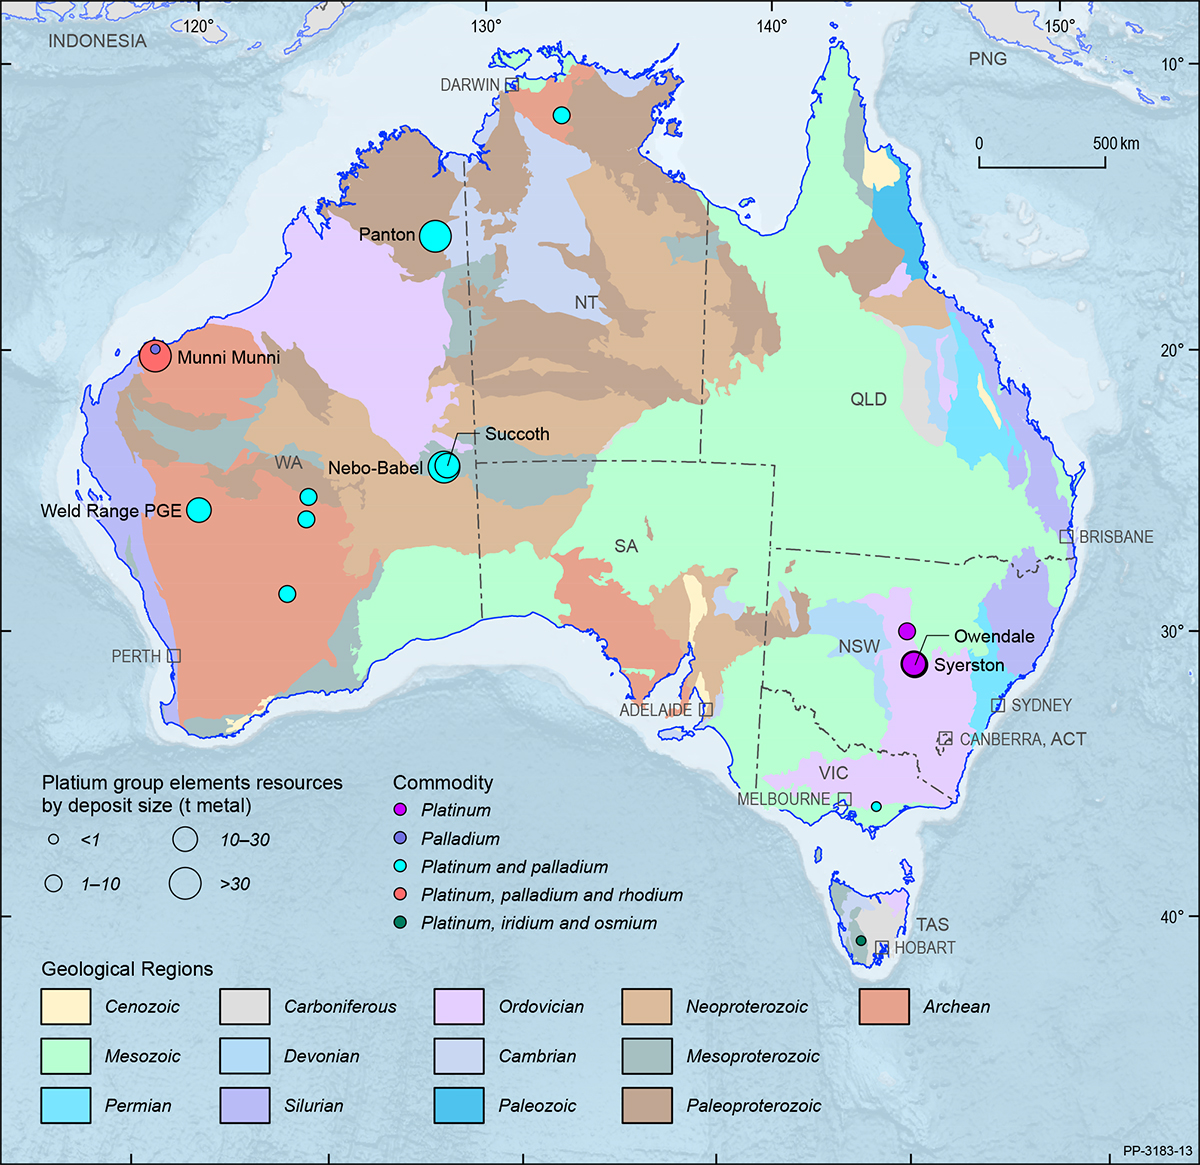
Australia’s EDR of platinum group elements (PGE) increased 26% (6.6 t) from 24.9 t in 2017 to 31.5 t in 2018 (Table 4). Australian EDR represents a minor portion of the world total of 69 000 t (Table 3). Australia also has Inferred Resources of 16.2 t and another 136.7 t categorised as paramarginal (Table 3). In addition to public PGE resource reports, Australian mineral deposits may contain unreported resources that are recovered as by-products to the primary commodity being mined (usually from nickel sulphide ores). The Western Australian Department of Mines and Petroleum reported that 541 kg of platinum and palladium was produced during 2018 (Table 3), a decrease from 765 kg in 2017. The bulk (71%) of Australia’s EDR of PGE occur in Western Australia (Figure 32).
Potash
In 2018, Australia’s EDR of potash increased by 24% to 72 Mt, up from 58 Mt in 2017 (Table 4). The increase reflects significant industry and exploration activity, boosted by rising potash prices over the past three years, leading to the development of promising projects with potential to bring high-grade sulphate of potash (SOP) products online.
Several projects are on track to commence potash production starting in 2020 with the Beyondie SOP project currently in development by Kalium Lakes Ltd. The project is expected to produce 90 000 tonnes per annum (tpa) and eventually ramp up to 180 000 tpa. Additional projects are set to come online soon after, including Agrimin Ltd’s Lake Mackay SOP project which is expected to commence commercial production in 2022 and eventually ramp up to 426 000 tpa. Salt Lake Potash Ltd is building a 50 000 tpa demonstration plant to provide a template for a very large-scale future operation as part of its Goldfields Salt Lakes Project, which includes the Lake Wells deposit in Western Australia.
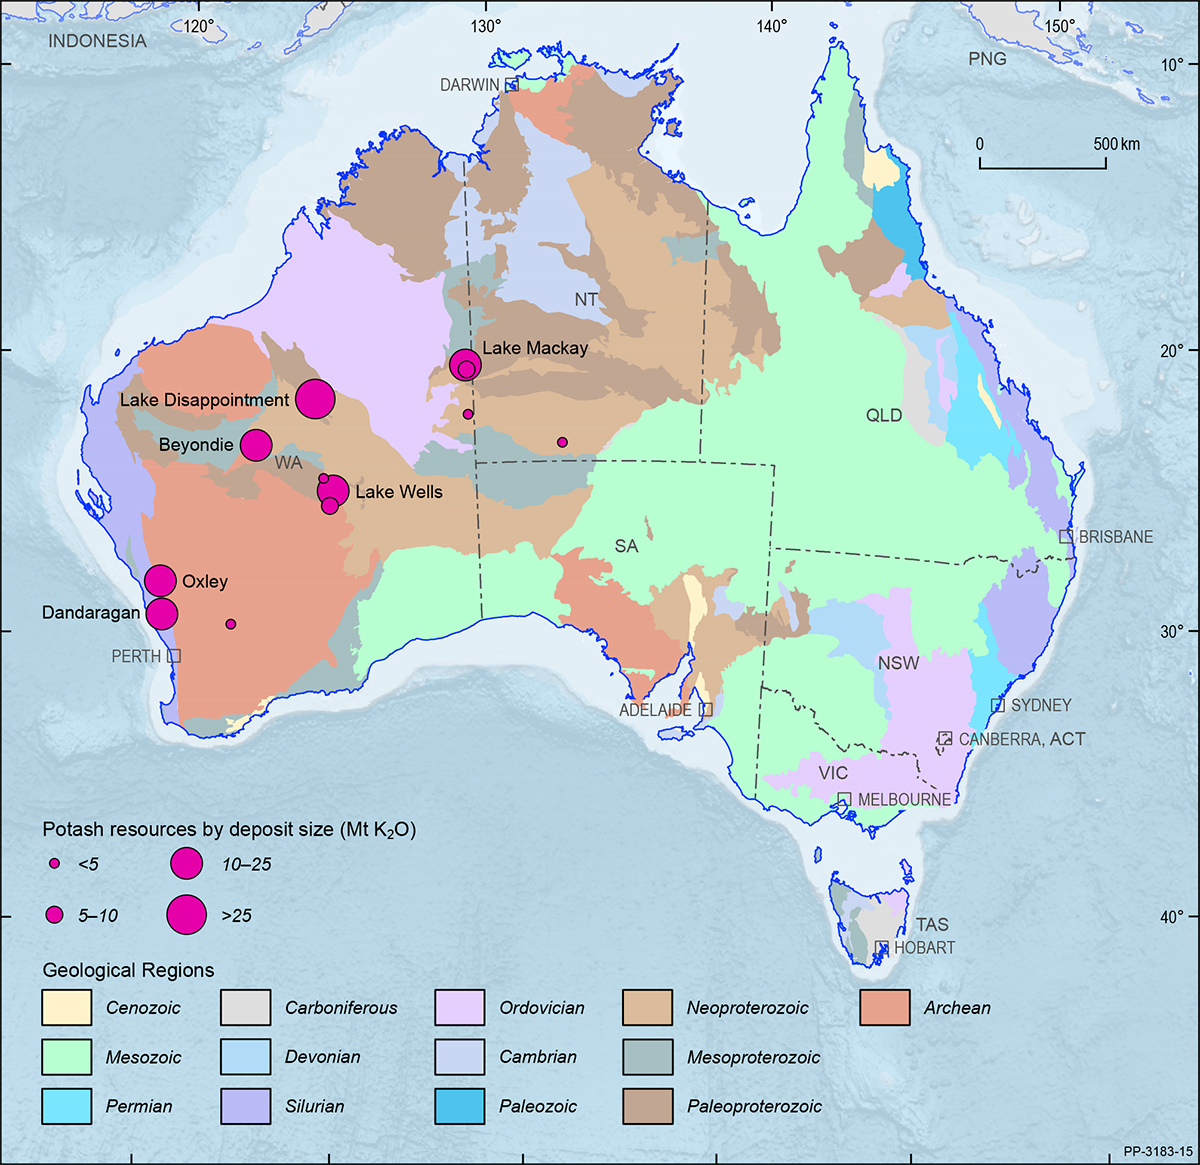
Nearly all (95%) of Australia’s potash resources occur in Western Australia, with the exception of Karinga Lakes in the Northern Territory and Lake Mackay which occurs on the border between the two jurisdictions. In addition, nearly all Australian potash resources occur in lake brines with resources also delineated at Kalium Lakes, Lake Chandler, Lake Disappointment, Lake Hopkins and Lake Wells (Figure 33).
Historically, Australia produced potash in the 1950s but, since then, has predominately imported potash and potassic fertilisers. Potash is imported principally from Canada, the USA and Germany, while, over the last five years, other potassic fertilisers (besides potash) have been principally imported from Belgium, South Korea and Israel. In 2018, Australia imported over 796 Mt of potash and potassic fertilisers worth $244 million.
Australia’s potash resources remain small (1%)by world standards (Table 8). The countries with the largest economic resources of potash (K2O) in 2018 were Russia (2000 Mt), Canada (1200 Mt) and Belarus (750 Mt), together representing 68% of the world’s total K2O-equivalent resources. Australia is ranked 11th in the world for resources but did not produce potash in 2018 (Table 8).
Rare Earth Elements
The rare earth elements (REE) are a group of metals comprising the 15 elements of the lanthanide series12. In addition, yttrium (Y) and scandium (Sc) are commonly considered part of the grouping because of their similar chemical properties. Resources of REE are reported as rare earth oxides (REO) and Geoscience Australia incorporates yttrium when determining these resource estimates but assesses scandium separately.
As at December 2018, total Ore Reserves of REO, including yttrium but not scandium, reported in compliance with the JORC Code amounted to 2.84 Mt (Table 2) an increase of 48% over 2017. This estimate does not include approximately 17 kt of REO that have been reported in Ore Reserves of heavy mineral sands. Ore Reserves accounted for 69% of Australia’s Economic Demonstrated Resources of REO.
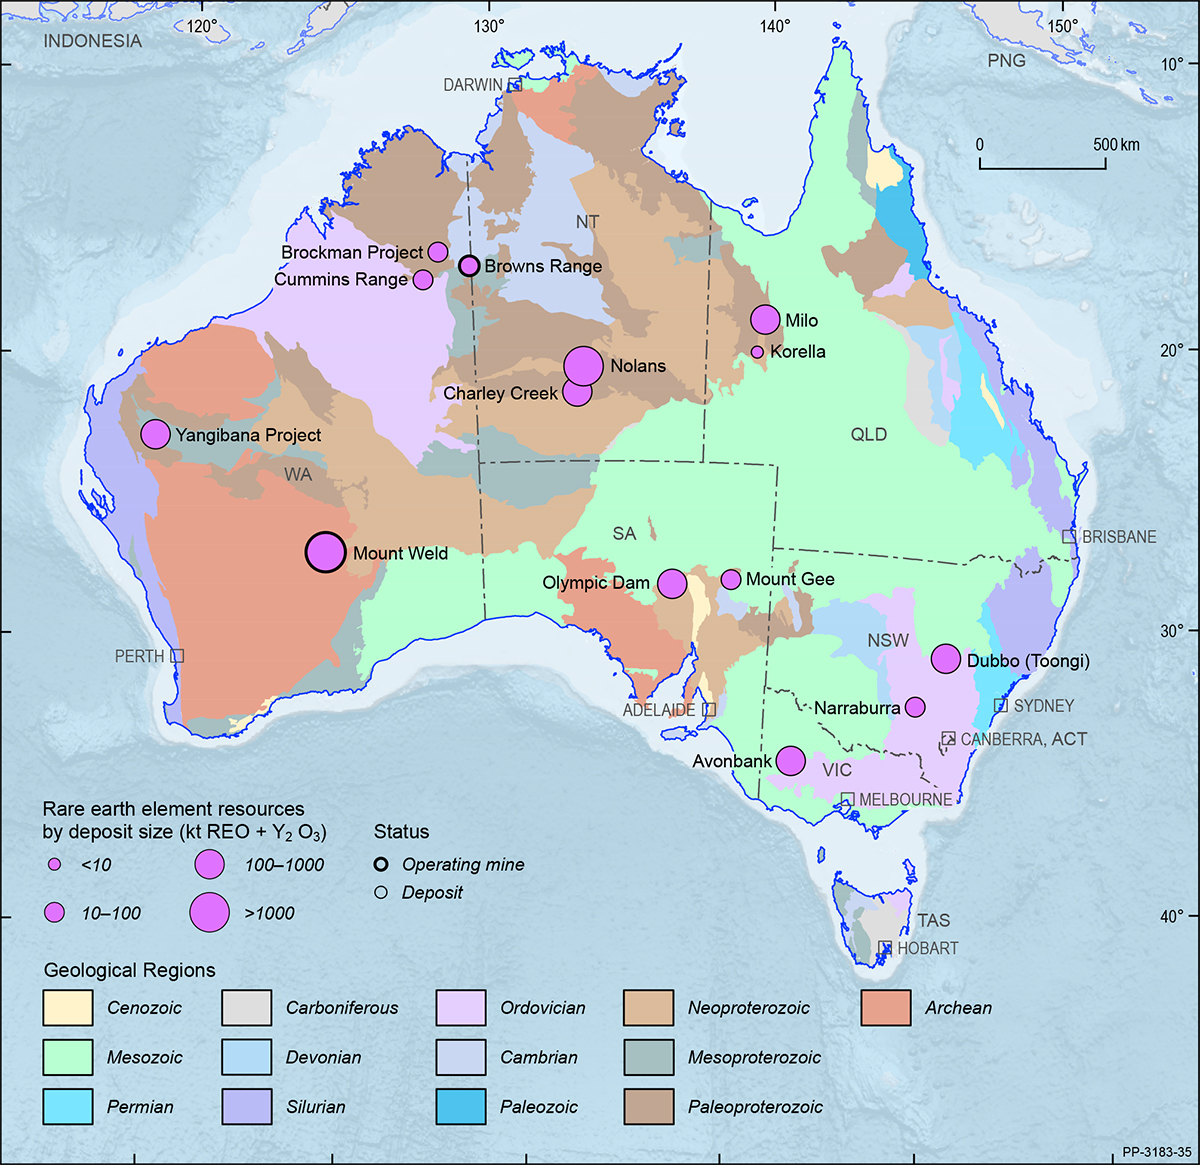
Economic Demonstrated Resources of REO were 4.12 Mt at the end of December 2018 (Table 3), up by 26% from 3.27 Mt in 2017 (Table 4). Australia also had 33.99 Mt of REO resources considered to be subeconomic at the end of 2018 (Table 3), an increase of 11% from the 30.56 Mt recorded at the end of 2017. Similarly, 26.15 Mt of Inferred Resources of REO in 2018 (Table 3), were 5% higher than the 24.81 Mt at the end of 2017. Rare earths deposits and operating mines are shown in Figure 34 on a total resource basis.
World production of rare earths, based on USGS data and modified for Australian production, was estimated to be 0.170 Mt of REO in 2018. Australia was the world’s second largest producer, providing 11% of global supply (Table 8). Australian production of REO in 2018 was 0.019 Mt (Table 1) and came predominantly from Lynas Corporation Ltd’s Mount Weld mine in Western Australia. Concentrates from Mount Weld are processed at the Lynas Advanced Materials Plant in Malaysia to produce REO products. In addition, 2.6 t of rare earth carbonate was produced and exported to China by Northern Minerals Ltd from its pilot mining and processing operation at the Browns Range project in the Kimberley region of Western Australia.
12 The lanthanide series comprises lanthanum (La), cerium (Ce), praseodymium (Pr), neodymium (Nd), promethium (Pm), samarium (Sm), europium (Eu), gadolinium (Gd), terbium (Tb), dysprosium (Dy), holmium (Ho), erbium (Er), thulium (Tm), ytterbium (Yb) and lutetium (Lu).
Scandium
Scandium is used in the production of alloys for the aerospace industry. It is also used in solid-oxide fuel cells, in specialised lighting applications, ceramics, lasers, electronics and in aluminium alloys for sporting goods production.
Scandium is often grouped with the rare earths and yttrium. While it is not uncommon in the Earth’s crust (it has an abundance of around 25 ppm), scandium, like the rare earths, does not often occur in concentrations that can support commercial mining operations.
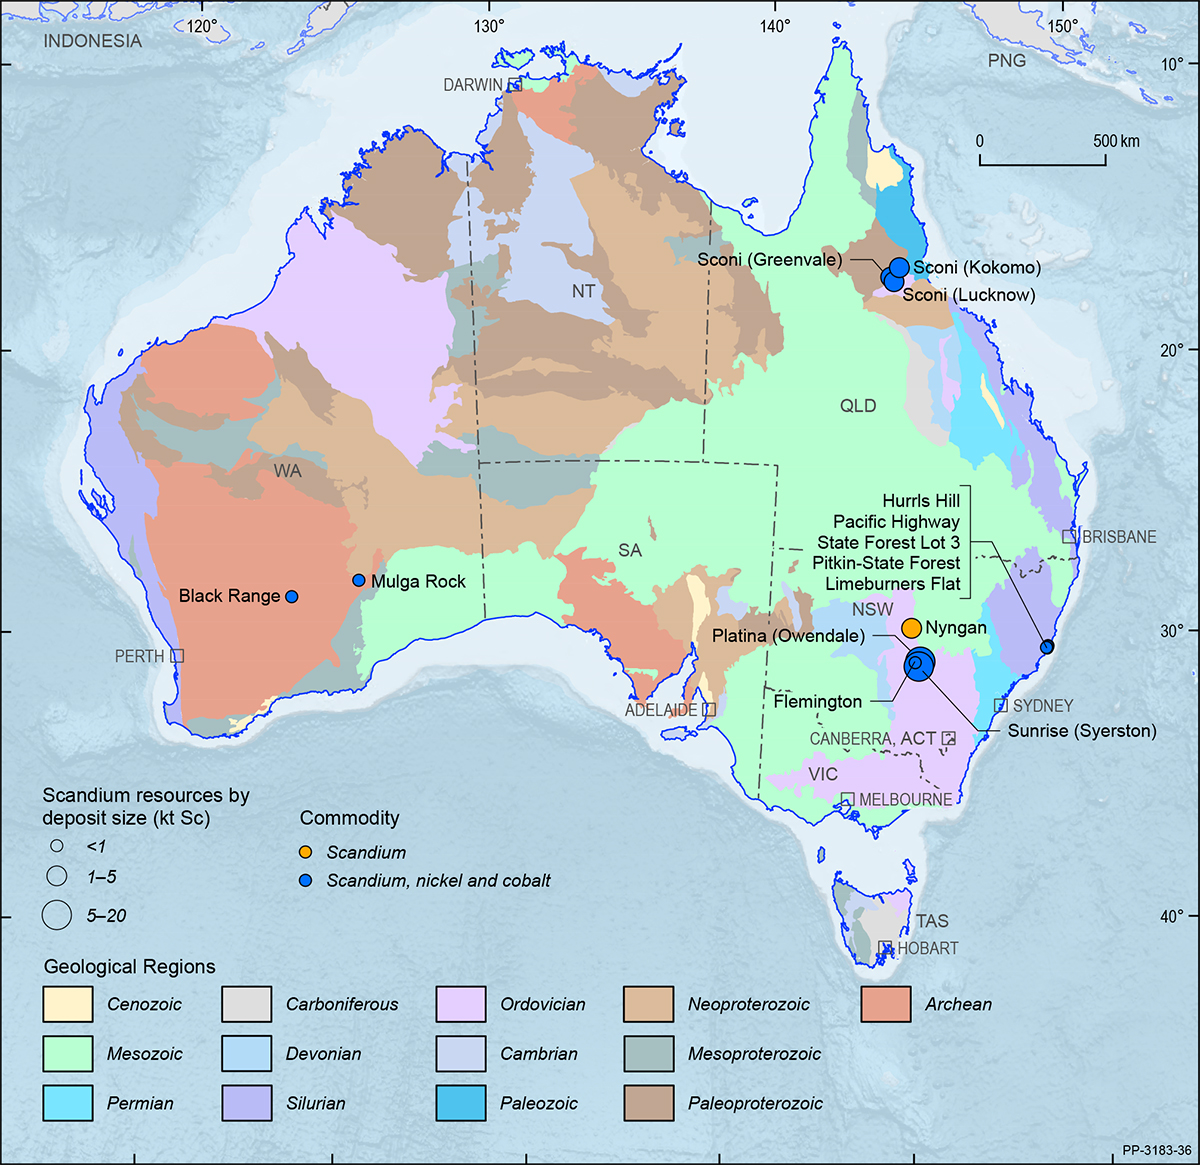
In Australia, known occurrences of scandium are mostly associated with lateritic nickel-cobalt mineralisation and are independent of rare earth deposits. Australian resources of scandium occur in Queensland, New South Wales and Western Australia but none are currently mined (Figure 35).
As at December 2018, total Ore Reserves of scandium, reported in compliance with the JORC Code, were 12.14 kt (Table 2). Ore Reserves accounted for 48% of Australia’s EDR of scandium and have been reported from four projects—Nyngan, Owendale and Sunrise (Syerston) in New South Wales and Sconi in Queensland. Scandium EDR were 26.05 kt in 2018 (Table 3) and Australia also had an estimated 7.64 kt of subeconomic scandium resources and Inferred Resources of 19.49 kt (Table 3).
Tin
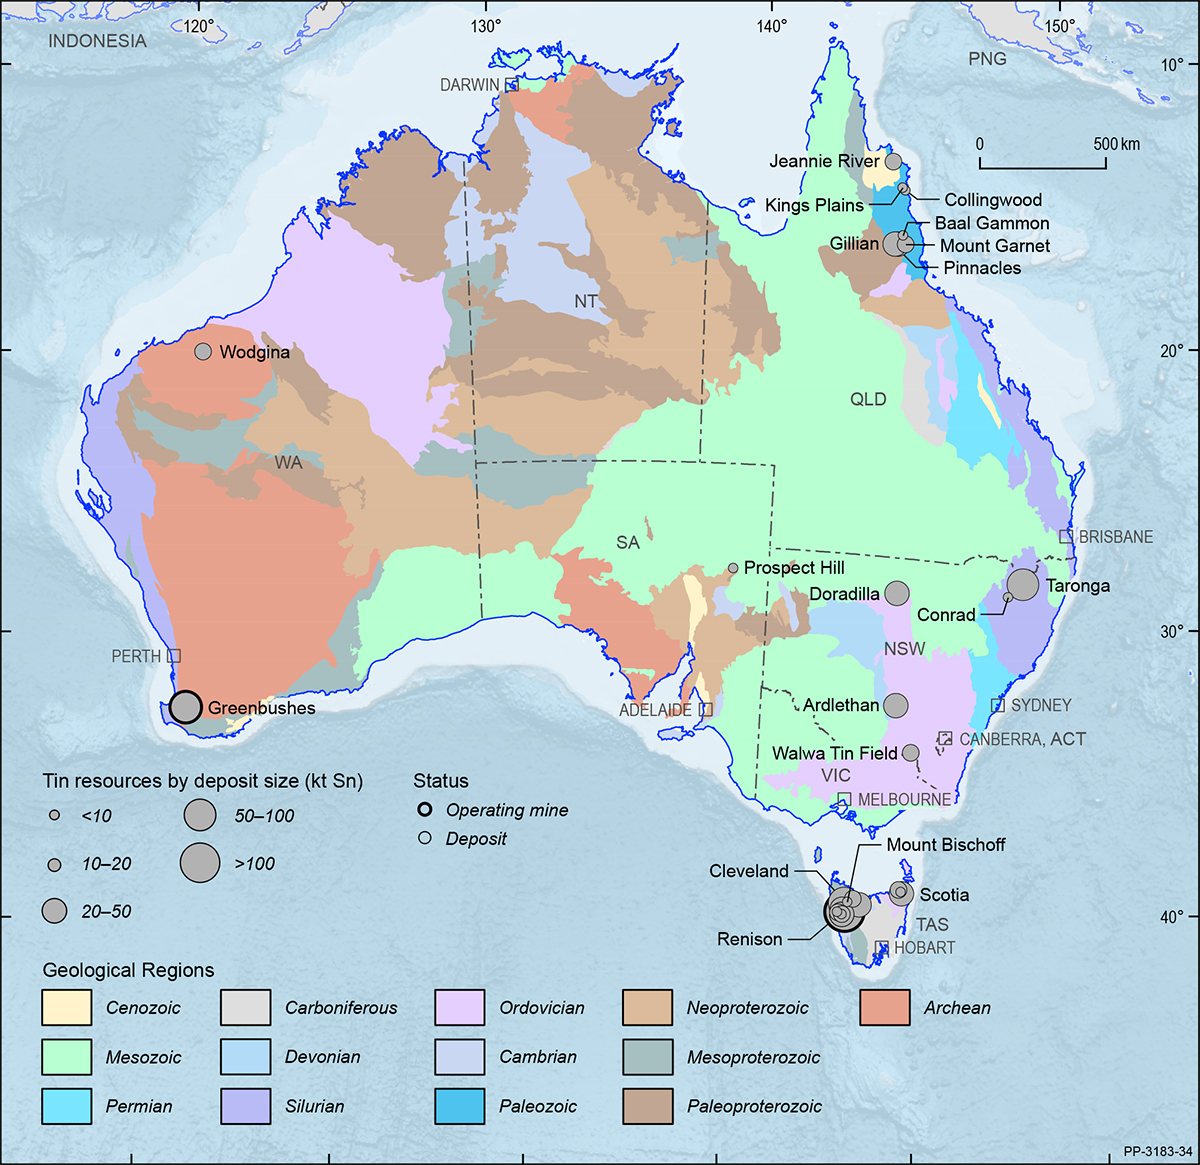
Australia’s EDR of tin were 430 kt in 2018 (Table 3), up slightly (4%) from 415 kt in 2017 (Table 4). Just over half (52%) of Australia’s EDR of tin occur within the Renison deposit, Tasmania. Other deposits with significant EDR include Cleveland, Queen Hill and Mount Lindsay (Tasmania), Taronga (New South Wales) and Gillian and Pinnacles (Queensland). Tin deposits and operating mines are shown in Figure 36 on a total resource basis. Total resources of tin in Australia are 888 kt (Table 3). In 2018, Australia ranked fourth globally with 9% of the world’s economic resources of tin (Table 8).
Annual production of tin for Australia in 2018 was 6.9 kt (Table 3), down from 7.4 kt in 2017. Nearly all of this production was from the Renison deposit in Tasmania. Australia ranked eighth globally in 2018 with 2% of world production (Table 8).
Australia’s total Ore Reserves of tin in 2018 were 249 kt (Table 2), of which the majority (67%) are within the Renison deposit (Figure 1). Other delineated Ore Reserves are reported at the Taronga, Cleveland and Mount Lindsay deposits. Based on the 2018 Ore Reserves to production ratio, Australian tin has 36 years of reserve life, reducing to 24 years when only operating mines are considered (Table 9).
Tungsten
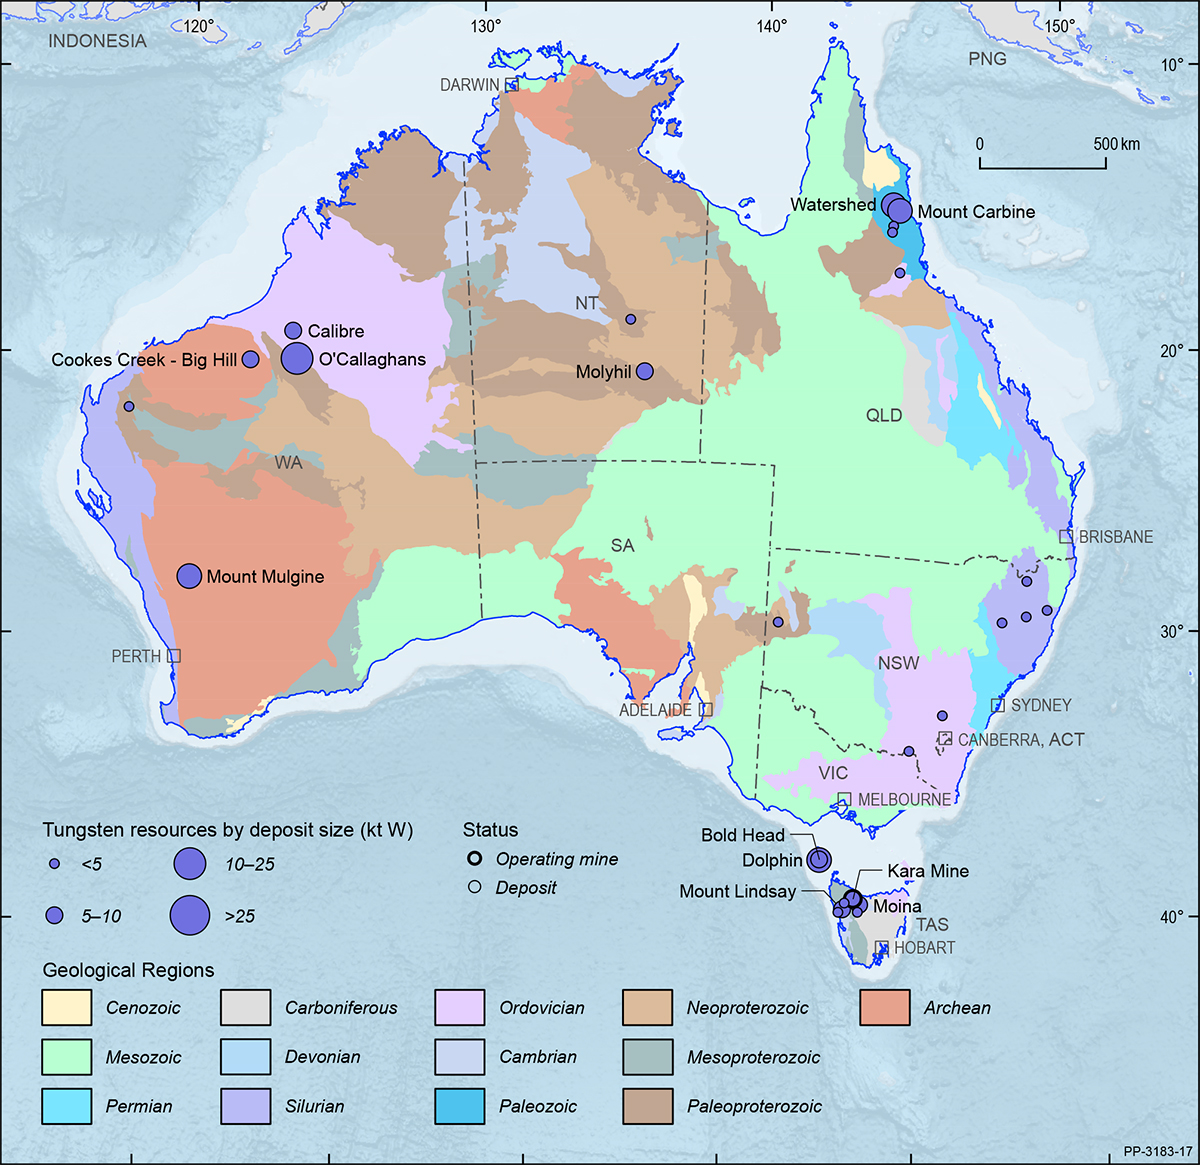
In 2018, EDR of tungsten were 394 kt (Table 3), up 2% (Table 4) from 386 kt the previous year. Western Australia holds 53% of EDR, Tasmania 26% and Queensland 18%. Minor EDR (<5%) occurs in the Northern Territory and New South Wales (Figure 37). Australia ranks second in the world (Table 8), behind China, with 11% of global world economic resources. Australian production, however, remains minor on the world scale (Table 8); China holds approximately 50% of world economic resources and is responsible for more than 80% of global production.
As at December 2018, total Ore Reserves of tungsten reported in compliance with the JORC Code amounted to 216.4 kt (Table 2) of which 2.9 kt was attributable to Australia’s one operating tungsten mine. In 2018, Ore Reserves remained unchanged whilst production increased and, therefore, reserve life decreased: the very large reserve life, of more than 10 000 years (Table 2), is attributable to a relatively small production rate. In 2018, prices reached a peak of US$350/metric tonne unit (MTU) in June, by the end of the year, prices had dipped to approximately US$280/MTU.
The Kara mine in Tasmania was Australia’s only operating tungsten mine in 2018. It produces scheelite (calcium tungstate) concentrates as a by-product of magnetite processing. During 2018, Molyhil (Northern Territory), Mount Lindsay (Tasmania) and Watershed (Queensland) remained at various stages of development. During 2019, at the Dolphin Project (Tasmania), King Island Scheelite Ltd reportedly entered into an offtake agreement for tungsten concentrate with Austrian-based Wolfram Bergbau und Hutton AG pending the achievement of operational and financial milestones prior to 31 March 2021. In 2019, Specialty Minerals International Ltd reported the first delivery of equipment to the Mount Carbine site in Queensland and the engagement of sub-contractors for the installation of the newly arrived equipment. Specialty Minerals intended to commence tailings and stockpile retreatment at Mount Carbine in the final quarter of 2019.
Uranium
Australia has the world’s largest known resources of uranium, accounting for more than 30% of the global inventory, and is the world’s third largest uranium producer (Table 8) after Kazakhstan and Canada. As at December 2018, Australia had uranium EDR of 1325 kt (Table 3). This is equivalent to the Organisation for Economic Co-operation and Development, Nuclear Energy Agency and the International Atomic Energy Agency (OECD NEA and IAEA) category of Reasonably Assured Resources of uranium recoverable at costs of less than US$130/kg U (RAR <$130/kg U).
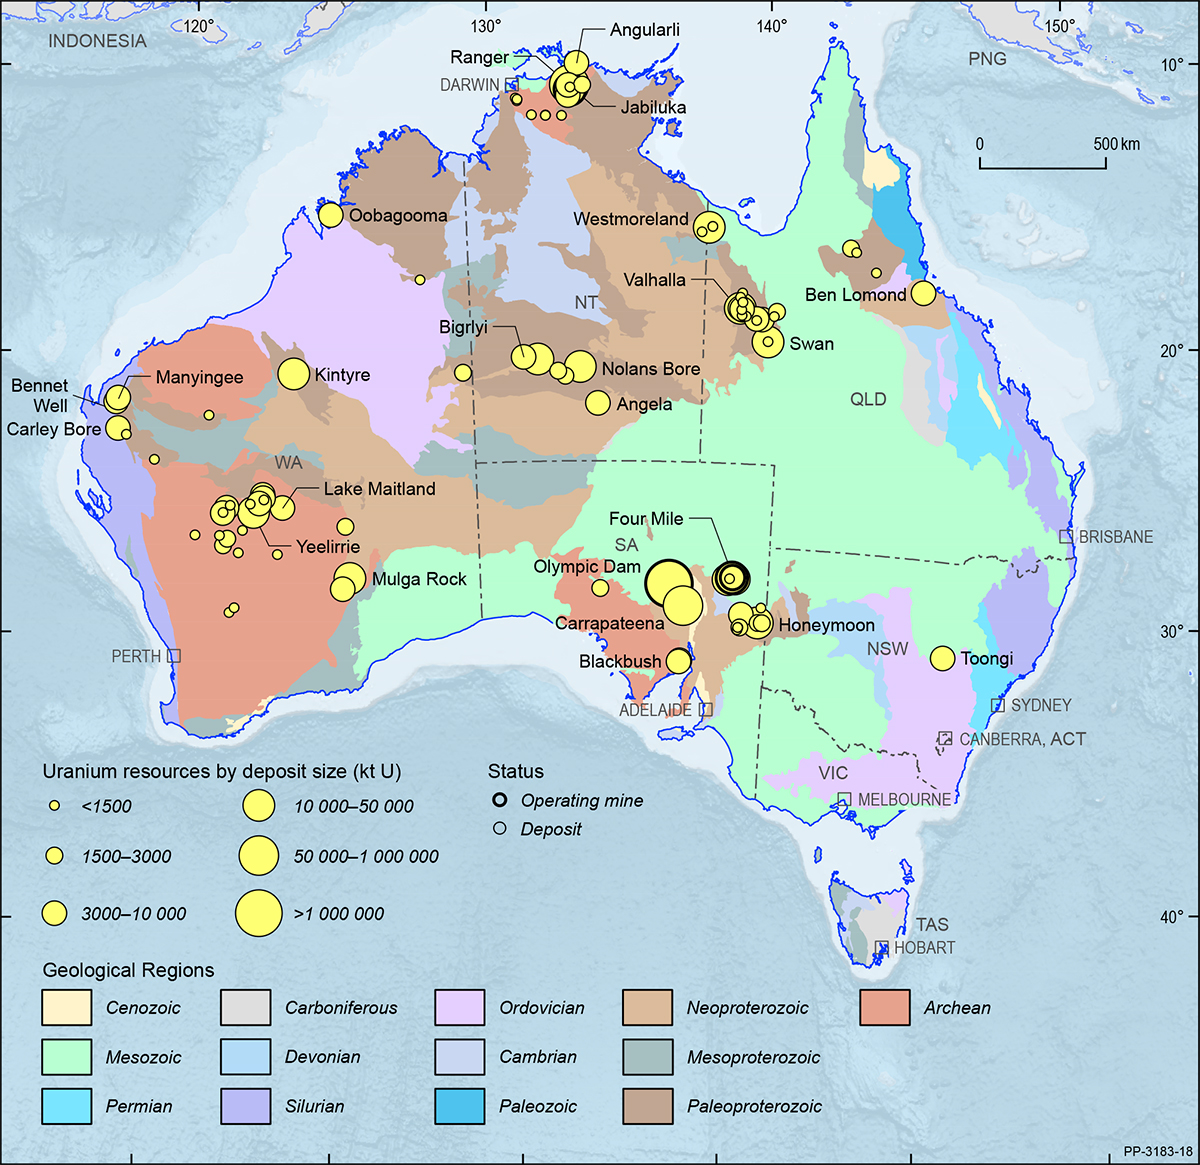
Ore Reserves of uranium in 2018 totalled 296 kt (Table 2), which was an approximately 4% increase from 2017. Additionally, Australia has an estimated 1016 kt of Inferred Resources of uranium and another 106 kt regarded as subeconomic (Table 3). Uranium deposits and operating mines are shown in Figure 38 on a total resource basis.
Australia’s uranium production in 2018 amounted to 5.872 kt (6.923 kt U3O8) and came from three operating mines—Olympic Dam and Four Mile in South Australia and Ranger in the Northern Territory (Table 1). This was a 10% increase on the previous year. Uranium production is expected to decrease in the near future, however, as mining activities at the Ranger mine will cease in January 2021. In 2018, Australia exported 6.167 kt U (7.272 kt U3O8) valued at $635 million (Table 11).
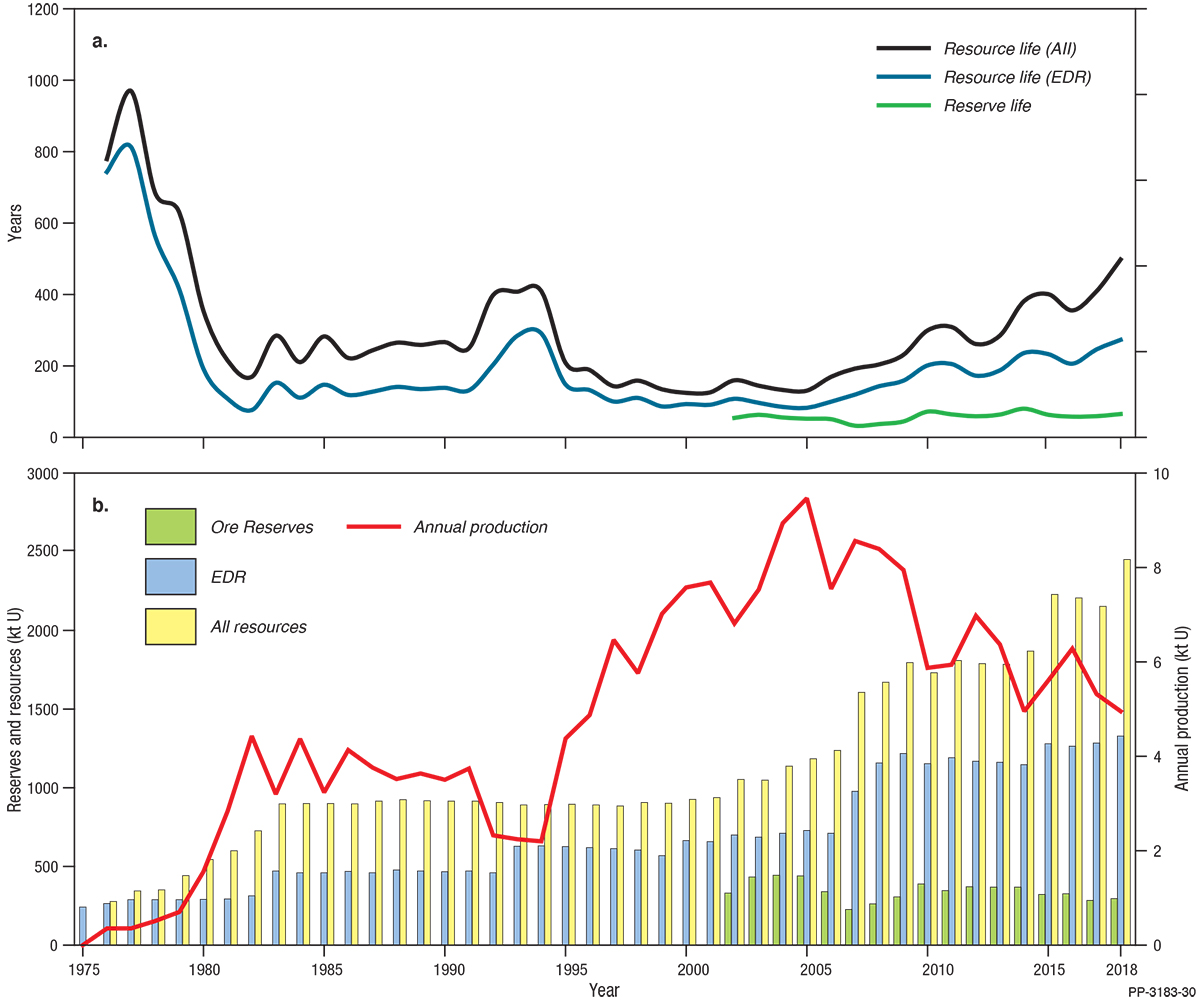
Resource life is a snapshot in time derived by taking a reserve or resource number and dividing it by a production number. After the flurry of discoveries in the 1970s, resource life (based on EDR) for uranium was more than 800 years in 1977 but this declined rapidly to around 100 years after uranium production increased in the 1980s (Figure 39). Resource life again ticked up in the early 1990s when the Kintyre and Olympic Dam resources were further delineated, and then decreased when production again rapidly increased from 1995. Since 2000, resource life has again been increasing owing to a gradual increase in resources and a concurrent decline in production (Figure 39).
Australia exports all its uranium production to countries within its network of bilateral safeguards agreements, which now total 43. These agreements ensure that Australian uranium is used only for peaceful purposes and does not contribute to any military applications. Australian mining companies supply uranium under long-term contracts to electricity utilities in North America, Europe and Asia.
The Yeelirrie uranium deposit, wholly owned by Cameco Australia Pty Ltd, is located 70 km southwest of Wiluna in Western Australia and is one of the world’s largest surficial uranium deposits. In April 2019, the Yeelirrie uranium project received environmental approval from the Australian Federal Department of Environment and Energy, which followed state government environmental approval in January 2017. The Yeelirrie project is one of five uranium projects that are awaiting better market conditions before proceeding with development. The other projects are Honeymoon in South Australia (Boss Resources Ltd), and Kintyre (Cameco Australia Pty Ltd), Wiluna (Toro Energy Ltd) and Mulga Rock (Vimy Resources Ltd), all in Western Australia.
Australia currently has no plans for a domestic nuclear power industry. However, interest in the industry at the state level led to the South Australian Nuclear Fuel Cycle Royal Commission in 2015 and, more recently, the New South Wales Uranium Mining and Nuclear Facilities (Prohibitions) repeal Bill 2019 and the Victorian Inquiry into Nuclear Energy Prohibition (2019). At the Federal level, an Inquiry into the Prerequisites for Nuclear Energy in Australia by the House of Representatives Standing Committee on the Environment and Energy was established in August 2019.
Vanadium
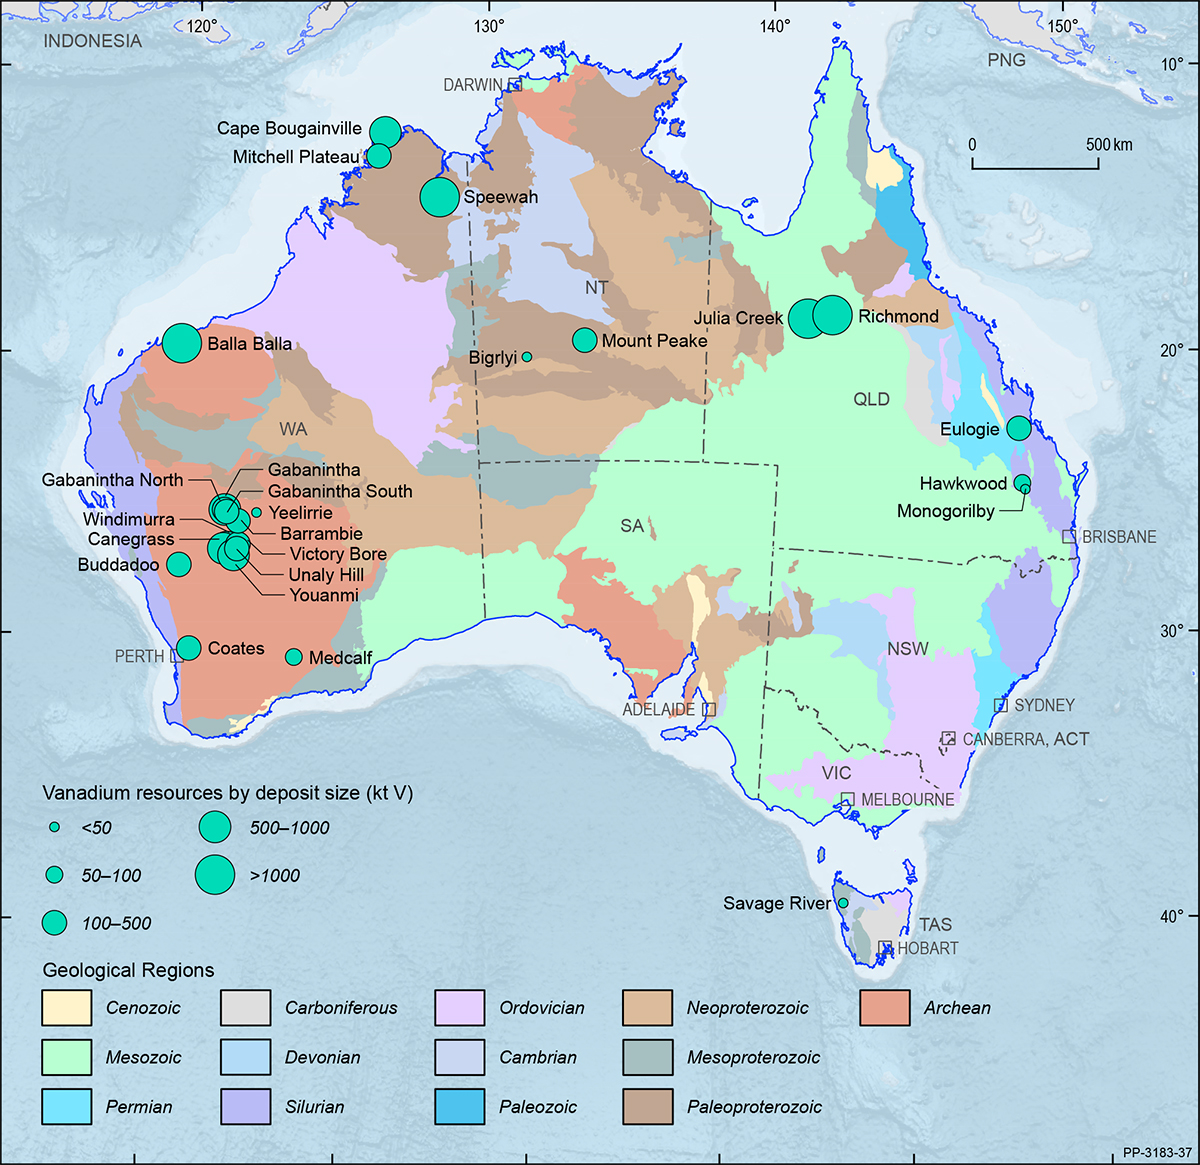
Vanadium has found favour with mineral explorers and developers in recent years owing to the global growth of renewable energy battery storage technologies. This is evident through the progressive increase of vanadium EDR, with a 17% increase to 4646 kt in 2018 (Table 3), up from 3965 kt in 2017 (Table 4). This EDR comprises approximately 20% of the global economic vanadium resources, ranking Australia third in the world (Table 8).
Australia’s total vanadium Ore Reserve has correspondingly increased by around 10% to 1182 kt, amounting to approximately 25% of the EDR of vanadium. Vanadium EDR in Australia are mostly located in Western Australia at developing deposits Balla Balla, Speewah, Barrambie and Gabanintha. The Windimurra vanadium mine (currently non-operational) in Western Australia has completed a study to recommence the operation in the near future. Windimurra was once Australia’s sole vanadium producer but operations ceased in February 2014 following fire damage to the plant. Mount Peak in the Northern Territory is an advanced vanadium project with construction planned. Vanadium deposits are shown in Figure 40 on a total resource basis.


