Data and products Keeping our communities safe from natural hazards

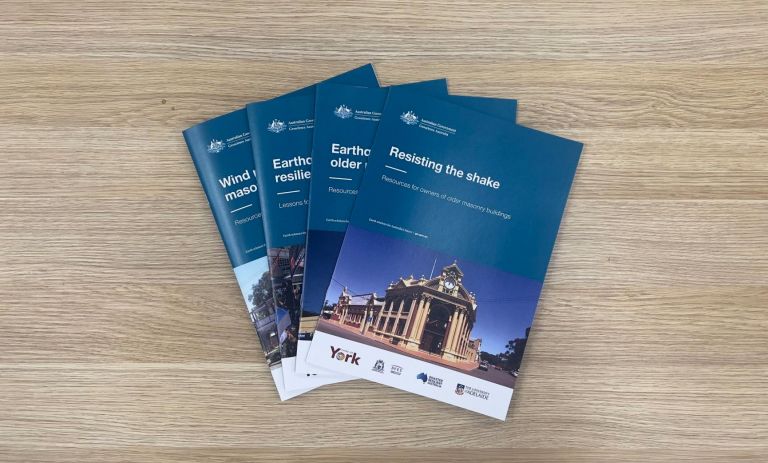
Retrofitting buildings to withstand earthquakes and severe wind
A series of booklets that guide building owners, builders, architects and local government in retrofitting unreinforced masonry buildings to resist earthquake damage and severe wind.

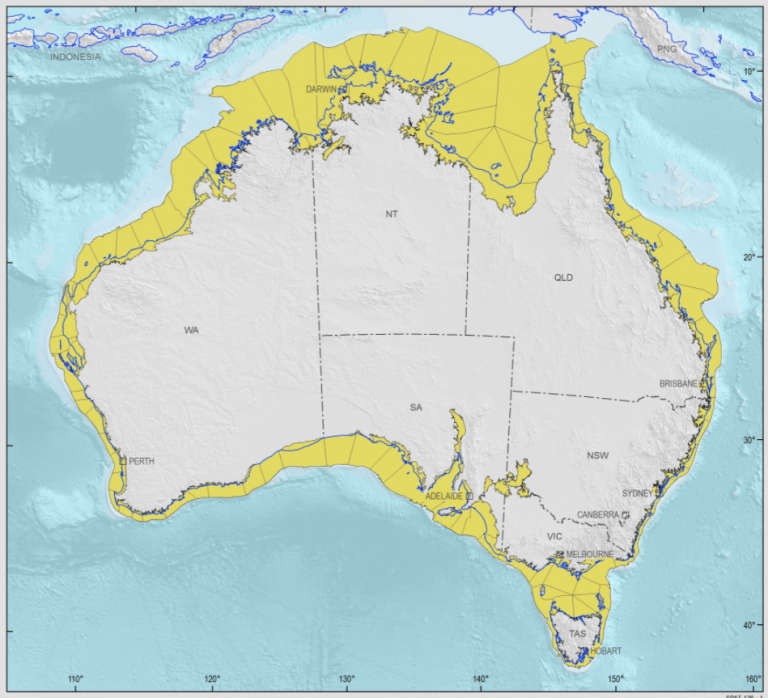
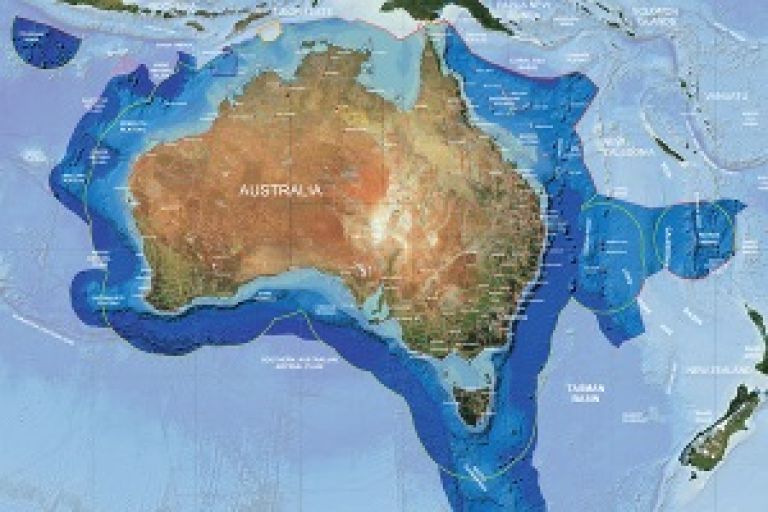
National Seismic Hazard Assessment (NSHA)
The NSHA defines the level of earthquake ground shaking across Australia, allowing higher hazard areas to be identified and mitigation strategies to be developed.

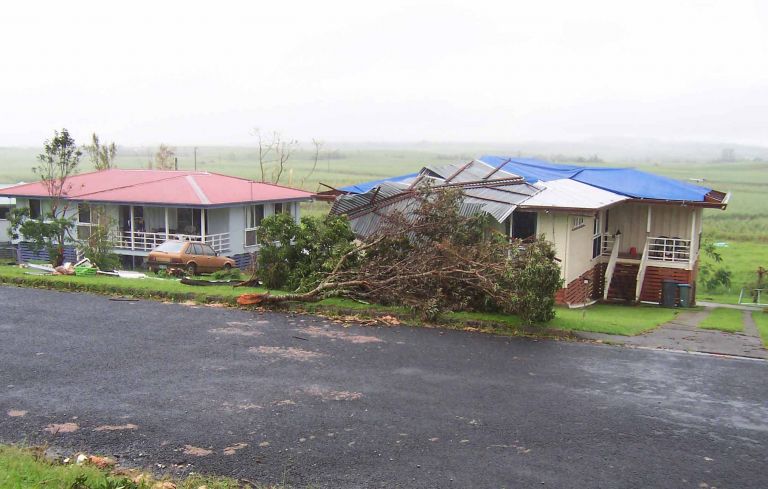
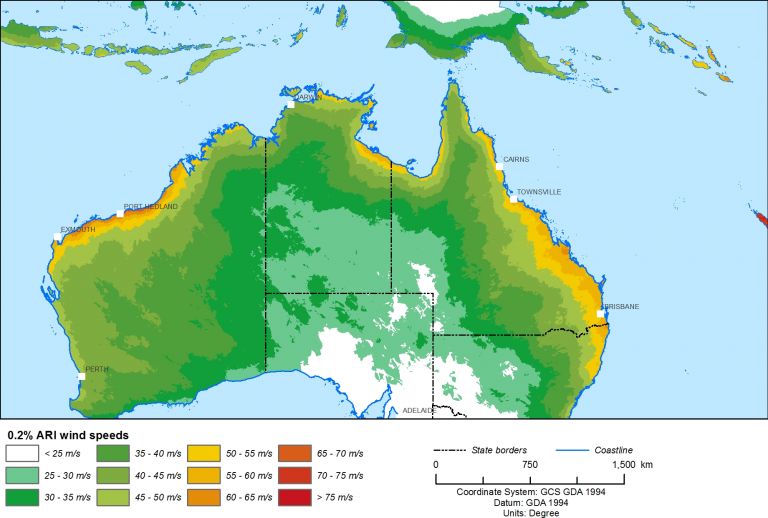
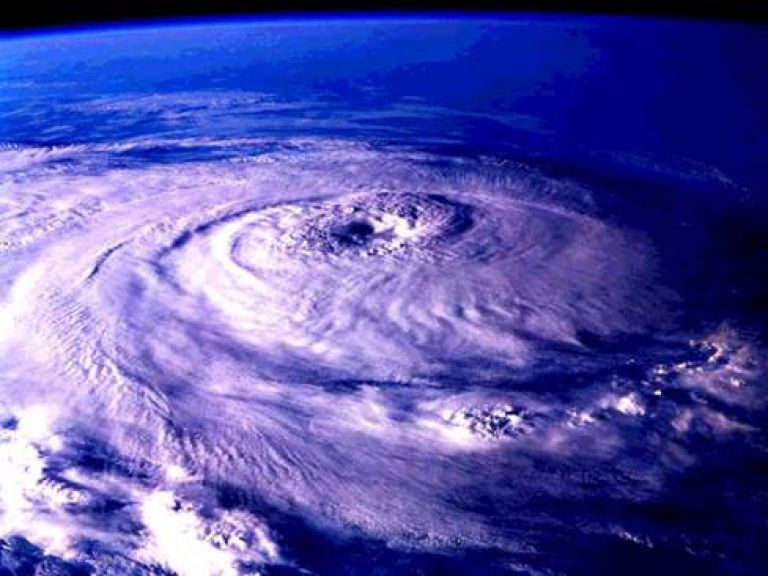
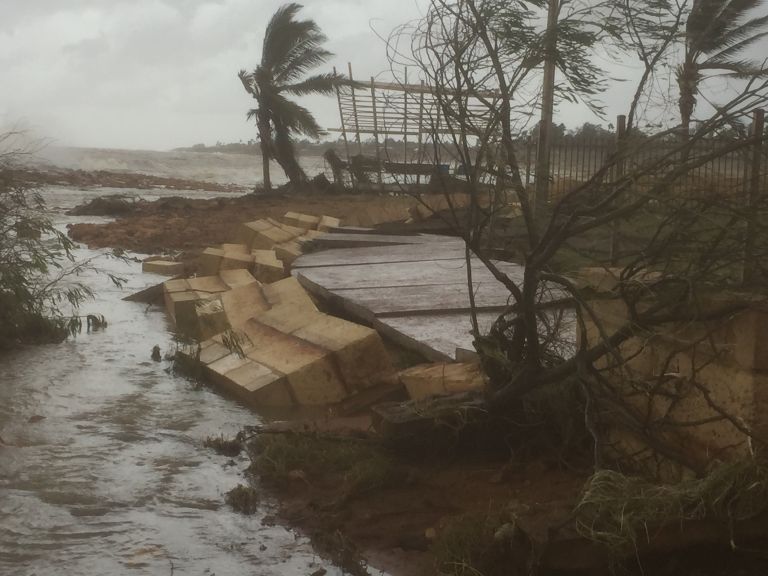
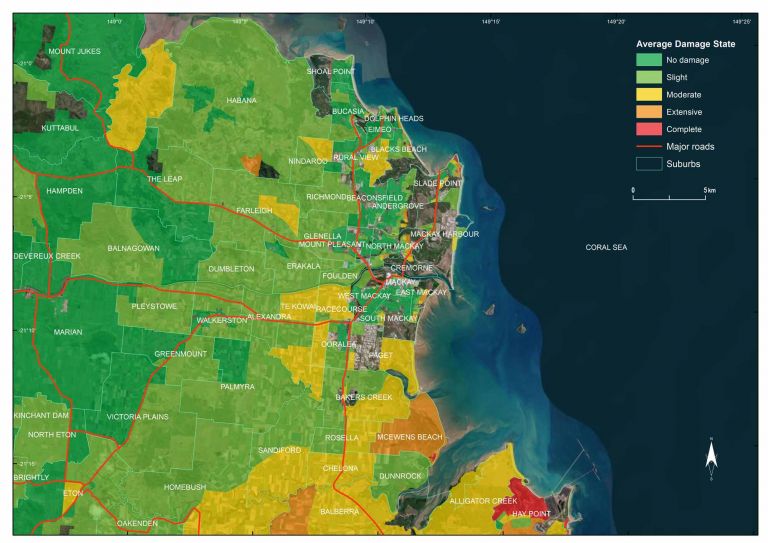
Tropical Cyclone Hazard Assessment (TCHA)
Define the severe wind hazard posed by tropical cyclones in Australia. Use it to calculate local cyclone impact models and develop evidence-based evacuation plans and mitigation strategies.
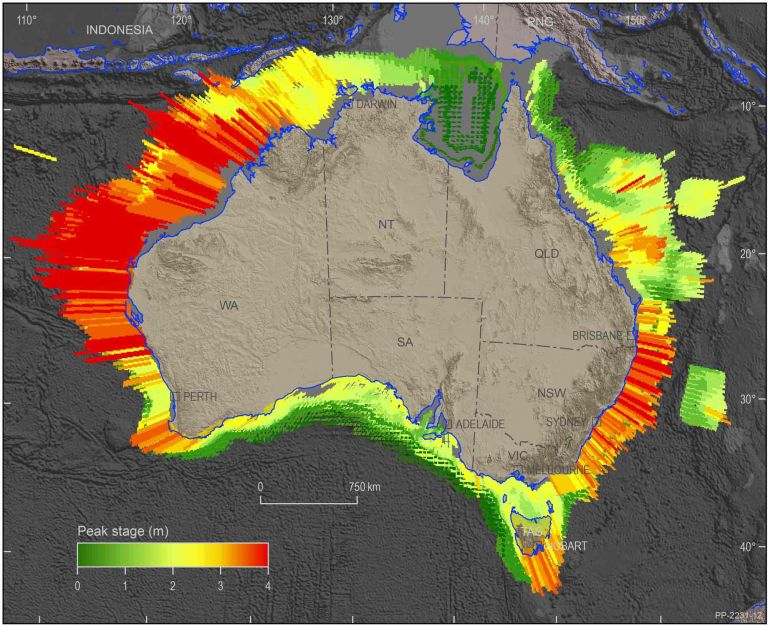
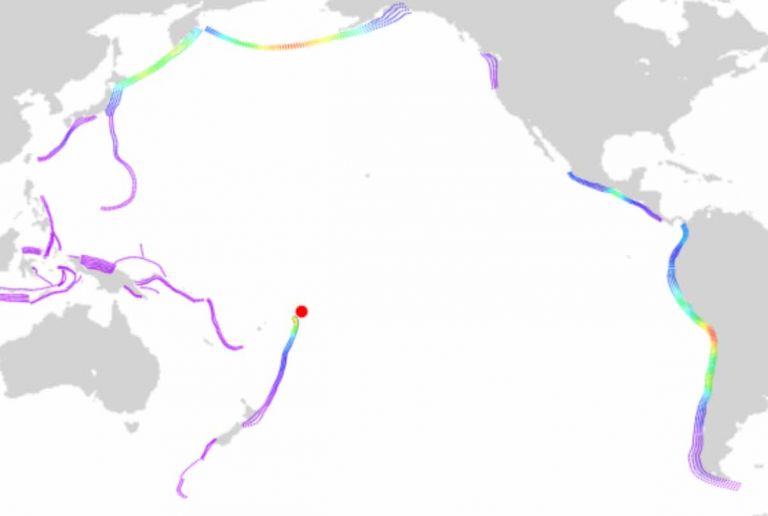
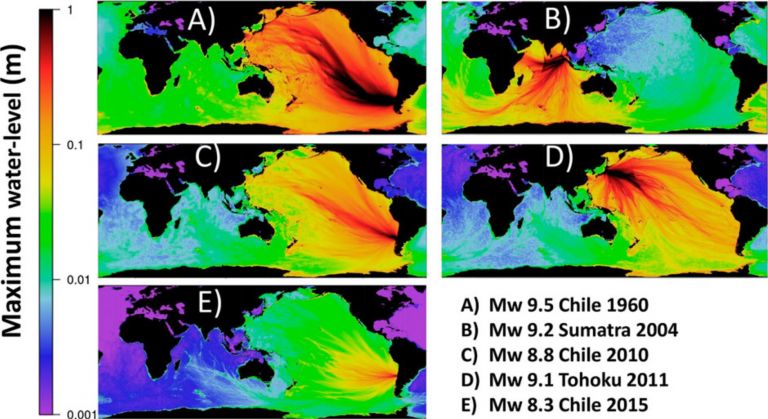
Probabilistic Tsunami Hazard Assessment (PTHA)
Model the frequency of tsunamis around the Australian coast.
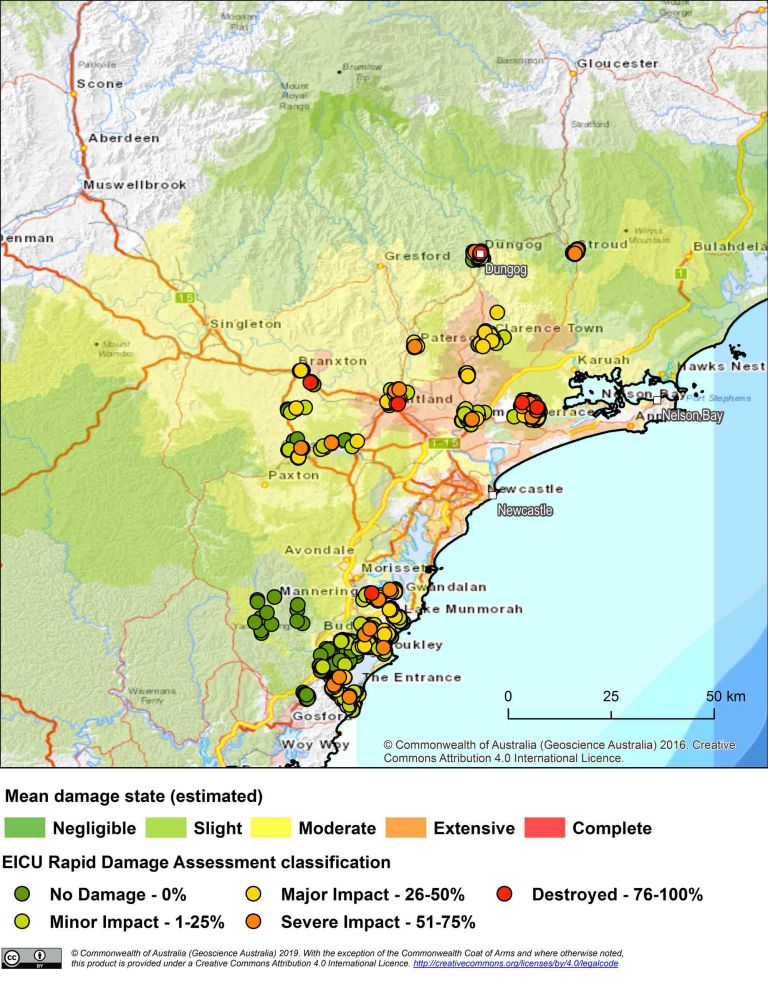
National Hazard Impact and Risk Service (NHIRS)
Investigate potential impacts from current tropical cyclone, severe wind and earthquake events using NHIRS, our automatic impact assessment service.

National Earthquake Alerts Centre (NEAC)
NEAC is the only earthquake monitoring and alerting service in Australia that is operational 24 hours a day.
Australian Rainfall and Runoff (ARR)
Learn more about the ARR Guidelines, which provide the best available information on Australian design flood estimation techniques to assist with design flood problems, flood processes and engineering hydrology.
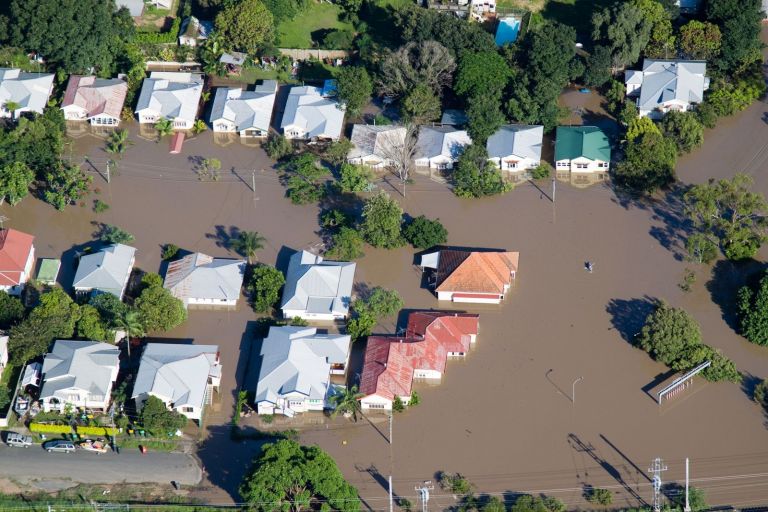
Australian Flood Risk Information Portal (AFRIP)
Learn more about the Australian Flood Risk Information Portal, which was created to be a central online location where high-quality flood risk information is stored.
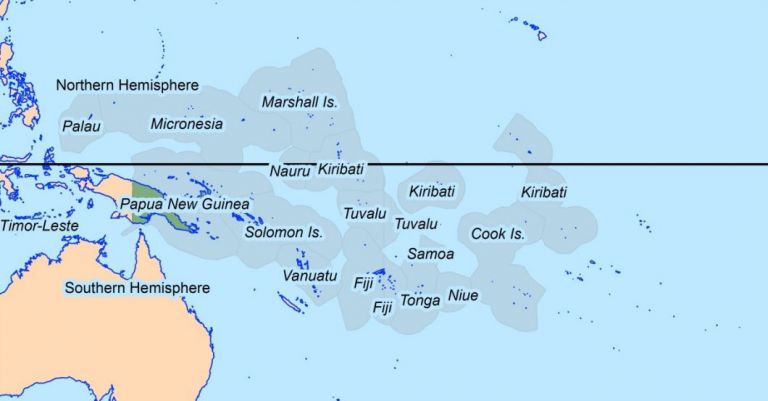
Probabilistic Tsunami Hazard Assessment (PTHA) Guidelines
Learn more about the PTHA Guidelines which are designed to support Pacific Island countries in using PTHA18 to produce tsunami inundation hazard information.
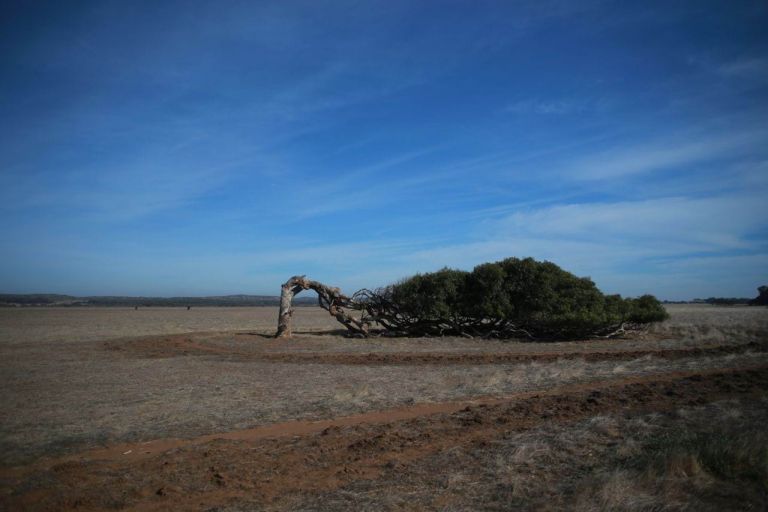
Wind multipliers
Learn more about our significant research on wind speed undertaken due to its importance in predicting, mitigating and managing major risks and hazards caused by wind.
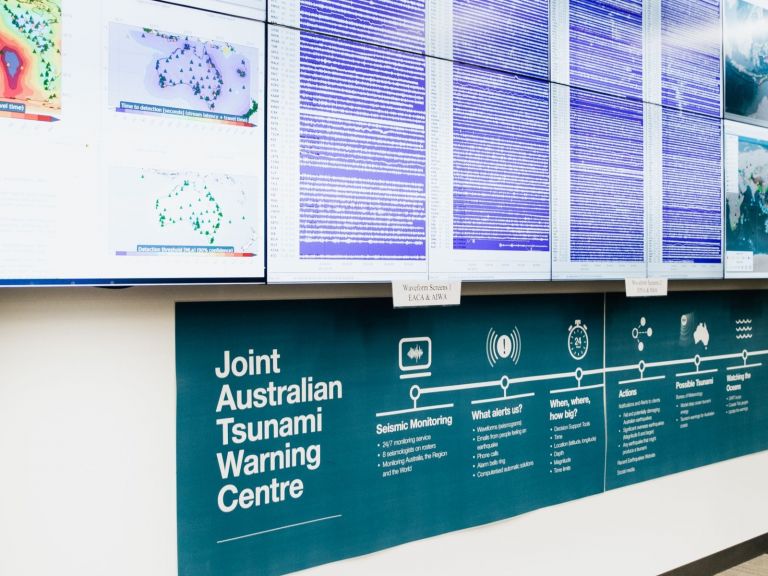
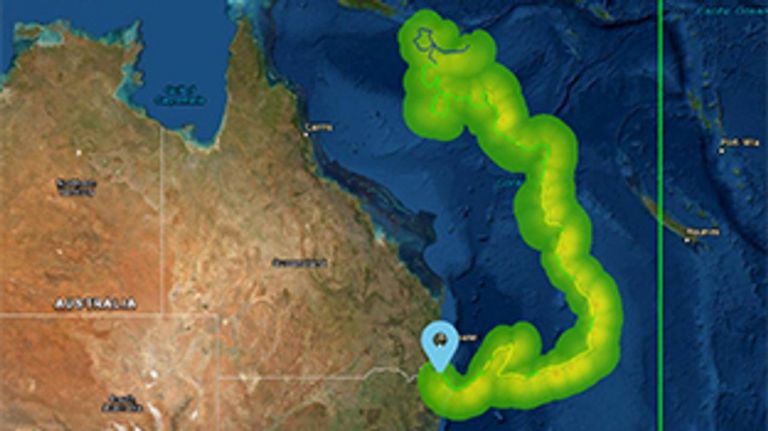
Joint Australian Tsunami Warning Centre (JATWC)
The Joint Australian Tsunami Warning Centre (JATWC) provides 24 hour tsunami monitoring, assessment and warnings.
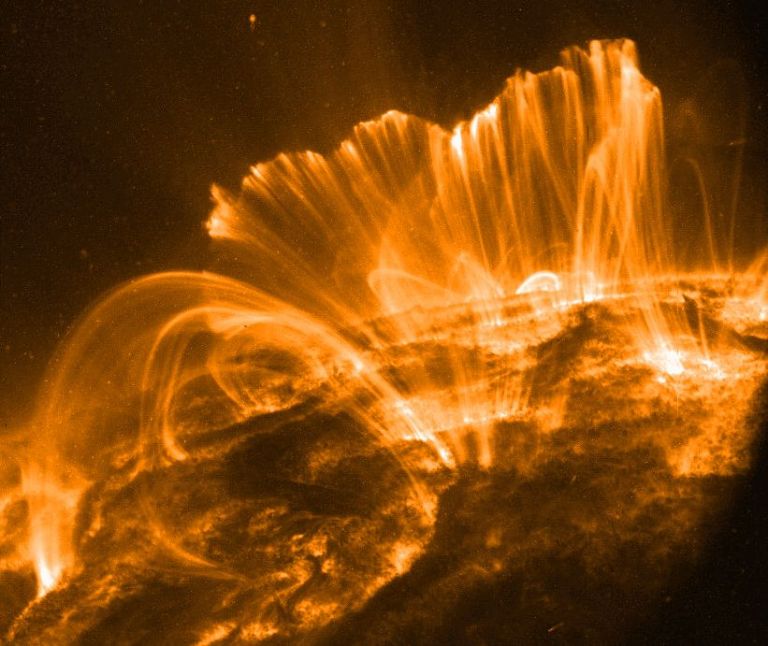
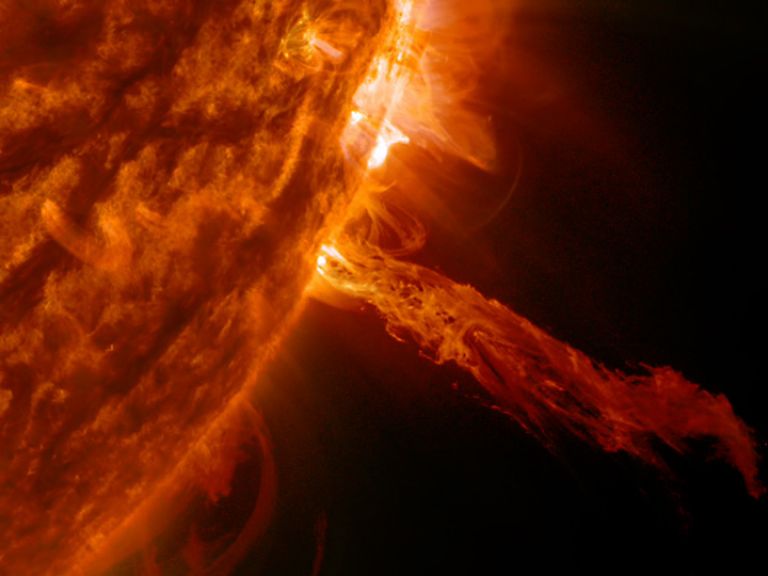
Geomagnetism - services and data
Geoscience Australia maintains a national network of geomagnetic observatories which forms part of a global observatory network.

National Exposure Information System
Use our nationally consistent exposure data to help understand what could be at threat from natural hazards.
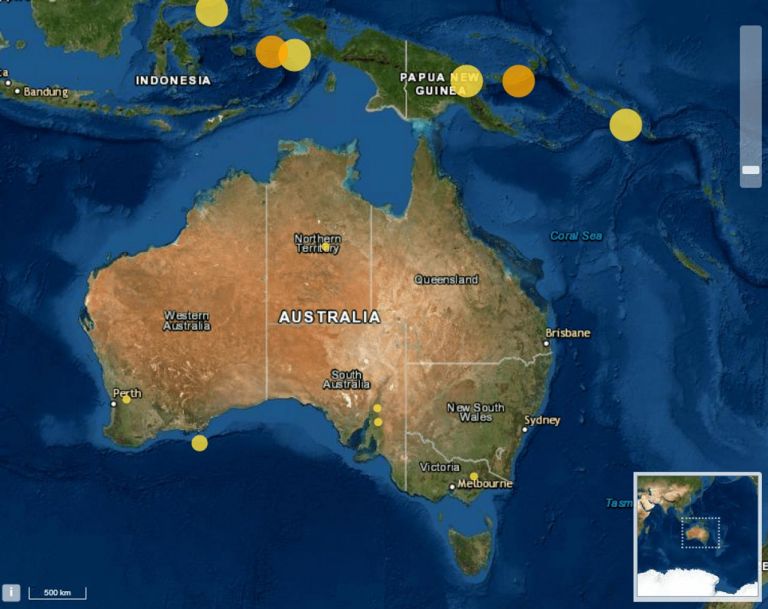
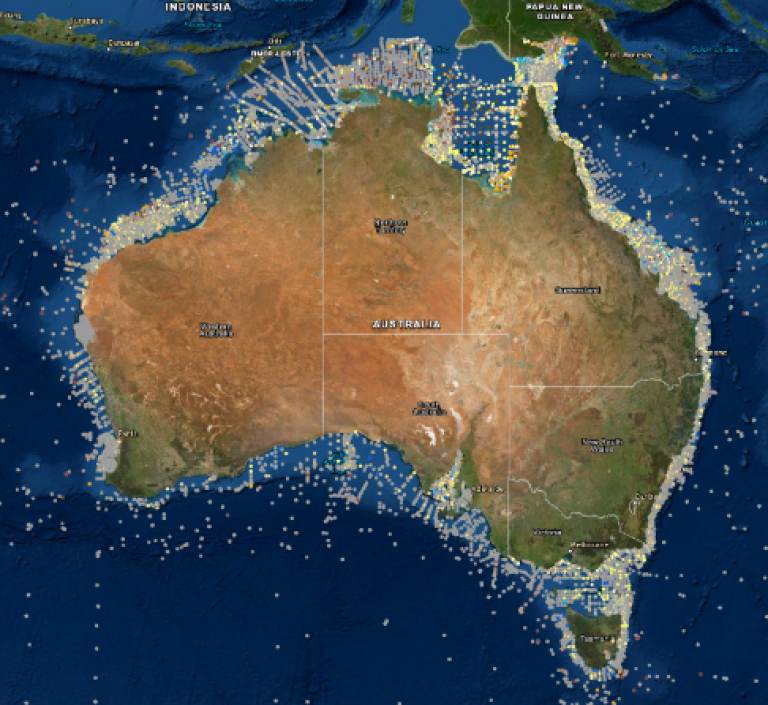
Recent earthquakes
Explore the details of recent earthquakes across Australia and around the world, and search Geoscience Australia’s record of past earthquakes.
Tropical Cyclone Scenario Selector Tool
Use this interactive tool for querying, visualising and downloading cyclone scenarios plausible future tropical cyclone scenarios used for risk management and planning.
Earthquake Scenario Selector Tool
Query, visualise and download earthquake scenarios using pre-generated scenarios that represent plausible events that can be used for earthquake risk management and planning.

Australian Exposure Information Portal (AEIP)
Develop a statistical summary of the number of people, dwellings, buildings, infrastructure assets, agricultural and environmental assets potentially exposed during a threat or hazard event.
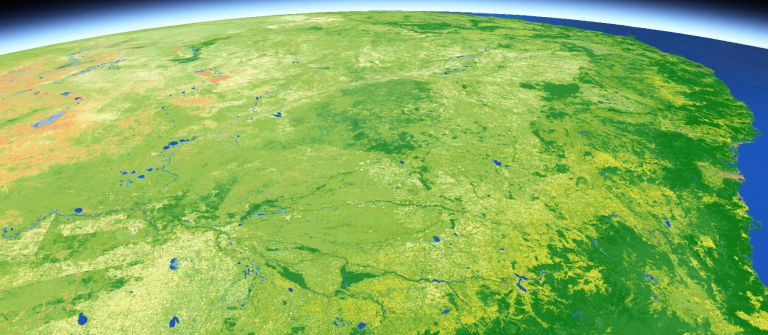
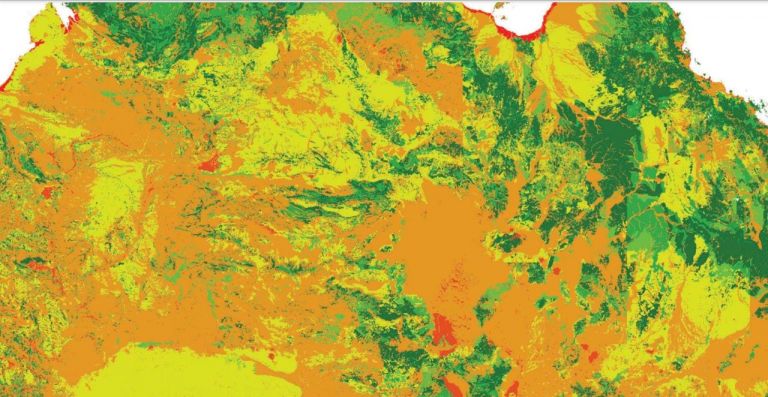
DEA Land Cover
Satellite data insights into land, vegetation, and waterbodies changes down to every square 30 metres across Australia since 1988.
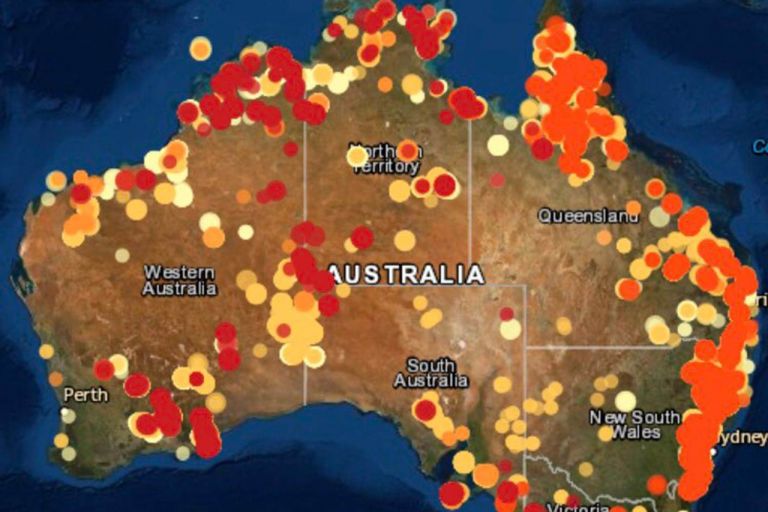
Digital Earth Australia Hotspots
Detect areas producing high levels of infrared radiation, using our rolling archive of imagery and data.
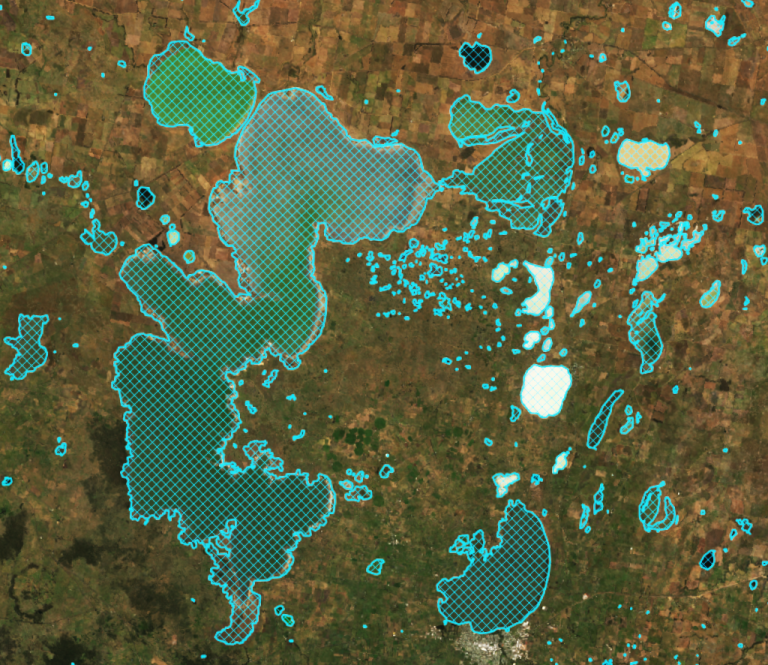
DEA Waterbodies
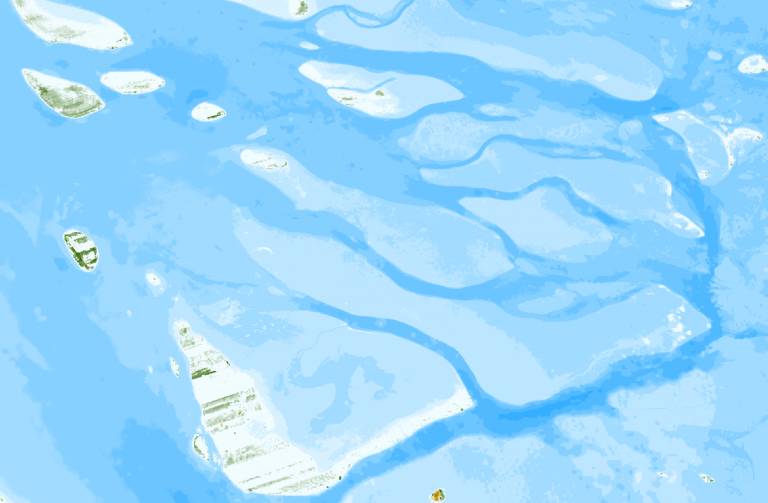
View the mapping of more than 300,000 waterbodies across Australia with wet surface area present more than 10% of the time.
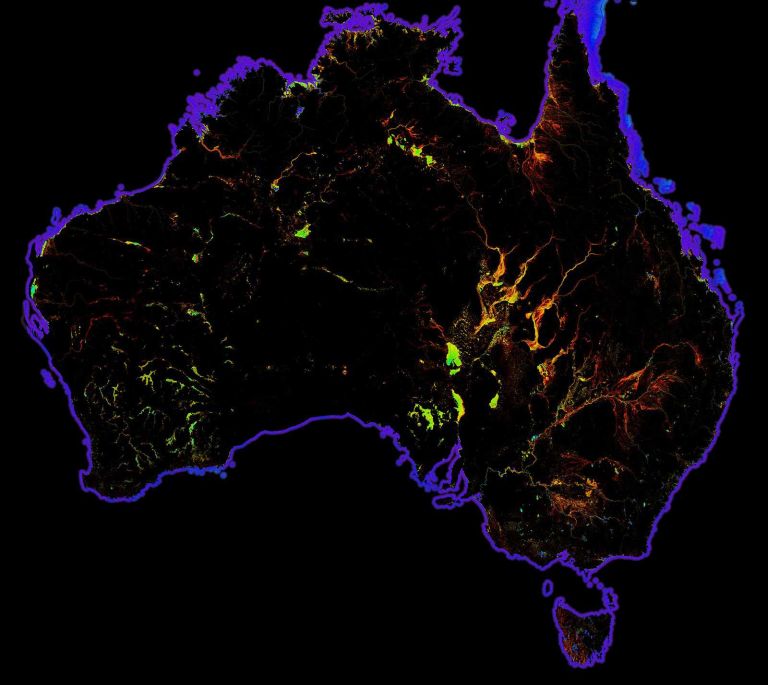
DEA Water Observations
Continent-scale map of surface water that classifies each pixel from Landsat satellite imagery as wet, dry or invalid.
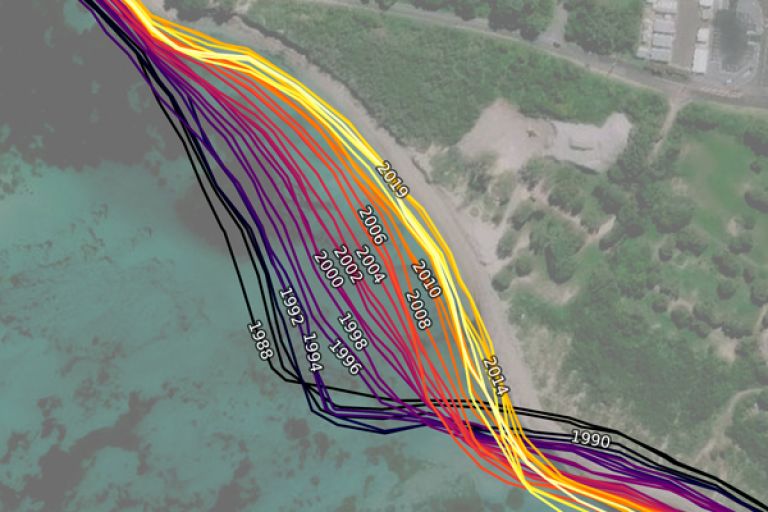
DEA Coastlines
Satellite data with tidal modelling combined to map typical annual locations of mean sea level coastlines since 1988.
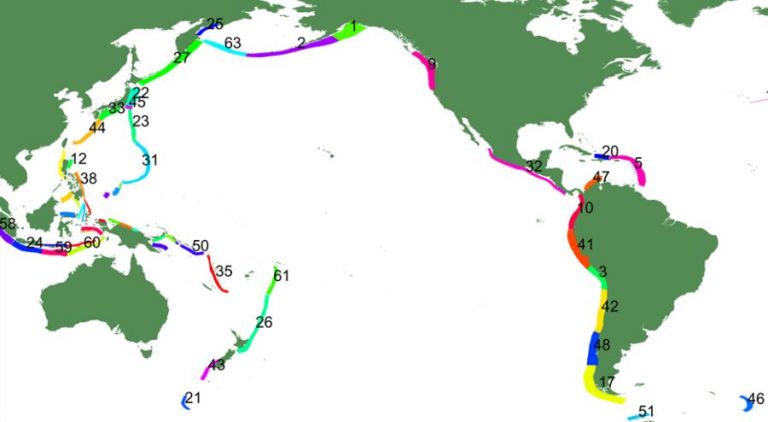
A global probabilistic tsunami hazard assessment from earthquake sources
Read the publication that extends previous global-scale assessments based largely on scenario analysis.
A Statistical-Parametric Model of Tropical Cyclones for Hazard Assessment
Learn about the formulation of an open-source, statistical-parametric model of tropical cyclones for use in hazard and risk assessment applications.
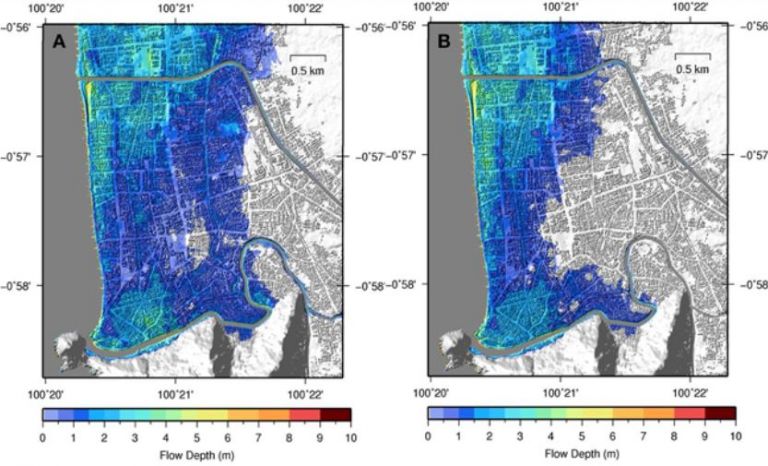
An evaluation of onshore digital elevation models for modeling tsunami inundation zones
Different onshore digital elevation models (DEMs) for simulating the extent of tsunami inundation using case studies from two locations in Indonesia.
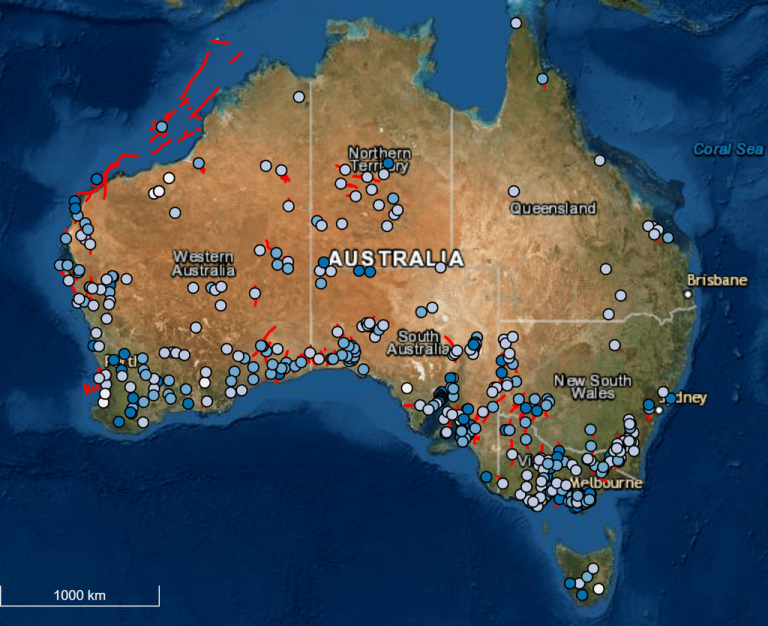
Australian Neotectonic Features Database (NFD)
Visit our inventory of over 370 Australian intraplate faults, fault-related folds and other features relating to earthquakes large enough to deform the Earth’s surface.
Australian Seismic Site Conditions Map (ASSCM)
Determine the potential behaviour of geological materials under the influence of seismic ground shaking at a site of interest.
Assessment of Tropical Cyclone Risk in the Pacific Region: Analysis of Changes to Key Tropical Cyclone Parameters
An assessment of the financial risks to buildings, infrastructure and agriculture arising from tropical cyclones under current and future climate regimes.
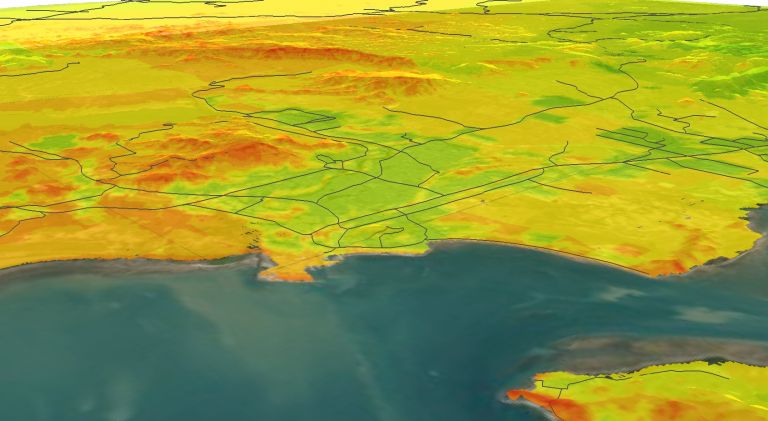
Elevation Information System (Elvis)
Use the national portal of elevation datasets which describe the shape and height of Australia’s landforms and depth of the seabed.
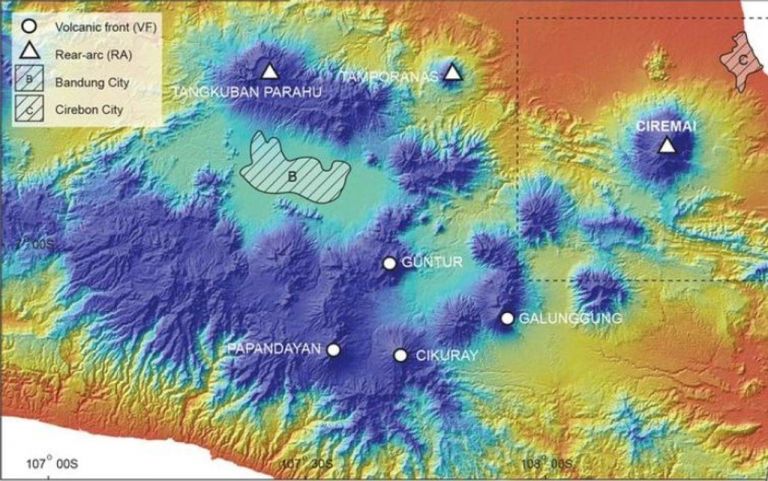
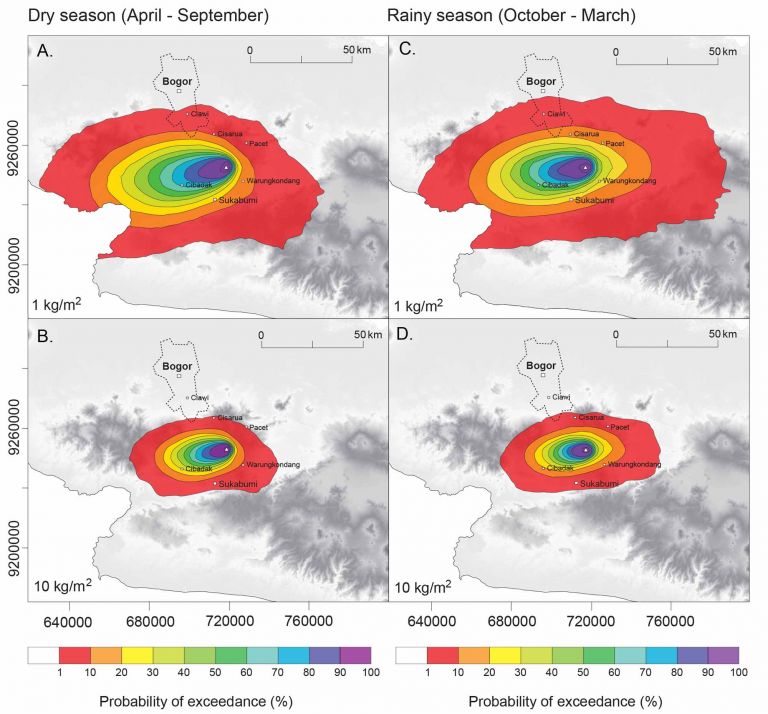
Evaluating a volcanic ash ground-loading hazard at Gunung Ciremai, West Java, Indonesia using PF3D
The Implications for nearby communities of dry v. rainy season conditions on volcanic ash hazard.
Tropical Cyclone Hazard Assessment (TCHA) publication
Vital information to help communities plan and reduce the threat of tropical cyclone hazards on the Australian coast.
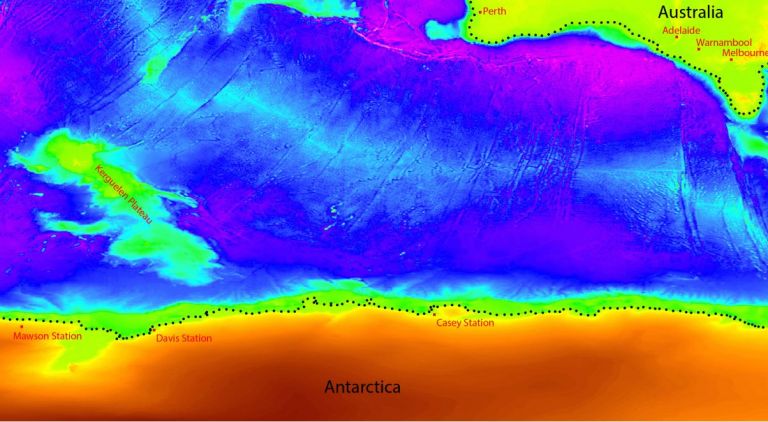
Tsunamigenic potential of the Kerguelen Plateau
Non-seismic tsunami hazard scenario modelling of landslide generated tsunami initiation and its impact on the Australian and Antarctic coastlines.

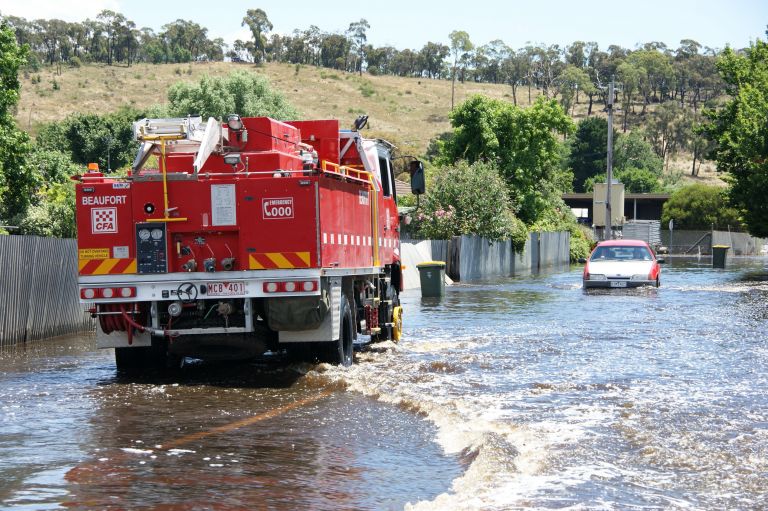
Vulnerability of Australian Houses to Riverine Inundation: Analytical and Empirical Vulnerability Curves
Improve the knowledge of the vulnerability of Australian domestic housing to riverine inundation, with focus on south-east Queensland housing types.
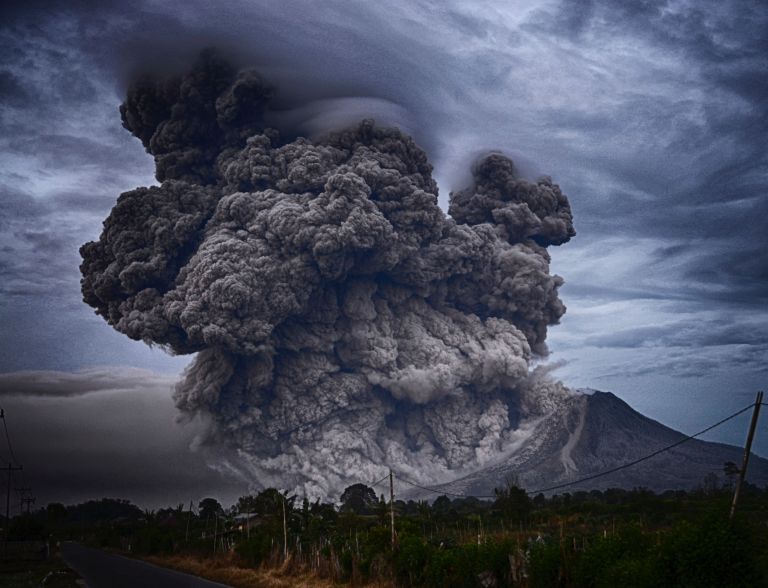
Volcanic ash fall hazard and risk
Why comprehensive volcanic hazard assessment must include ash fall in addition to more localised hazards.
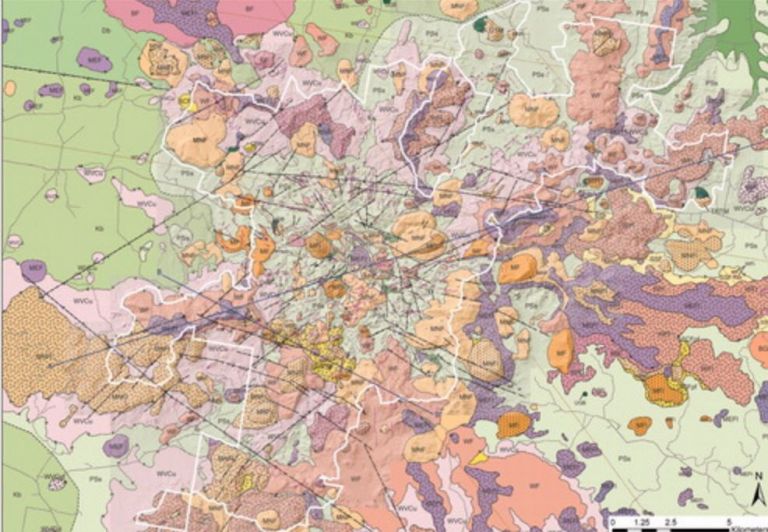
Warrumbungle Volcano: Facies architecture and evolution of a complex shield volcano
A new geological map of Warrumbungle Volcano created from volcanic facies field mapping, new geophysical, geochemical, and geochronological data.
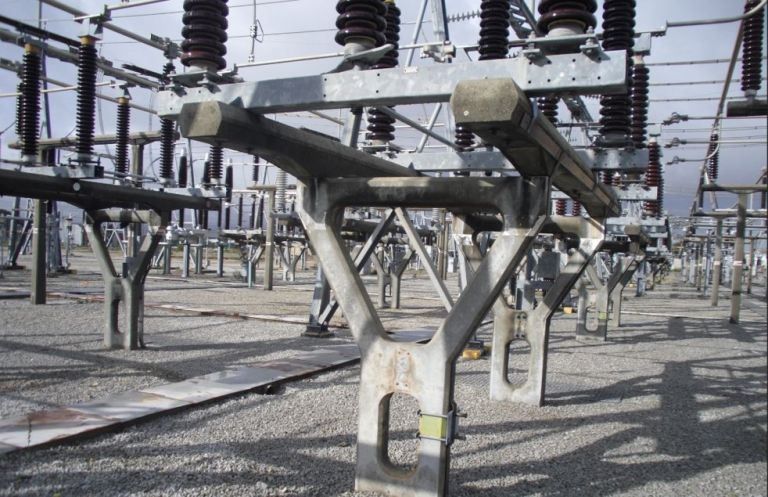
Systemic Infrastructure Resilience Analysis (SIRA)
Analyse the fragility of infrastructure facilities to natural hazard impacts.
Vulnerability and Adaptation to Wind Simulation (VAWS)
Model the vulnerability of small buildings to wind and examine the change in vulnerability by mitigation measures.
Tropical Cyclone Risk Model Software (TCRM)
Estimate average recurrence interval wind speeds and potential tropical cyclone wind hazard.

National Seismic Hazard Assessment of Papua New Guinea (NSHA-PNG)
Define the level of earthquake ground shaking across Papua New Guinea, and identify higher hazard areas.
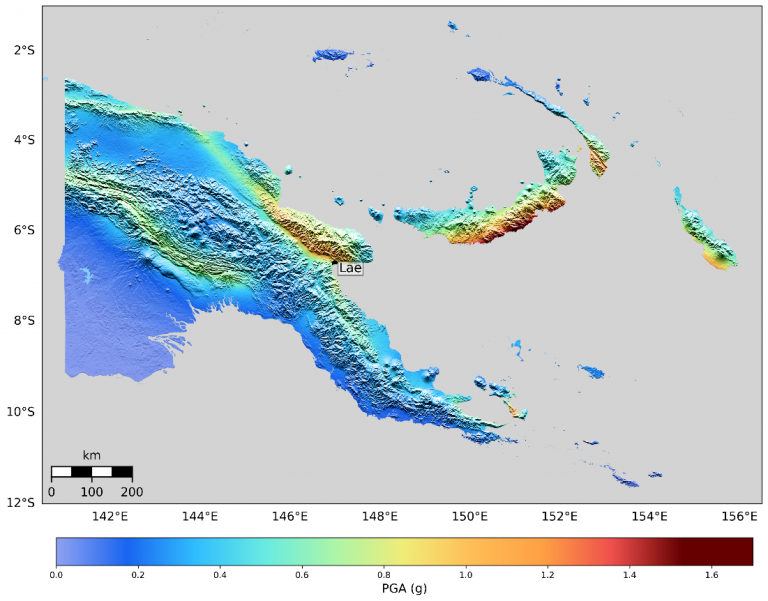
National Seismic Hazard Assessment of Papua New Guinea (NSHA-PNG)
Read the report on defining the level of earthquake ground shaking across Papua New Guinea, and identify higher hazard areas.
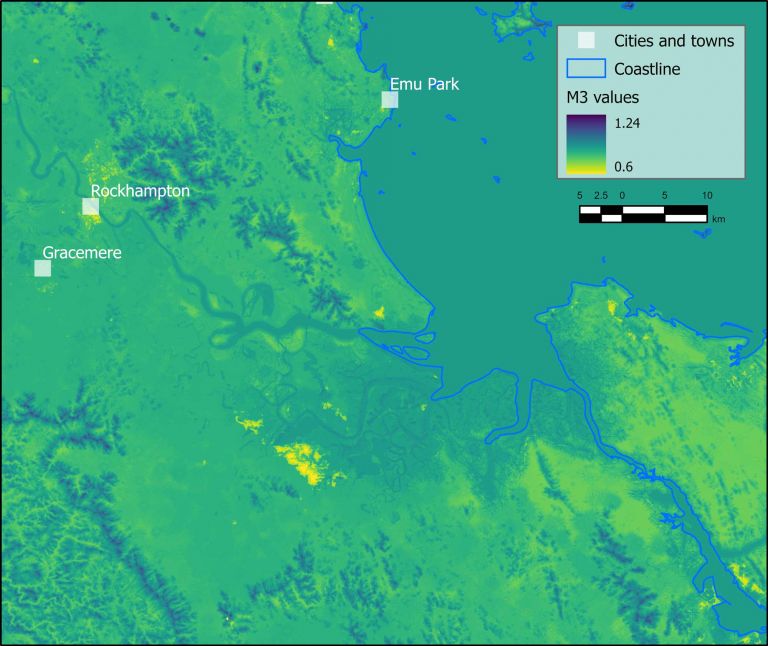
National wind multipliers dataset
Evaluate local wind speeds over topography and different land cover types, which can be used for applications like determining the speed of a fire front.

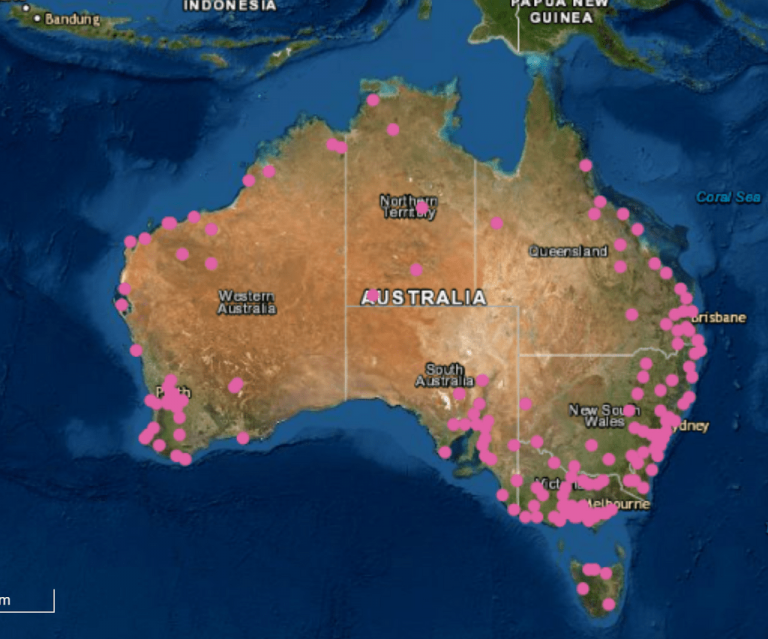
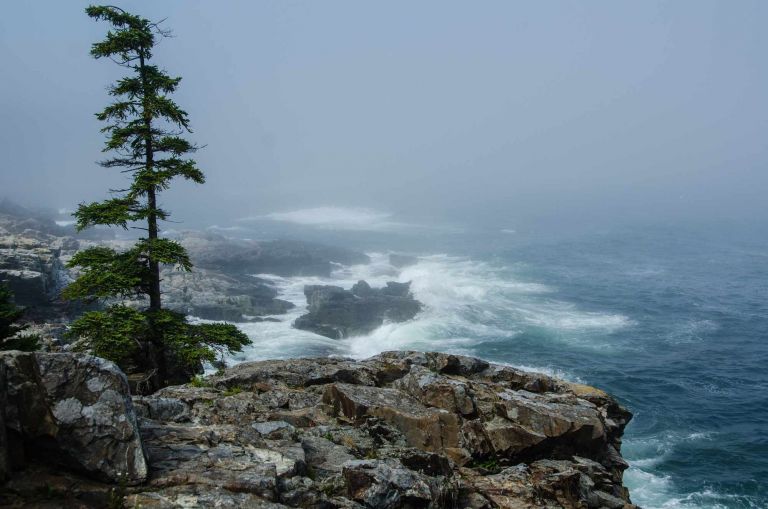
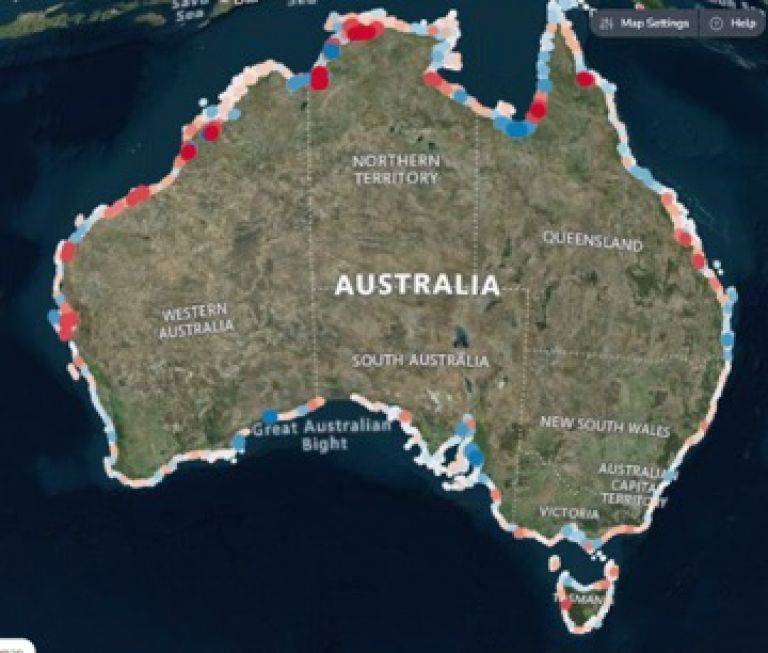
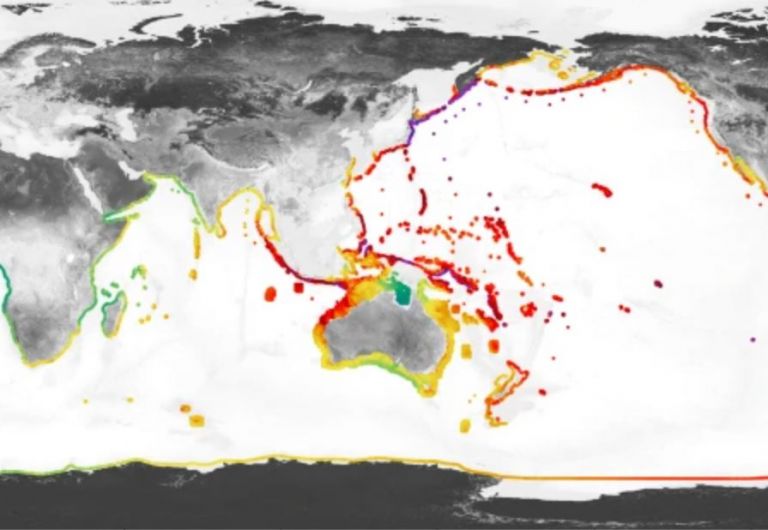
Geomorphic classification of the Australian coast
Utilise the first phase of our national map of Australia’s coastal geomorphology.
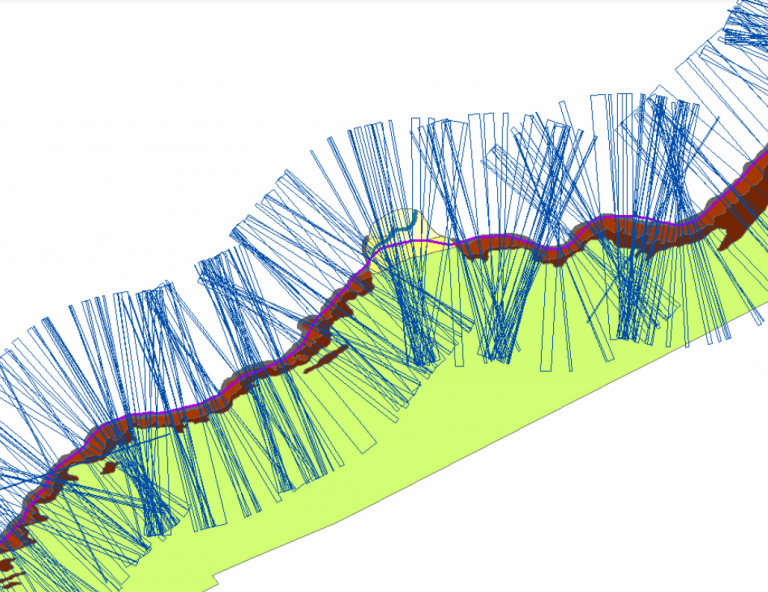
Smartline
Understand vulnerability to sea level rise and other coastal hazards, such as storm surge.
Coastal sediment compartments
Understand sediment movement along the coast and use it to inform management of climate-induced changes.
Interactive maps
View our marine geoscience program maps that classifies the geomorphology of the coast and seabed at multiple spatial scales.
Practical Earthquake Location on a Continental Scale in Australia Using the AuSREM 3D Velocity Model
The full 3D earthquake location for the Australian continent, exploiting the recent 3D Australian Seismological Reference Model.
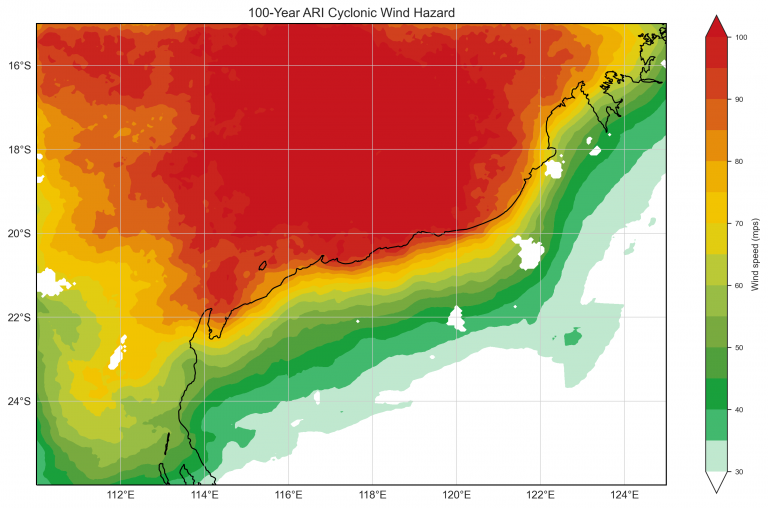
Severe Wind Hazard Assessment: Tropical Cyclone Scenarios for coastal Western Australian Communities
Gaining a better understanding of the potential impacts of tropical cyclones and extra-tropical transitioning cyclones on Western Australian communities.
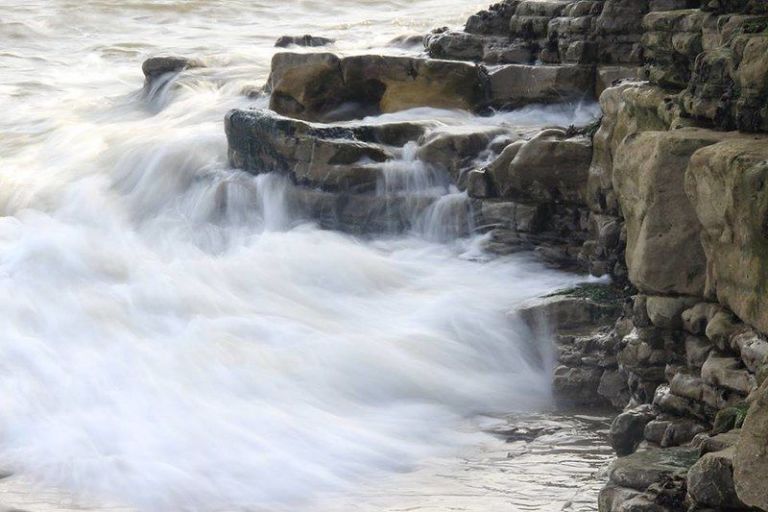
Coastal erosion story map
Understand cause, response and impact of coastal erosion in situations where storm clusters are recognised as a possible driver.
Mapping Australia’s dynamic coastline at mean sea level using three decades of Landsat imagery
A national overview of trends in coastal change since the late 1980s.
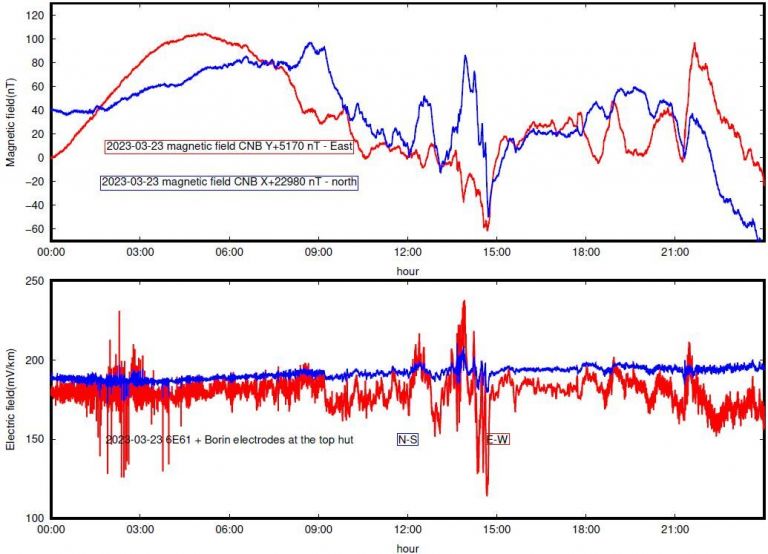
Geomagnetic data
Access to plots of real-time data from magnetic observatories in the Australian observatory network.
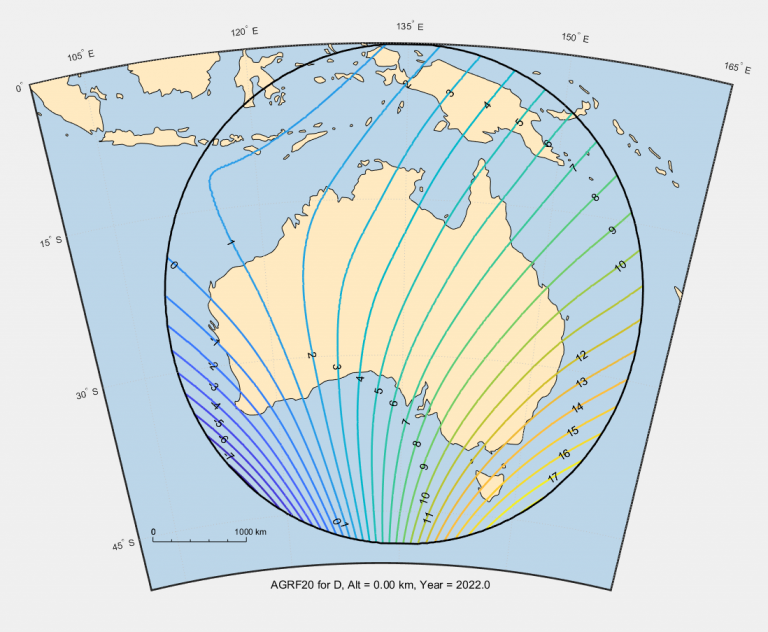
Australian Geomagnetic Reference Field Values (AGRF)
Calculate geomagnetic field values in Australia.

Minute values request form
Request minute values from one observatory in the Australian Geomagnetic Observatory Network for a specified time period. Outputs are available as a plot or as a data file.
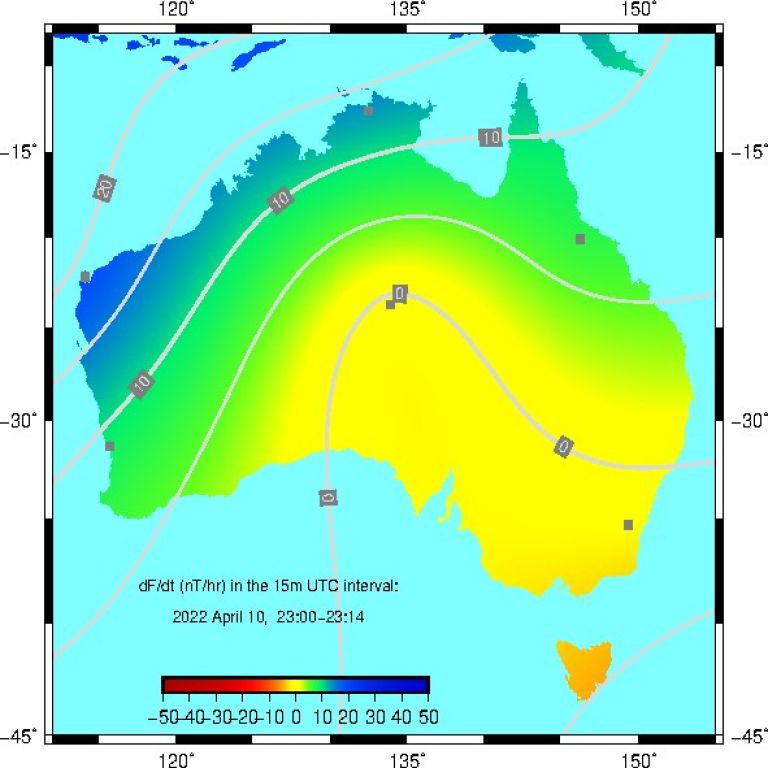
Australia-wide total intensity variability
Gain a broad view of how the rate-of-change of magnetic total intensity changes across Australia.

Indices of geomagnetic activity
Characterise the variability of the Earth's magnetic field, for a specific time period, in a single number.
Bathymetry
View the datasets and procedures used to produce the 2009 bathymetric grid of Australia.
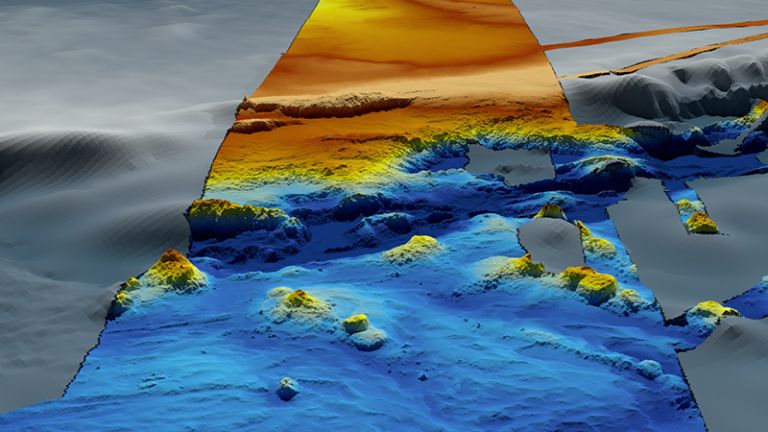
Multibeam bathymetry
View high resolution bathymetric grids from each of our marine surveys.
Local Wind Assessment in Australia: Computation Methodology for Wind Multipliers
Evaluate local wind speeds over topography and different land cover types, which can influence the speed of the fire front.
Improved Treatment of Non-Stationary Conditions and Uncertainties in Probabilistic Models of Storm Wave Climate
A framework for the probabilistic modelling of non-stationary coastal storm event sequences to help integrate seasonal, climatic and long-term stationarities into coastal erosion hazard assessments.
Forecasting the impacts of severe weather
A review of current severe weather warnings and impact forecasting capabilities globally, highlighting uncertainties that limit the forecasting and modelling of multi-hazard events.
Seismic hazard estimation in stable continental regions: does PSHA meet the needs for modern engineering design in Australia?
The challenges facing seismic hazard analysis in regions of low seismicity, with emphasis on the Australian continental setting.
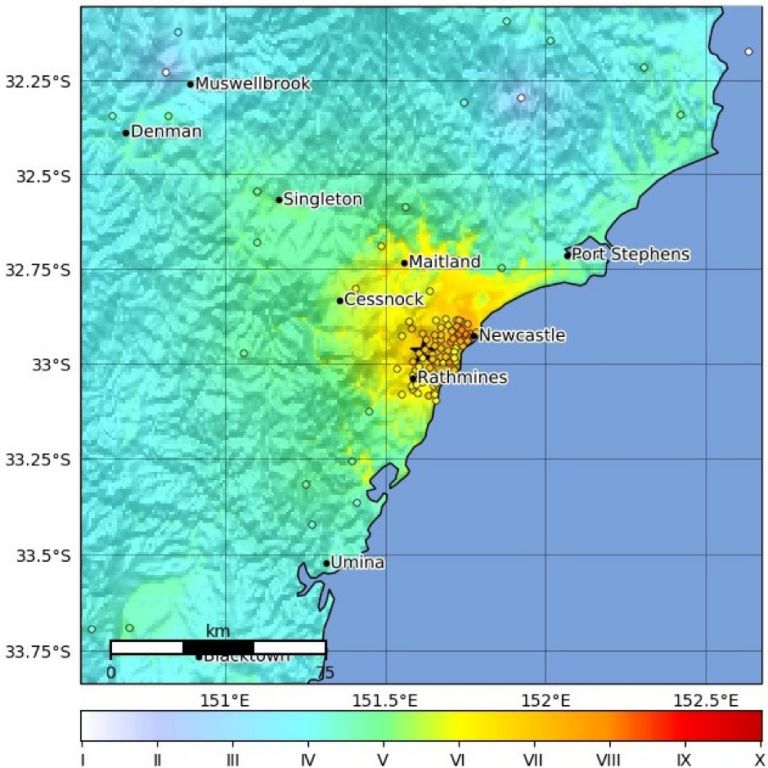
Real-Time Community Internet Intensity Maps and ShakeMaps for Australian Earthquakes
The new felt reporting system and its utility for near-real-time ShakeMaps and the provision of situational awareness for significant Australian earthquakes.
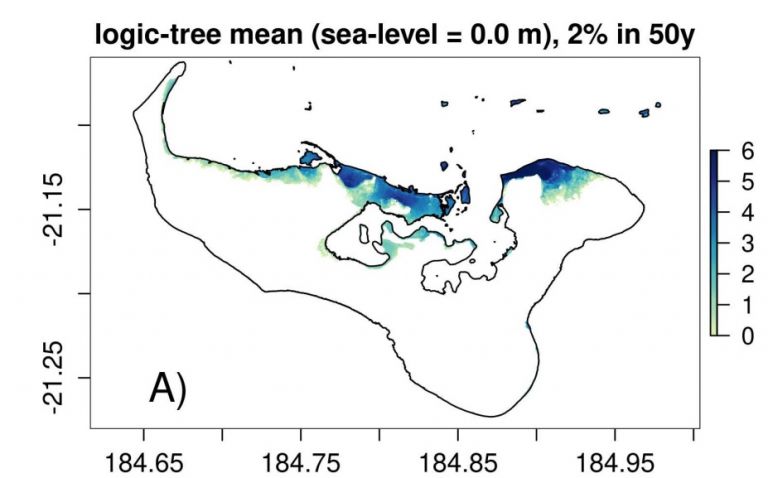
From offshore to onshore probabilistic tsunami hazard assessment via efficient Monte Carlo sampling
Develops efficient Monte Carlo techniques for transforming offshore probabilistic tsunami hazard assessments into inundation hazard assessments, with full characterisation of uncertainties.
Global Dissipation Models for Simulating Tsunamis at Far-Field Coasts up to 60 hours Post-Earthquake: Multi-Site Tests in Australia
A pragmatic approach to improving unit-source based global tsunami simulations at late times.
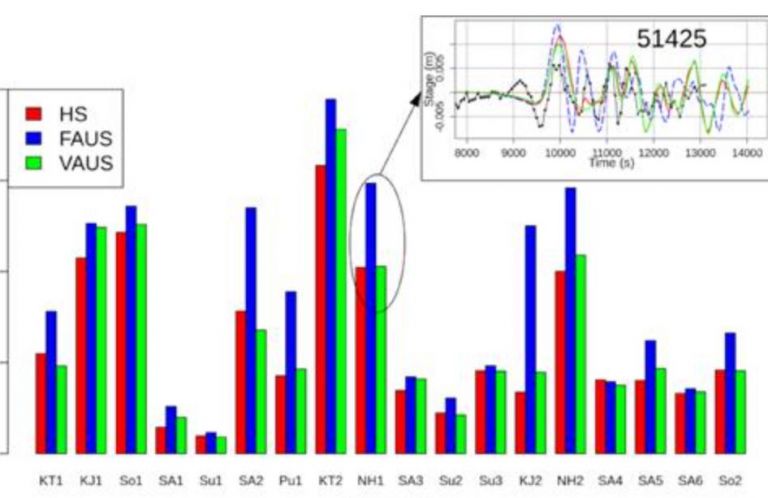
Sensitivity of Probabilistic Tsunami Hazard Assessment to Far-Field Earthquake Slip Complexity and Rigidity Depth-Dependence: Case Study of Australia
A consistent treatment of earthquake-scenario rates for PTHA using different slip and rigidity models, while maintaining reasonable consistency with the historical earthquake record and tectonic constraints.
Tsunami variability from uncalibrated stochastic earthquake models: tests against deep ocean observations 2006–2016
Three models on subduction zones by comparison with deep ocean observations from 18 tsunamis during the period 2006–2016.
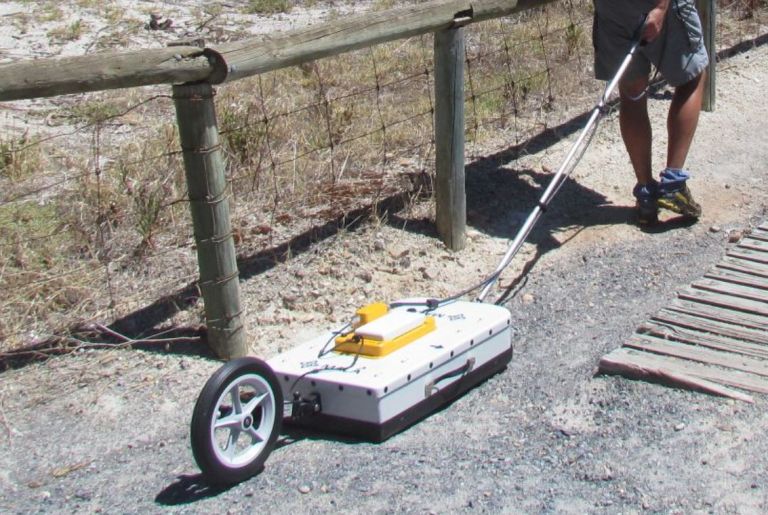
Ground Penetrating Radar Data (GPR)
Determine the thickness of sediment for modelling beach response to storm surge.
Marine Sediments Database (MARS)
Access data that describes the physical properties of our national seabed sediment samples.
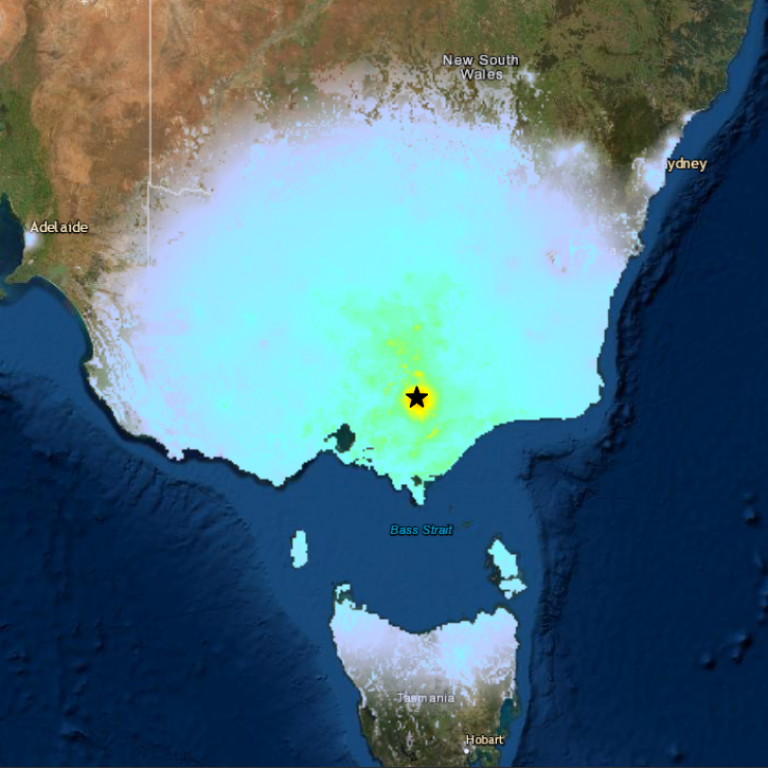
Geoscience Australia ShakeMap
See maps of modelled ground shaking for recent Australian earthquakes of magnitude 3.5 or greater, and download related data and metadata products.
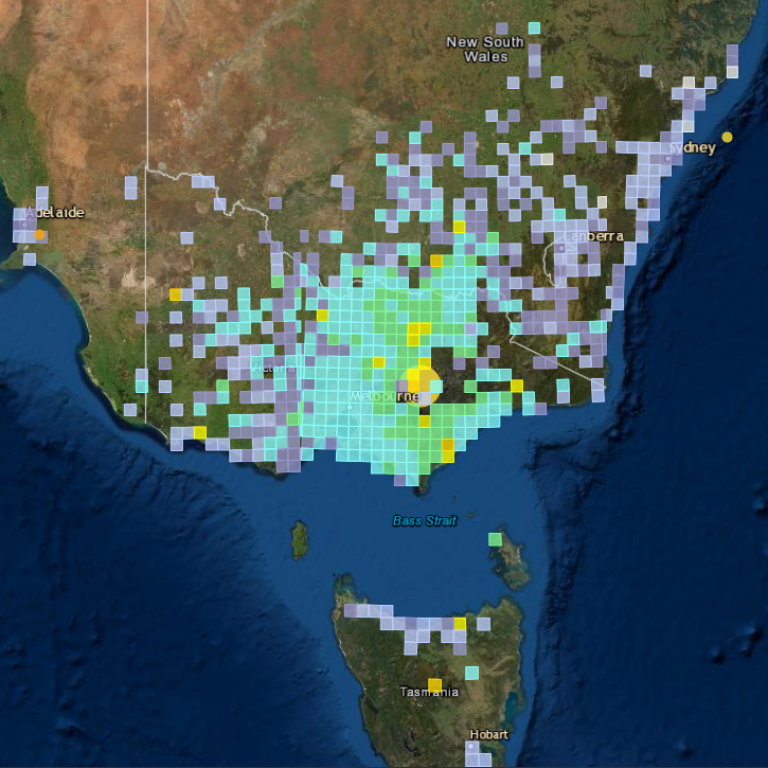
Geoscience Australia FeltGrid
See maps of ground shaking intensity from an earthquake as reported to us by the community.
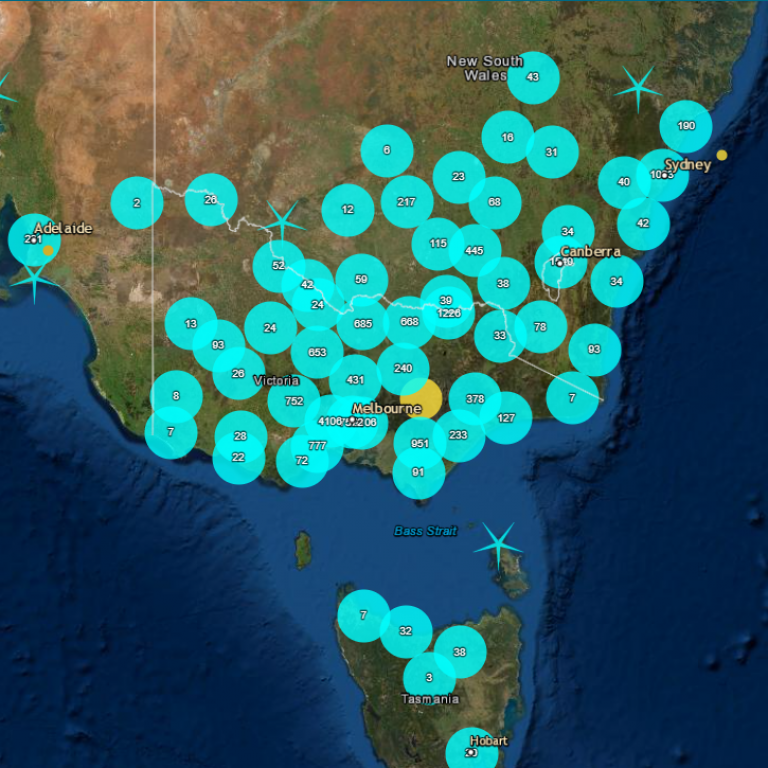
Felt report
Did you feel an earthquake? Tell us, and see whether other people in your area, or further afield, felt it too.
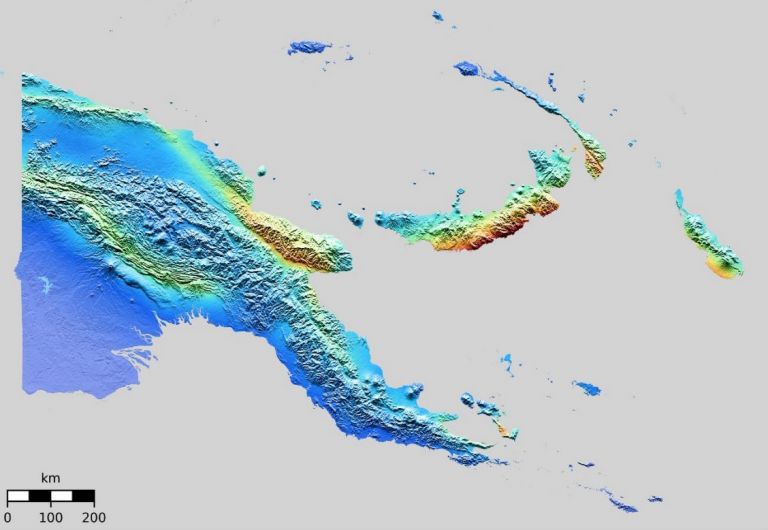
National Probabilistic Seismic Hazard Assessment for Papua New Guinea 2019 Revision
Confirming the need for an updated hazard map for building design.

Stormwavecluster
Utilise statistical modelling that provided insights into the significance of storm clusters, and their impact on beaches.
Python-Fall3D
Use the FALL3D package to generate deterministic, probabilistic and forecast scenarios for volcanic ash dispersal.
Estimating Extreme Geoelectric Field Values for the Australian Region
The results of an analysis to estimate extreme geoelectric field values for the Australian region to facilitate evaluation of Australia's power system response to extreme geomagnetic storms.
Modelling geomagnetic induction hazards using a 3-D electrical conductivity model of Australia
The surface electric field induced by external geomagnetic source fields is modeled for a continental-scale 3-D electrical conductivity model of Australia at periods of a few minutes to a few hours.
Hazard Impact Assessment (Hazlmp)
Upload hazard, exposure and vulnerability data into this software to analyse the potential damage caused by natural hazards.
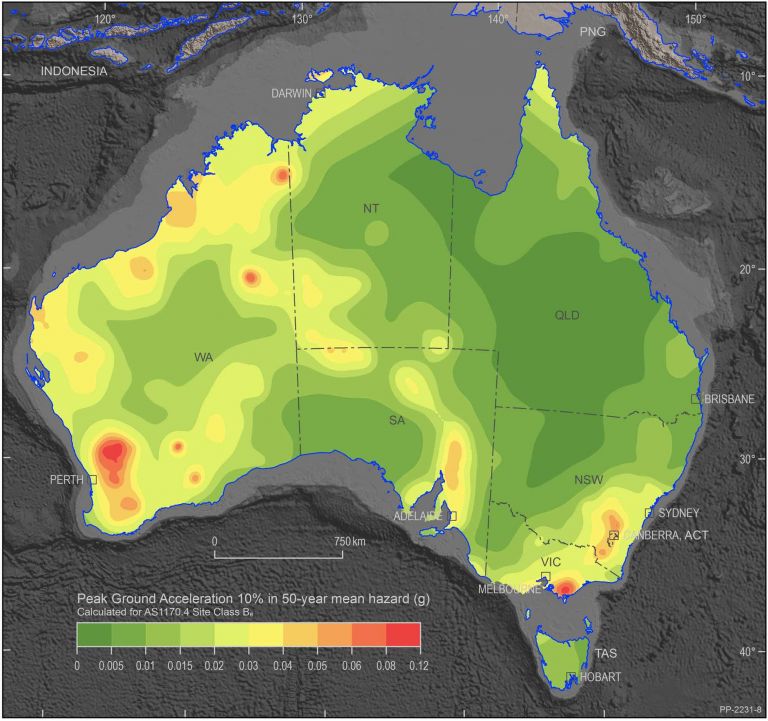
The 2018 national seismic hazard assessment of Australia: Quantifying hazard changes and model uncertainties
The development of the NSHA18 and the rationale for the changes in seismic hazard for Australia relative to previous national-scale assessments.
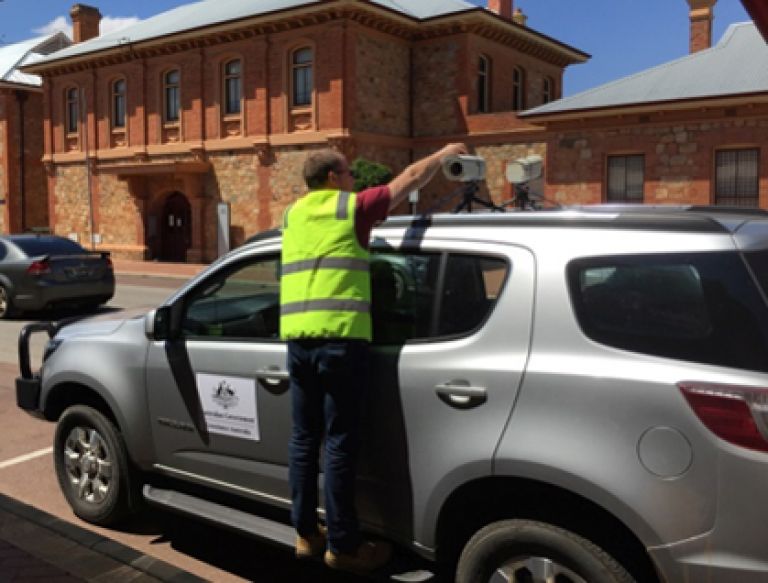
Rapid Inventory Capture System (RICS)
Capture and save geo-tagged digital imagery of built environments using this rapid inventory capture system.
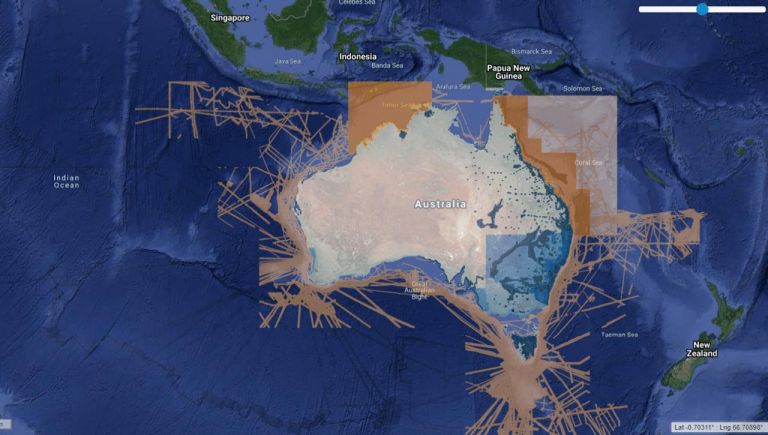
AusSeabed Marine Data portal
Explore seafloor mapping products, such as bathymetry, backscatter, side scan sonar data, as well as a suite of analytical assessment tools, across Australia’s marine jurisdiction prior to downloading.