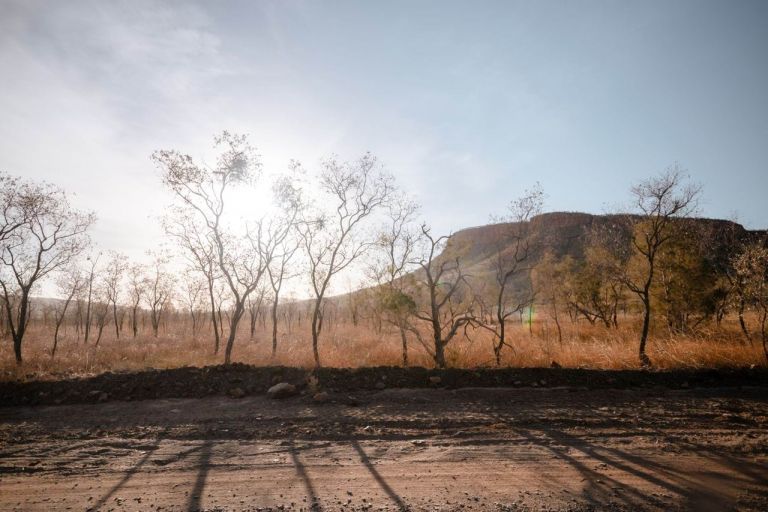
Hazards Drought
Page last updated:18 June 2024
We support Australia’s ability to observe the impact of drought and water availability and are committed to optimising and sustaining its use.
Our role
We identify the location, quantity and quality of Australia’s groundwater resources to support sustainable water management and the wellbeing and prosperity of our agricultural and regional communities.
Our data enables better understanding of where water is usually present, where it is seldom observed and where inundations have occurred.
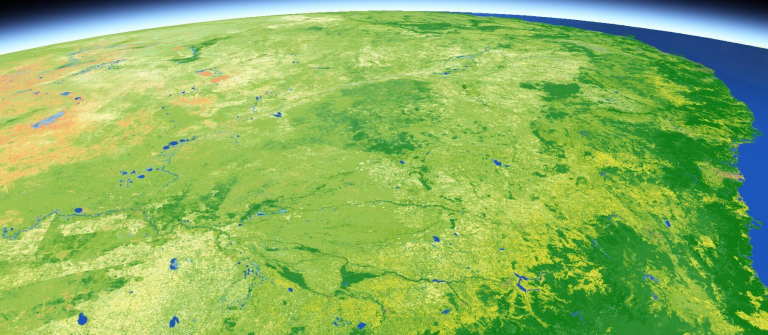
Our land cover information describes 22 classes of land cover types that offer insights into drought, water and ecosystem changes.
Our archive of over 30 years of Landsat satellite imagery is used to identify where almost 300,000 waterbodies are in the Australian landscape and tells us the wet surface area within those waterbodies.
Our products, tools and data provide a better understanding of Australia’s landscape and water vulnerabilities for all sectors to plan, prepare and reduce exposure to natural hazards, improving community safety now and into the future.
Emerging capabilities
We engage with different sectors to provide assessments and address new challenges as they emerge and are collaborating to deliver a complete understanding of our changing landscape and the nations surface and groundwater resources.
- We are working towards a complete map of Australia’s groundwater system with estimated resource volumes.
- Our Researchers are committed to growing our knowledge base to prepare for challenges of the future.
- Our open-source data is accessed to develop new technology to solve Australia’s challenges of drought, water vulnerability and exposure to natural hazards, that are exacerbated with a changing landscape.
Top products
Satellite data insights into land, vegetation, and waterbodies changes down to every square 30 metres across Australia since 1988.
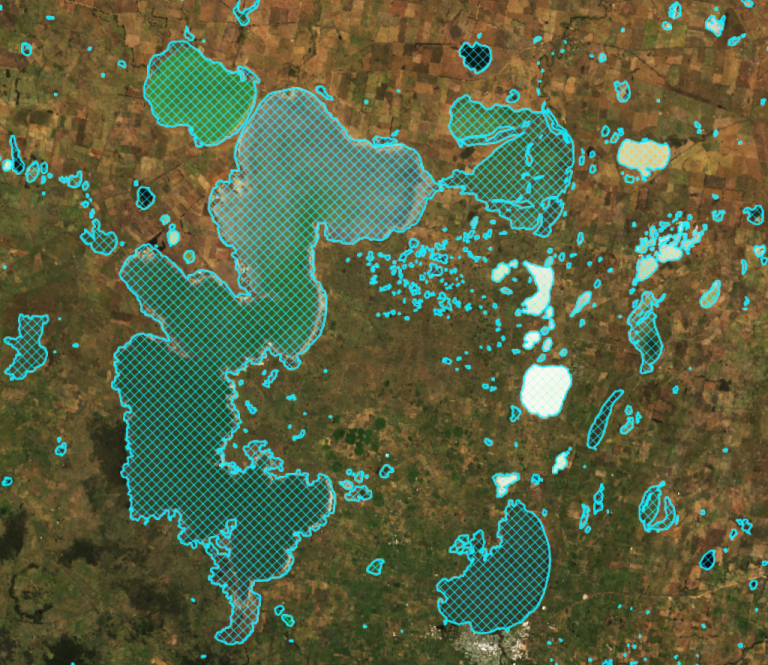
View the mapping of more than 300,000 waterbodies across Australia with wet surface area present more than 10% of the time.
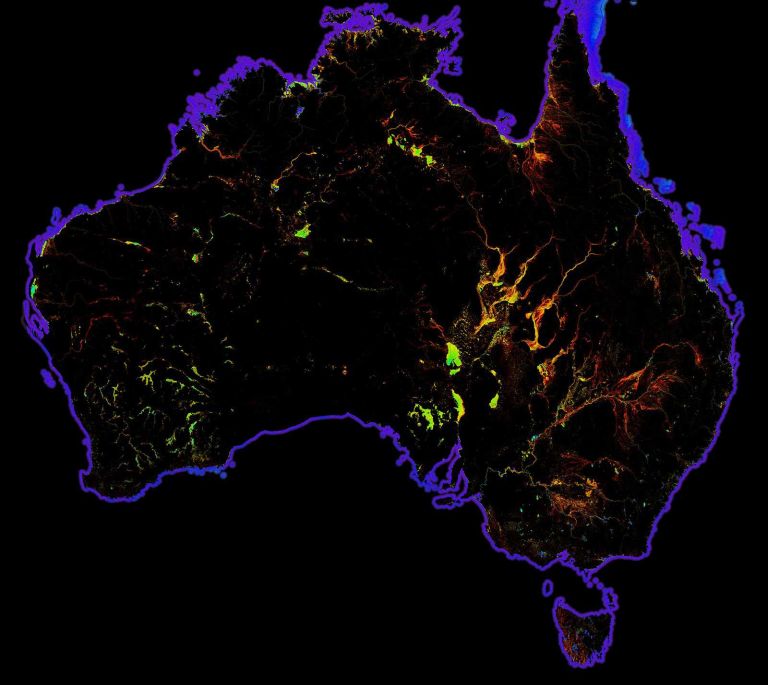
Continent-scale map of surface water that classifies each pixel from Landsat satellite imagery as wet, dry or invalid.

Case study Developing accessible flood models to reduce flood vulnerability
Developing accessible flood models to reduce flood vulnerability
Transforming detailed flood impact models into scalable models for broader use in the community.

This research represents an important step in the development of curves that can be applied consistently across different flood catchments by individuals or organisations that may not have a complete picture of the building stock potentially exposed to flood waters.
Director, Vulnerability, Spatial Division, Geoscience Australia