DEA data and products
Last updated:18 June 2024
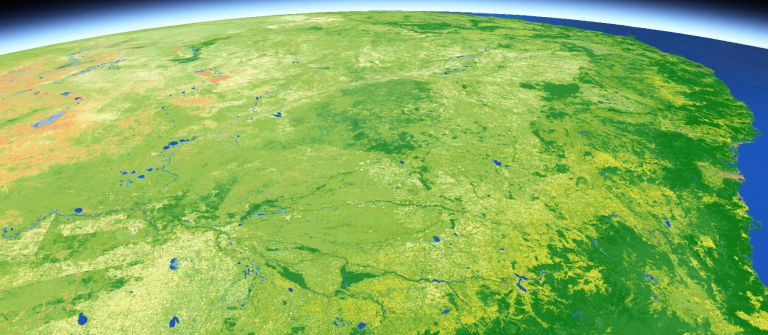
DEA Land Cover
Satellite data insights into land, vegetation, and waterbodies changes down to every square 30 metres across Australia since 1988.
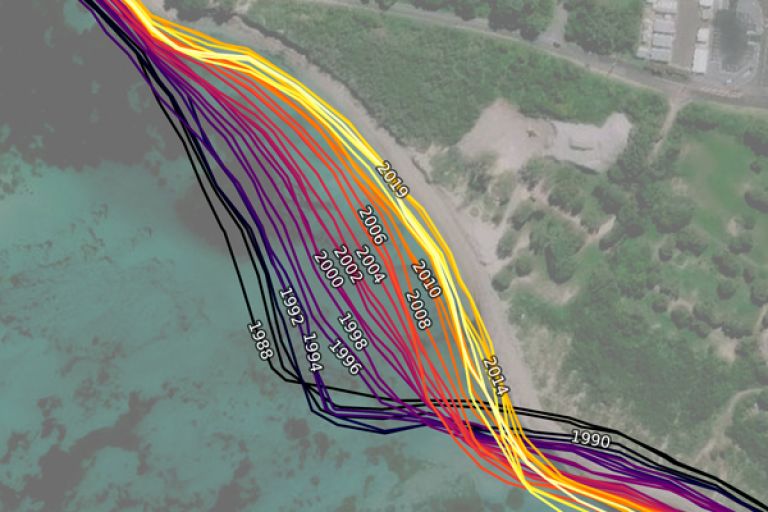
DEA Coastlines
Satellite data combined with tidal modelling to map typical annual locations of mean sea level coastlines since 1988.
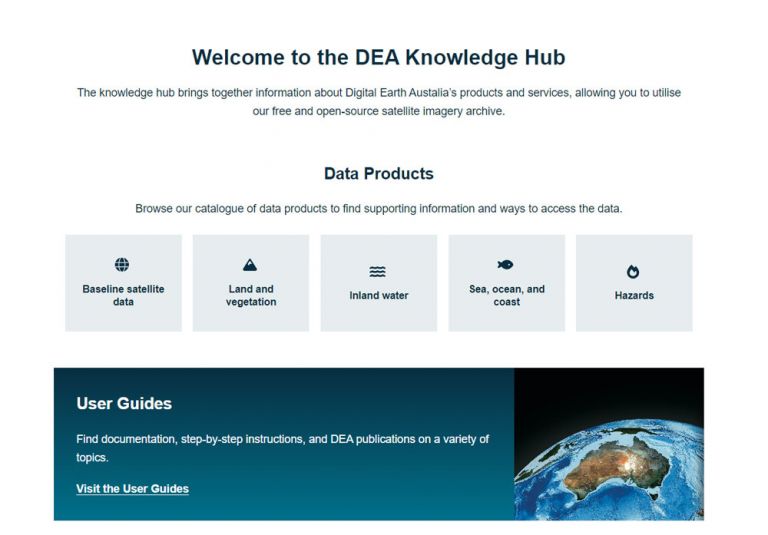
DEA Knowledge Hub
The knowledge hub brings together information about DEA’s products and services, allowing you to utilise our free and open-source satellite imagery archive.
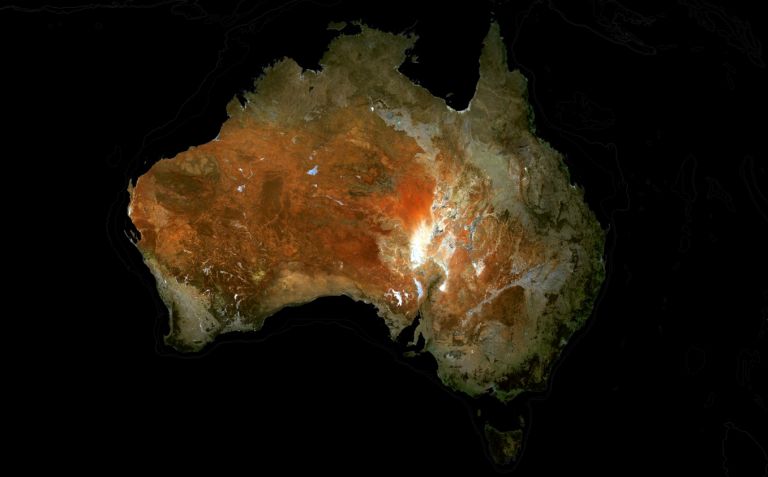
DEA GeoMAD
A geometric ‘average’ based on culminative statistical data from each year.
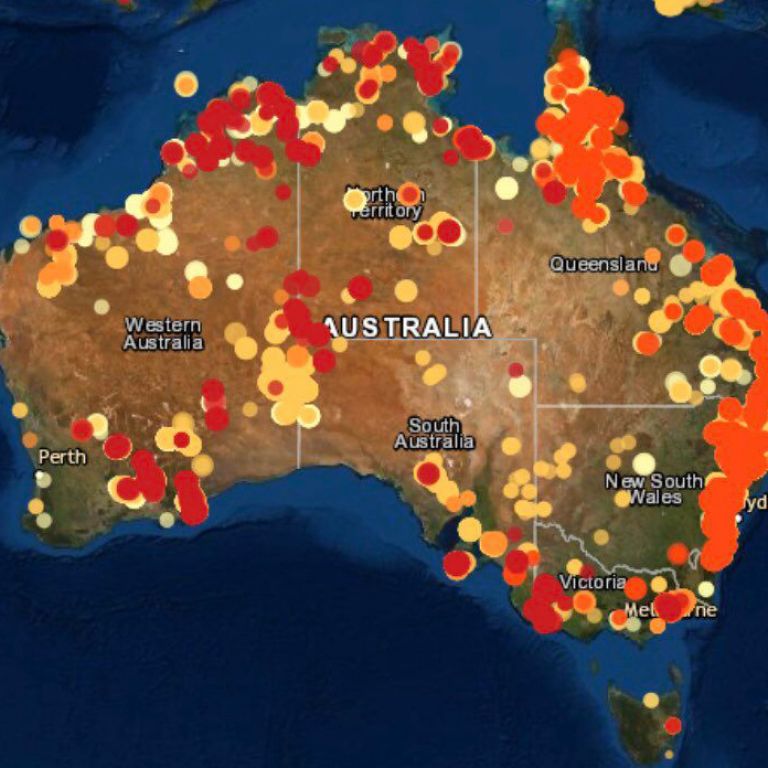
DEA Hotspots
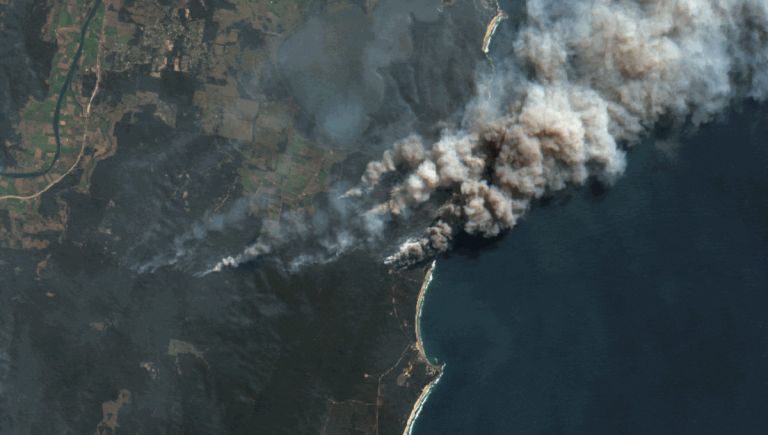
National bushfire monitoring system to detect areas of high infrared radiation to identify potential fire locations.
DEA Surface Reflectance
Baseline data from Landsat and Sentinel-2 satellites, validated, calibrated and adjusted for Australian conditions.
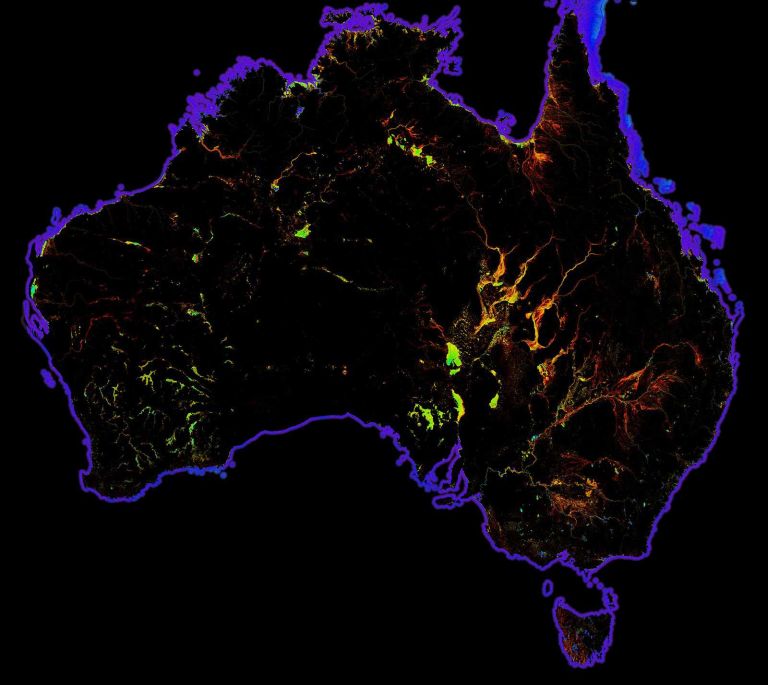
DEA Water Observations
Continent-scale map of surface water that classifies each pixel from Landsat satellite imagery as wet, dry or invalid.
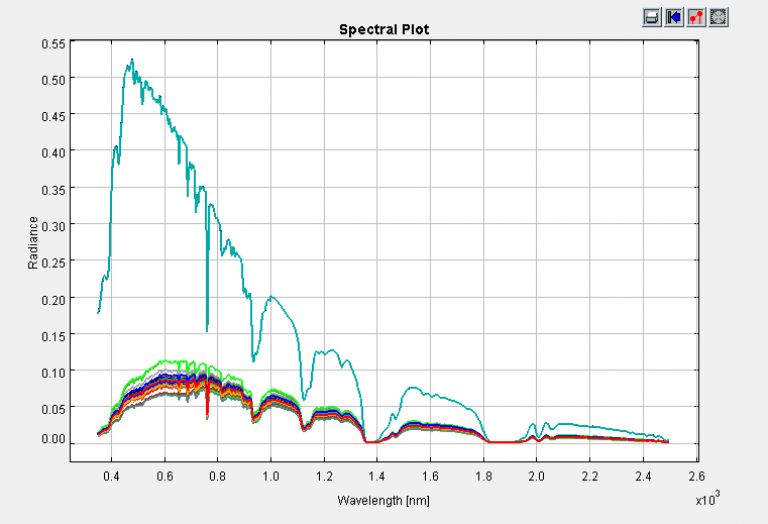
National Spectral Database
Best-practice spectral data collected by Australian remote sensing scientists from multiple locations and institutions.
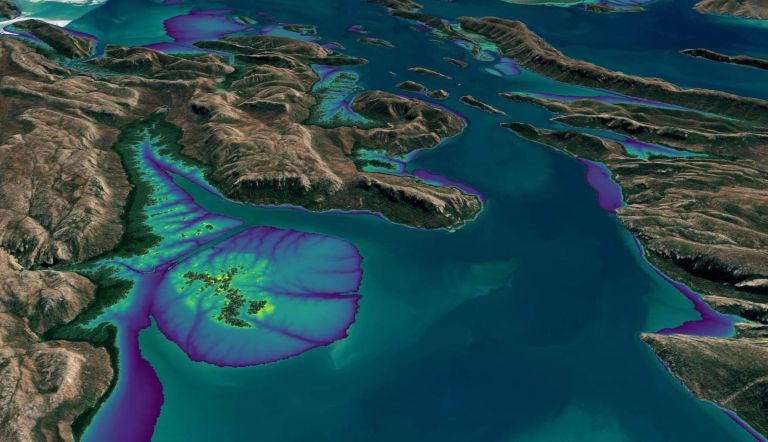
DEA Intertidal
The new Digital Earth Australia Intertidal product suite captures Australia’s dynamic coastal regions in unprecedented detail.
DEA Intertidal Extents
Lowest and highest observed tides for a chosen geographic cell, revealing the satellite-observed tidal range.
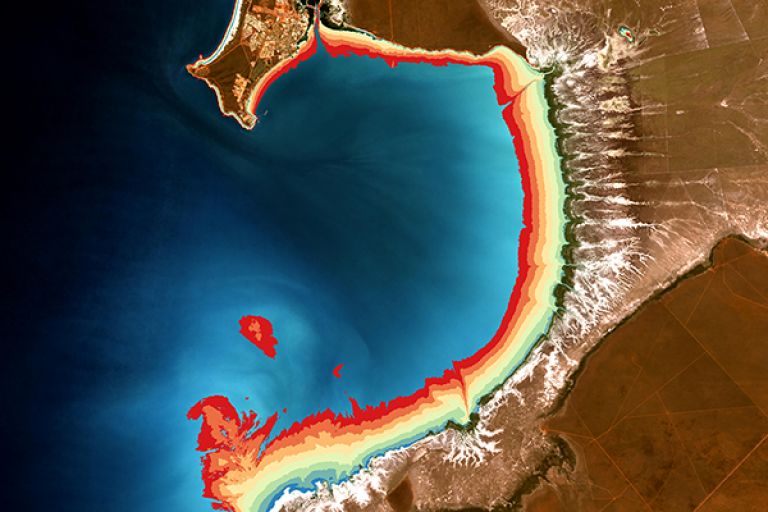
DEA High and Low Tide Imagery
Cloud-free mosaics of the Australian coast, calculating geometric medians of highest and lowest 20% of tides.
DEA Waterbodies
View the mapping of more than 300,000 waterbodies across Australia with wet surface area present more than 10% of the time.
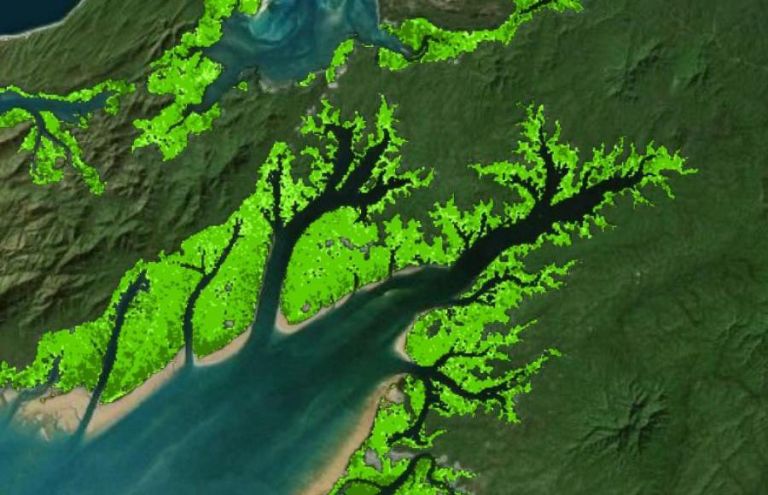
DEA Mangrove Canopy Cover
Annual maps breaking canopy into three classes according to greenness of satellite image pixels at 25 m resolution.
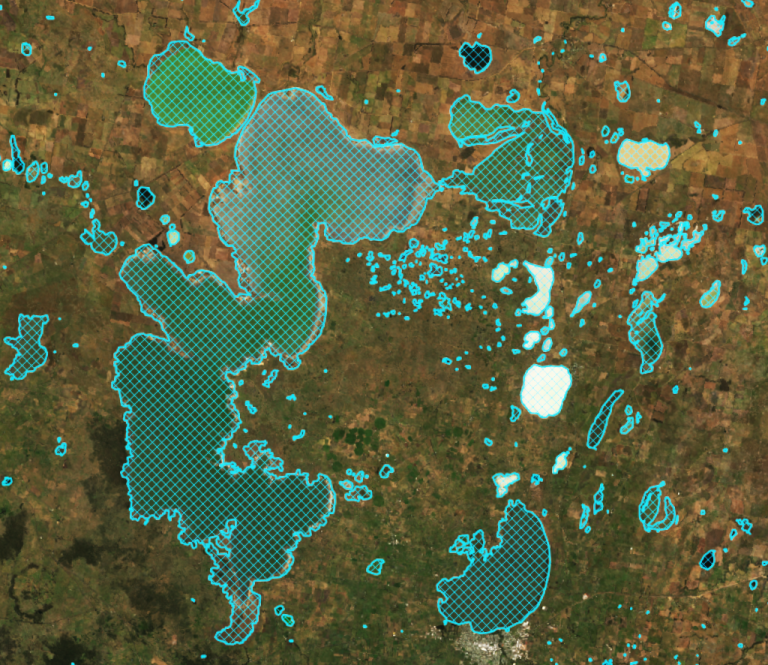
DEA Wetlands Insight Tool (Qld)
Tracking of changes in 270,000 lacustrine and palustrine (lake and swamp) wetlands in Queensland since 1987.
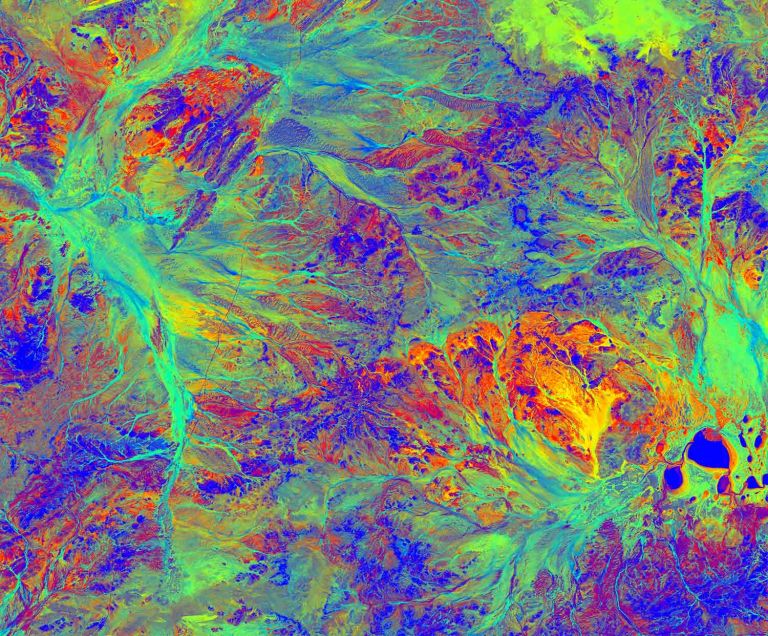
DEA Fractional Cover
Australian landscape mapped in three parts, showing changes to green, brown and bare ground since 1987.
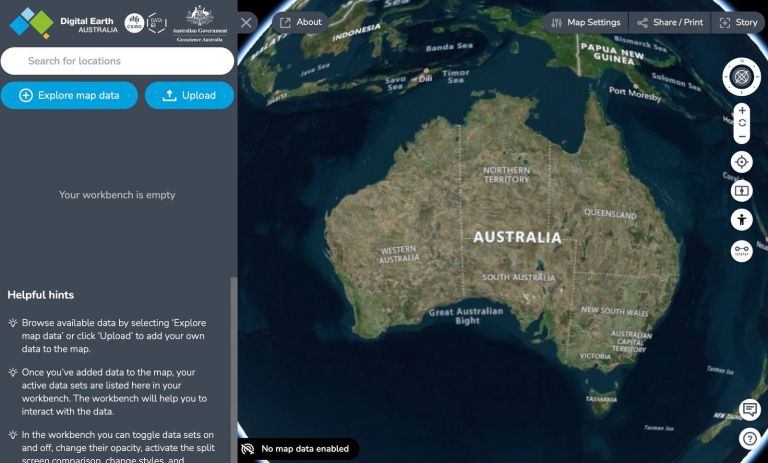
DEA Maps
Digital Earth Australia (DEA) Maps is a website for map-based access to DEA data products, developed by Data61 CSIRO for Geoscience Australia.
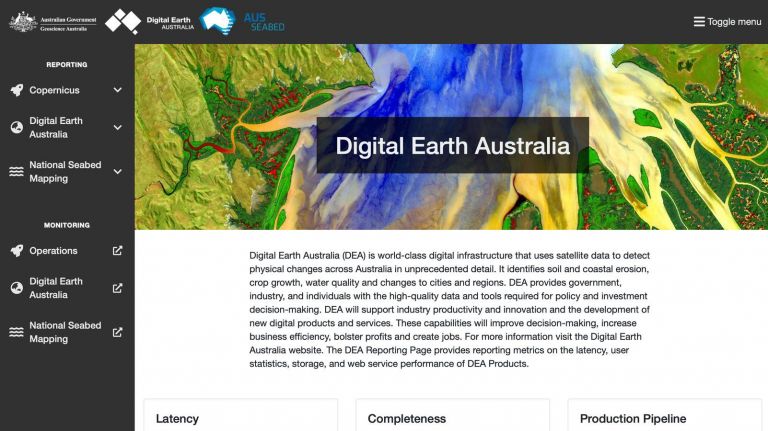
DEA Reporting
See real-time reporting metrics on the latency, user statistics, storage, and web service performance of DEA data products.
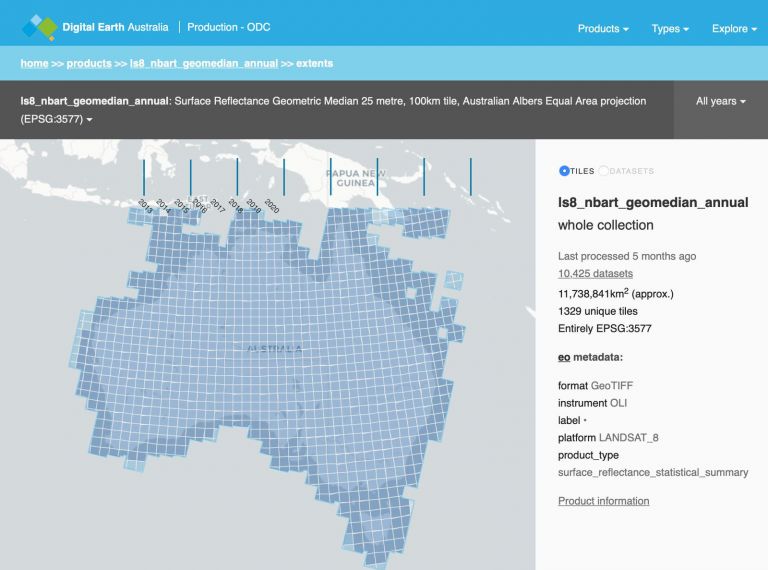
DEA Explorer (AWS)
Find the data you’re looking for according to region. This explorer reflects data available through Amazon Web Services (AWS).
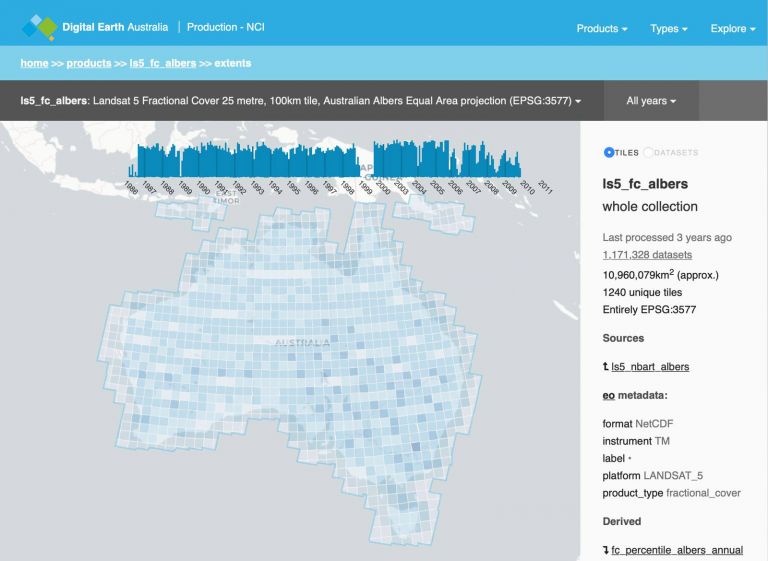
DEA Explorer (NCI)
Find the data you’re looking for according to region. This explorer reflects data available through the National Computational Infrastructure (NCI).

DEA Open Web Services (OWS)
DEA Open Web Services provide access to visualisations and data exports via WMS, WMTS and WCS.
DEA via Amazon Web Services
We store a range of our satellite data products on Amazon Web Service’s S3 buckets.
DEA Bushfire Burnt Area NRT Services
Use DEA’s freely available data and products to examine, investigate, delineate and track burnt areas across Australia.