Self-service data platforms DEA Bushfire Burnt Area NRT Services
Page last updated:30 September 2024
See bushfires in the landscape. Spot areas of high temperature
Digital Earth Australia (DEA) offers analysis ready satellite imagery as a self-service platform that allow users to visualise the Australian landscape and identify recent bushfire events, delineate burnt areas, and then provide insights to other data sources about how bushfire could threaten communities and property.
DEA’s freely available near-real-time imagery, combined with DEA Hotspots, offers a solution for examining, investigating, defining, and tracking burnt areas across Australia. Utilising scientific workflows set out by DEA Notebooks in the DEA Sandbox, and DEA Maps users can seamlessly integrate other DEA derivative products to gain comprehensive insights into fire-effected regions.
Sentinel-2A - 2019-09-09 - Yamba, NSW - DEA Surface Reflectance Normalised Burn Ratio - NIR, SWIR - False colour and true colour image of fire burning south of Yamba.
Sign up to DEA Sandbox and jump in to investigate using EO data
DEA Sandbox is a learning and analysis environment with access to Earth Observation datasets with DEA Notebooks that allow you to explore and investigate local-scale applications.
Investigate Burnt Areas with DEA Notebooks and NRT Satellite Imagery
Explore burnt areas in detail using near-real-time (NRT) satellite imagery in the DEA Sandbox. This workflow leverages DEA’s freely available near-real-time imagery to investigate recent fire events.
The DEA Notebook outlines a workflow to select the most suitable near-real-time and baseline imagery for comparison from the Landsat 8 & 9 and Sentinel-2A & Sentinel-2B sensors. Value thresholding is applied to detect unverified burnt areas, before creating an exportable polygon vector file. The workflow examines an area in Tambaroora, NSW, directly after a bushfire in March 2023. You can update the location and time to investigate your own area of interest.
DEA Burnt Area NRT interactive map
Visit DEA Maps to get the full interactive map with DEA Burnt Area NRT and other DEA products.
How can observing burnt area help?
- Enables users to identify and assess bushfire events and impacts in remote areas
- Provide insights to emergency managers and helps to inform preparedness and recovery activities
- Use with DEA Hotspots to locate potential bushfires that are currently or recently active and then investigate the size, location and extent of an event with near real-time satellite imagery
- Compare before and after bushfire burnt area data in any location Australia-wide
Related resources
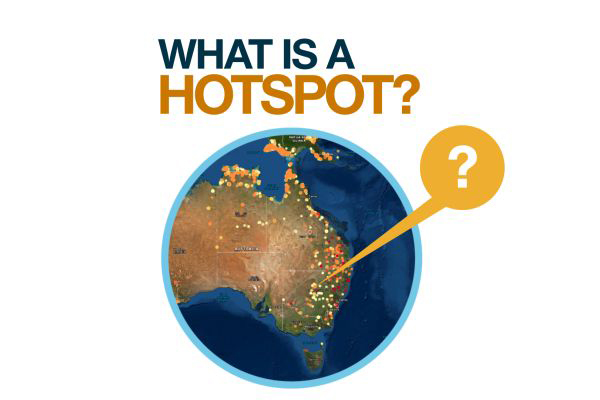
What is a Hotspot?
Hotspots indicate areas producing high levels of infrared radiation detected through analysis of satellite imagery.
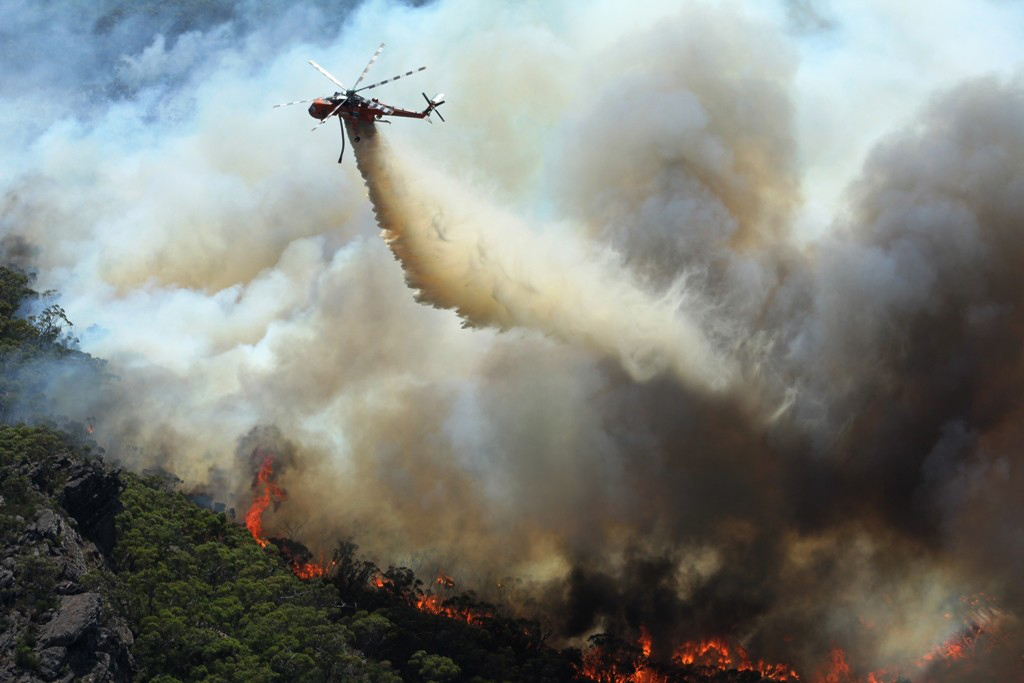
Finding water to fight fire
Satellite data maps of Australian waterbodies are fuelling a more confident flightpath for Victoria’s CFA.
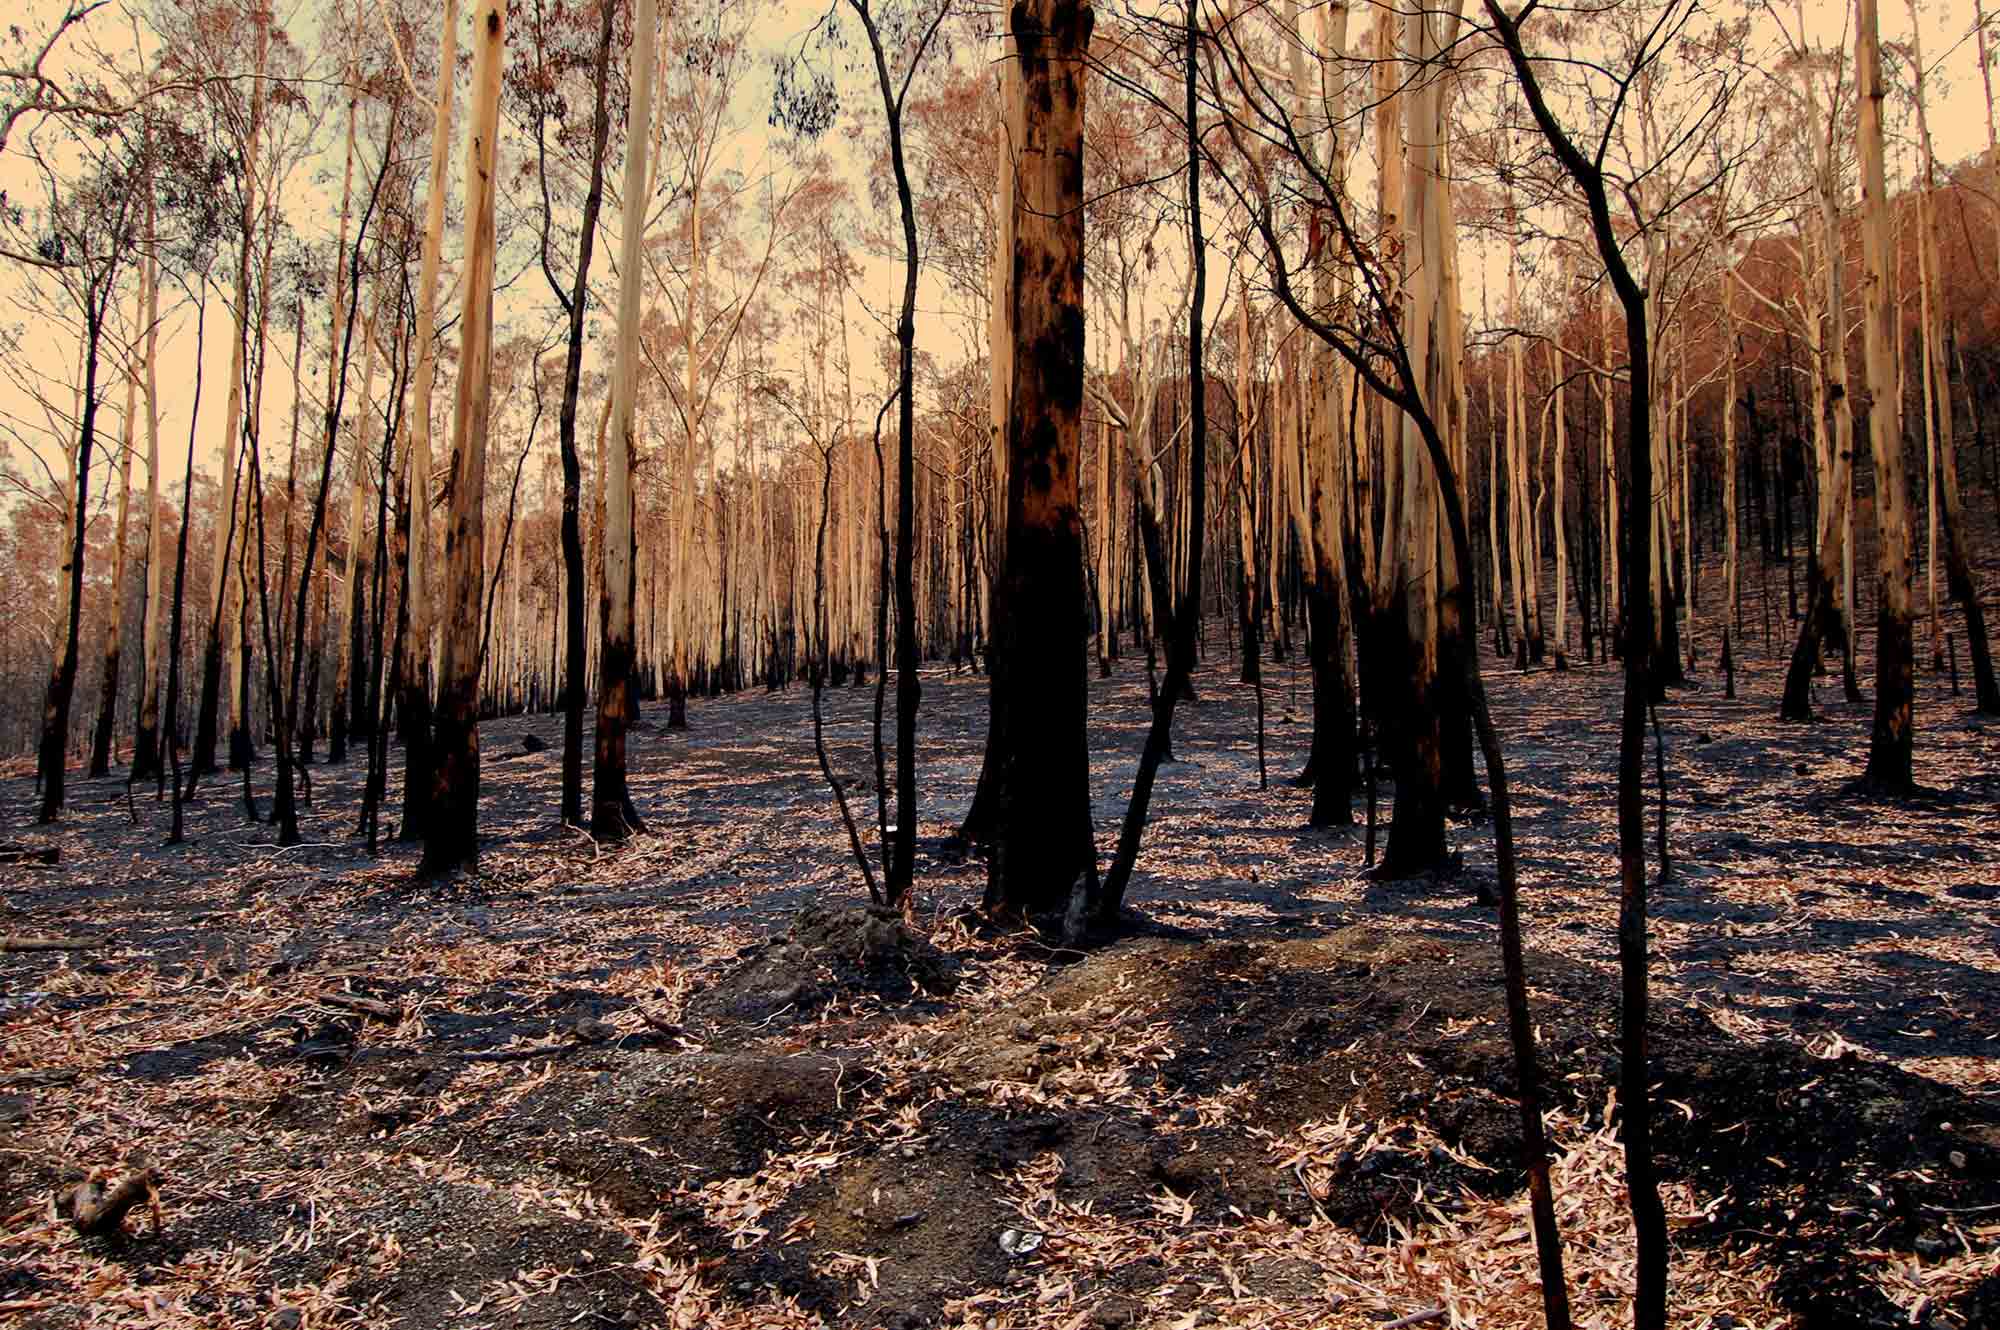
Landsat at work during Black Summer
The partnership between Geoscience Australia and the USGS Landsat program meant satellite imagery was on-hand to assist responders during Australia’s 2019–20 bushfires.