Derived data product DEA Coastlines
Page last updated:29 April 2025
See decades of coastal change
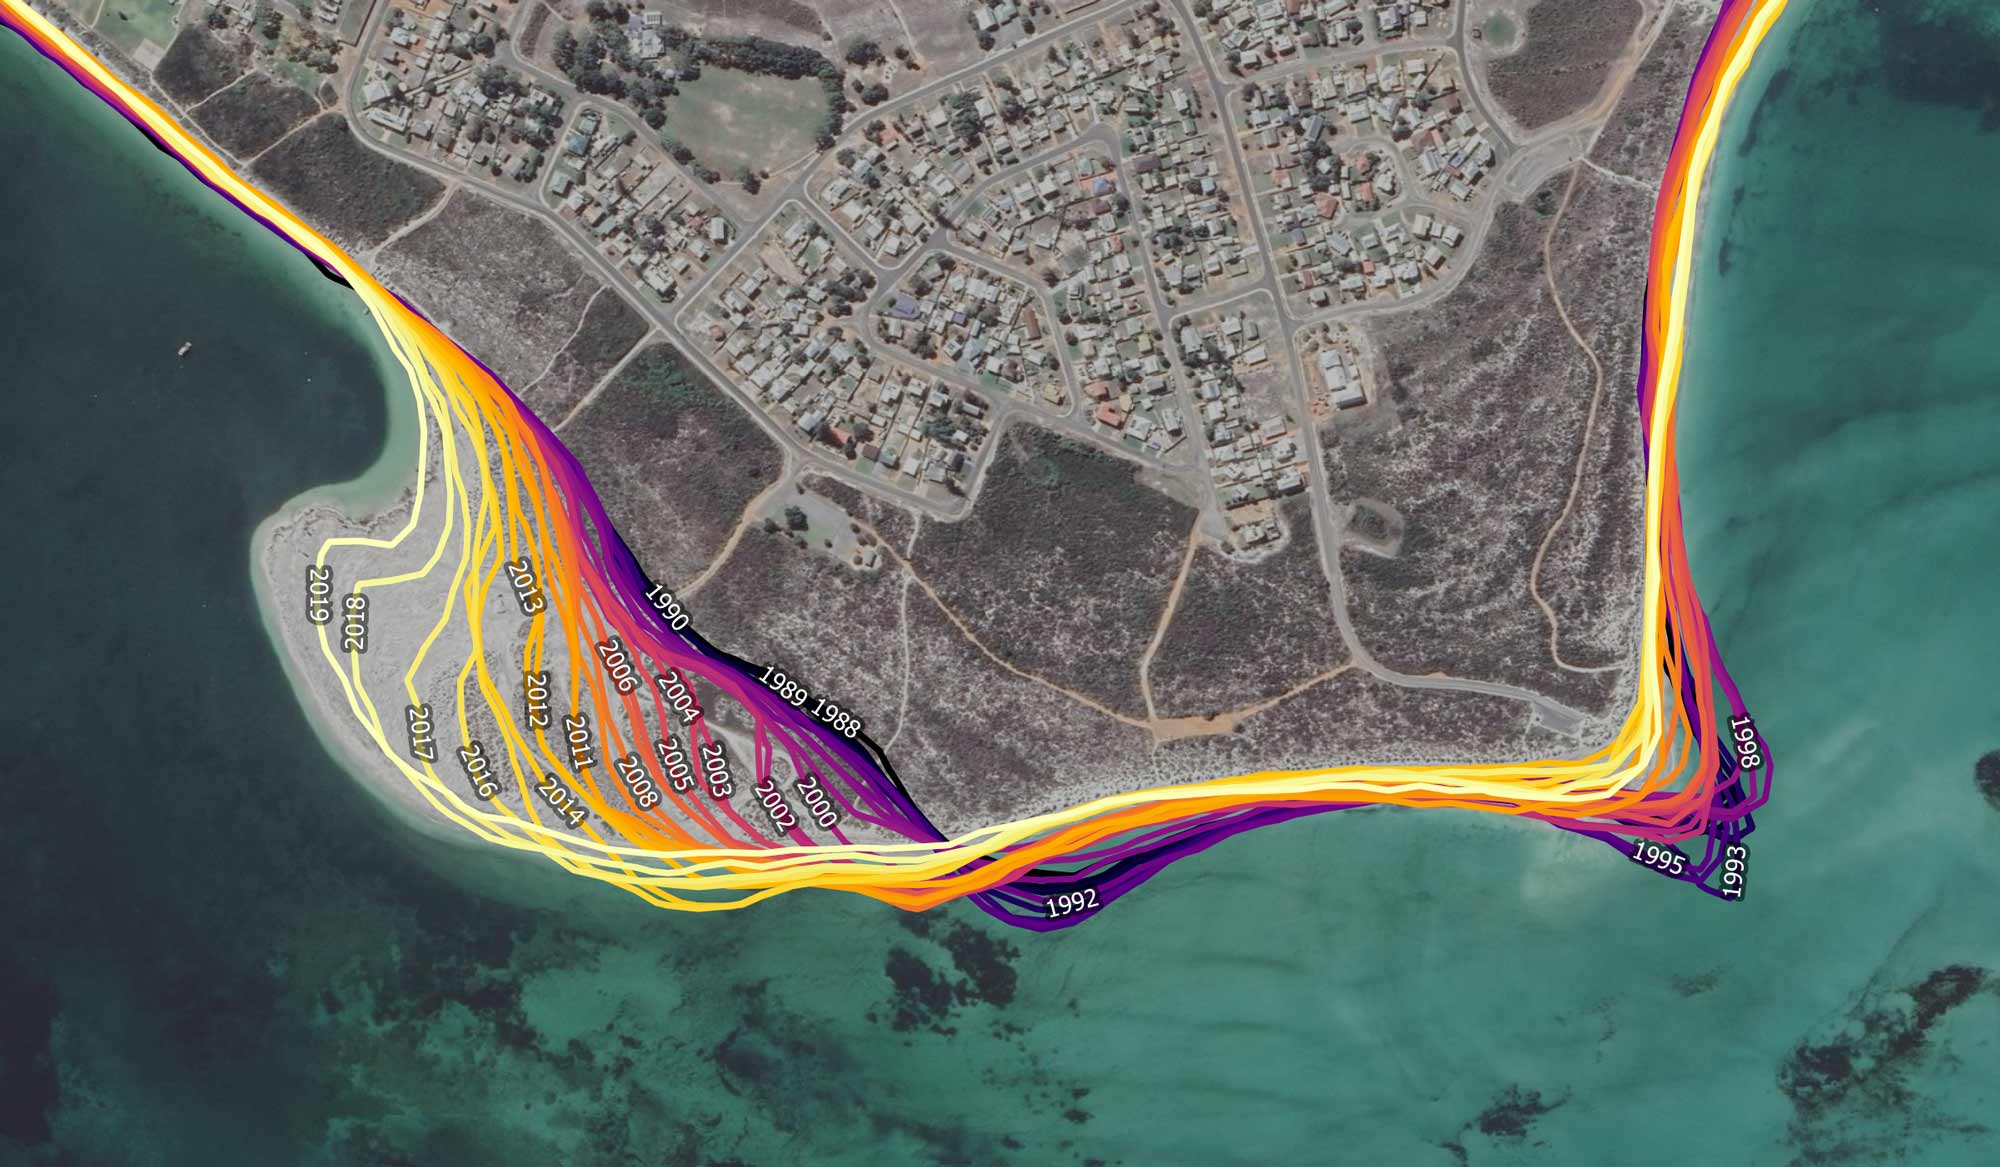
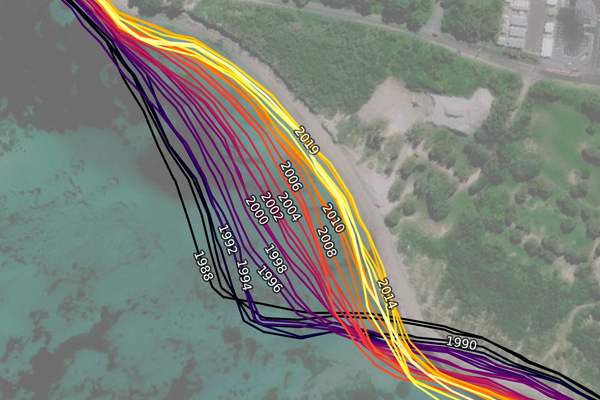
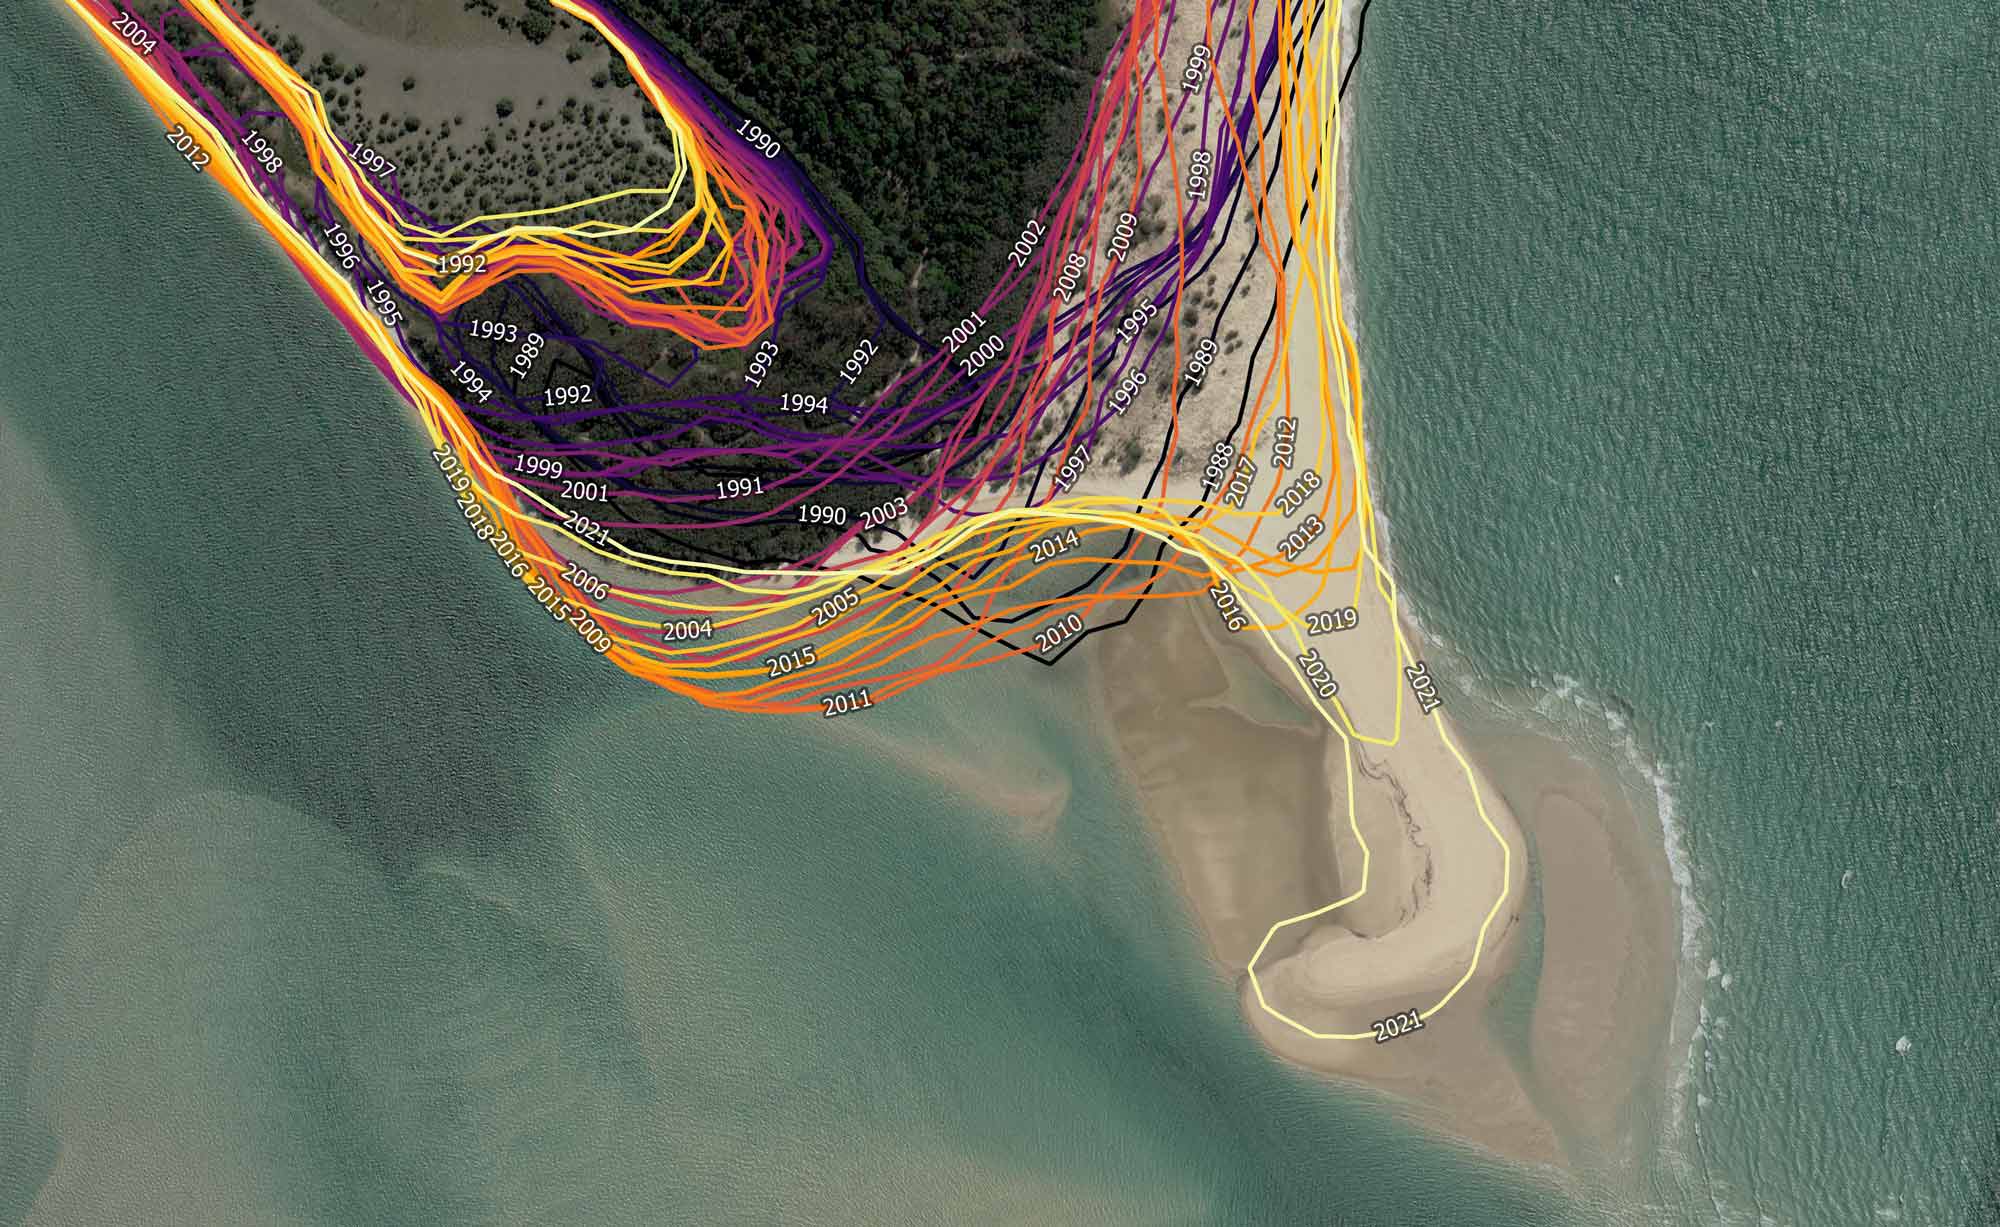
DEA Coastlines combines satellite data with tidal modelling to map the changing location of Australia's coastline since 1988. Resulting annual shorelines and detailed rates of change show how beaches, sandspits, river mouths, and tidal flats have grown and eroded over time.
The product draws on nearly 58,000 independent measurements to ensure accuracy, supported by local councils, state governments, citizen scientists and academia.
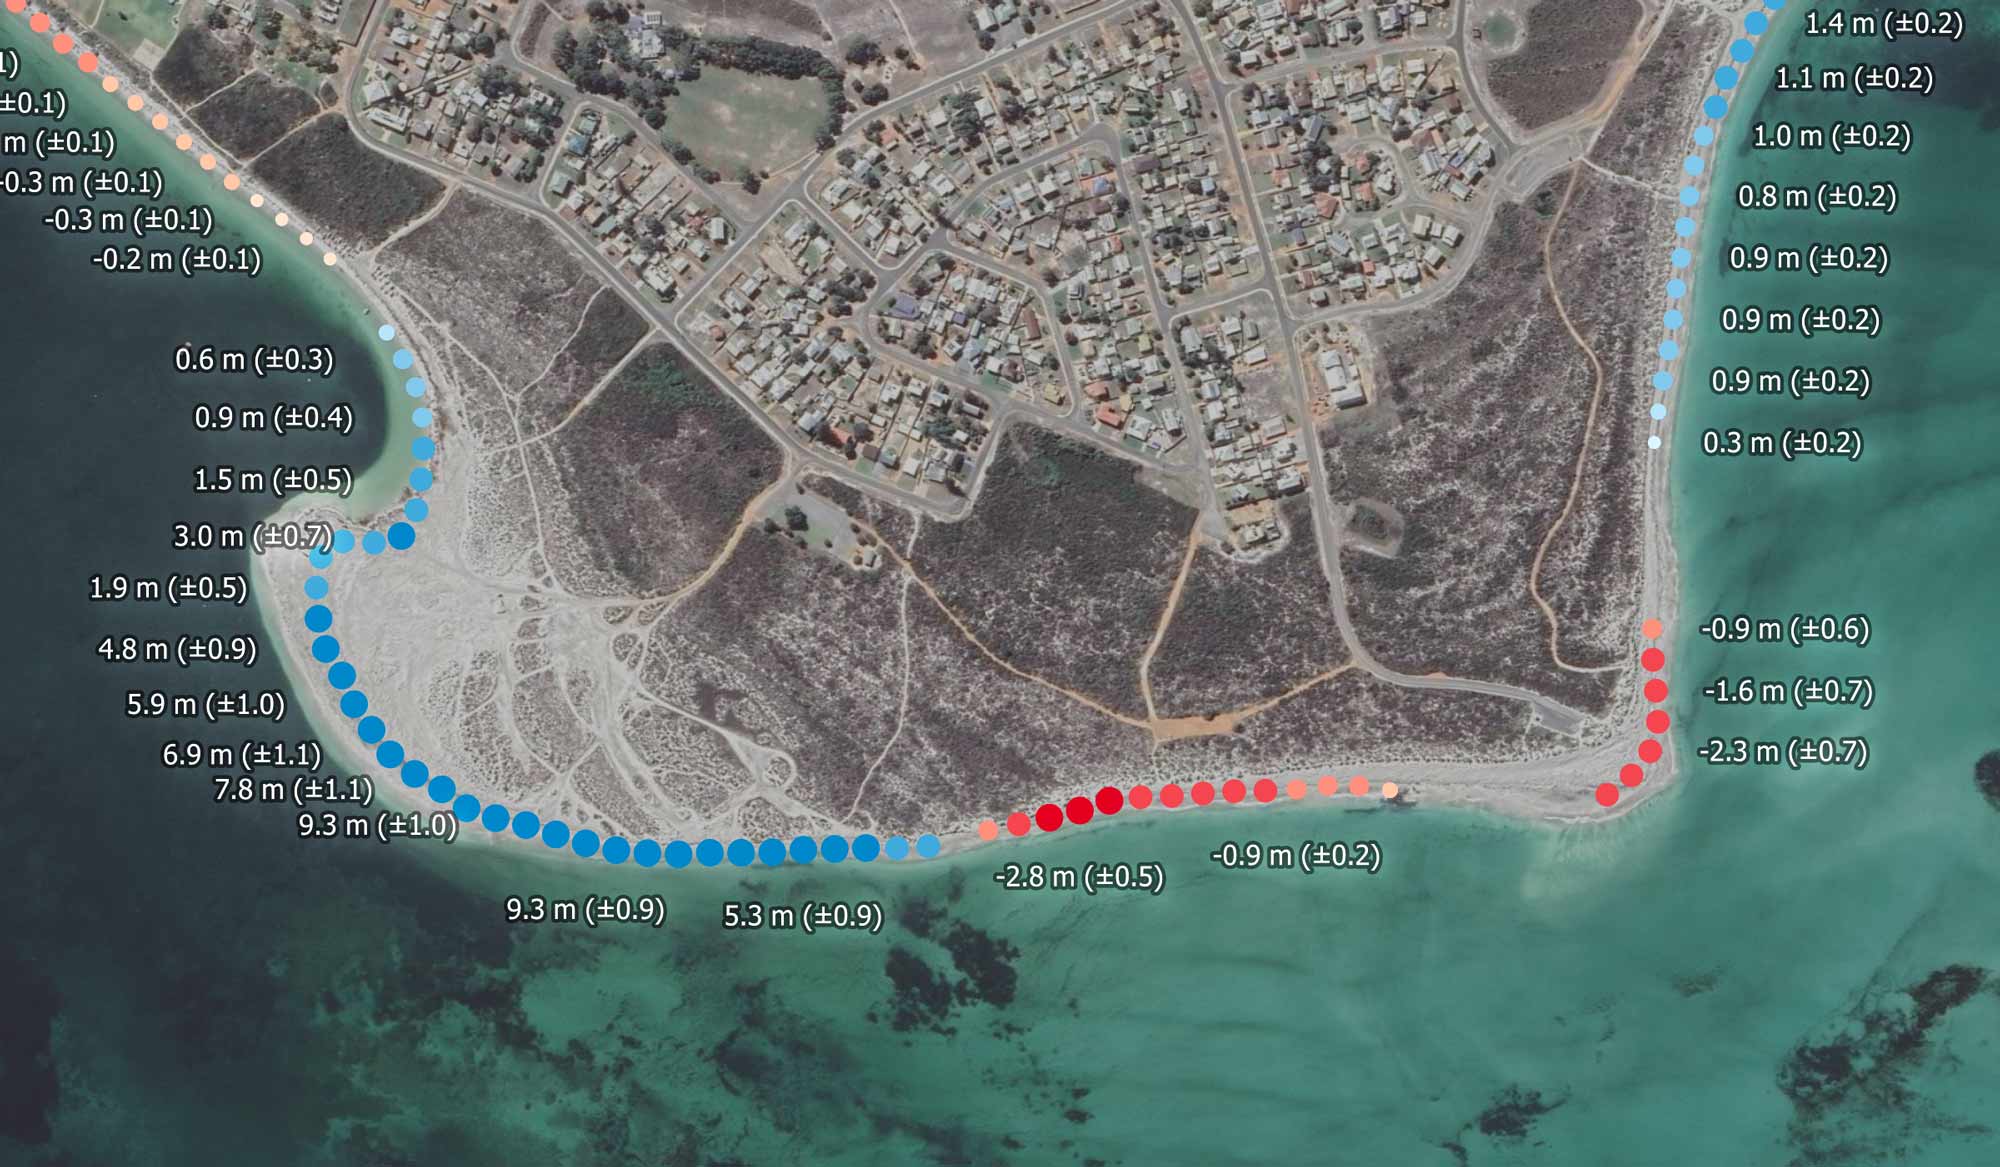
DEA Coastlines data accurately maps rates of coastal change and hotspots of erosion and growth at every 30 metres along the entire Australian coastline.
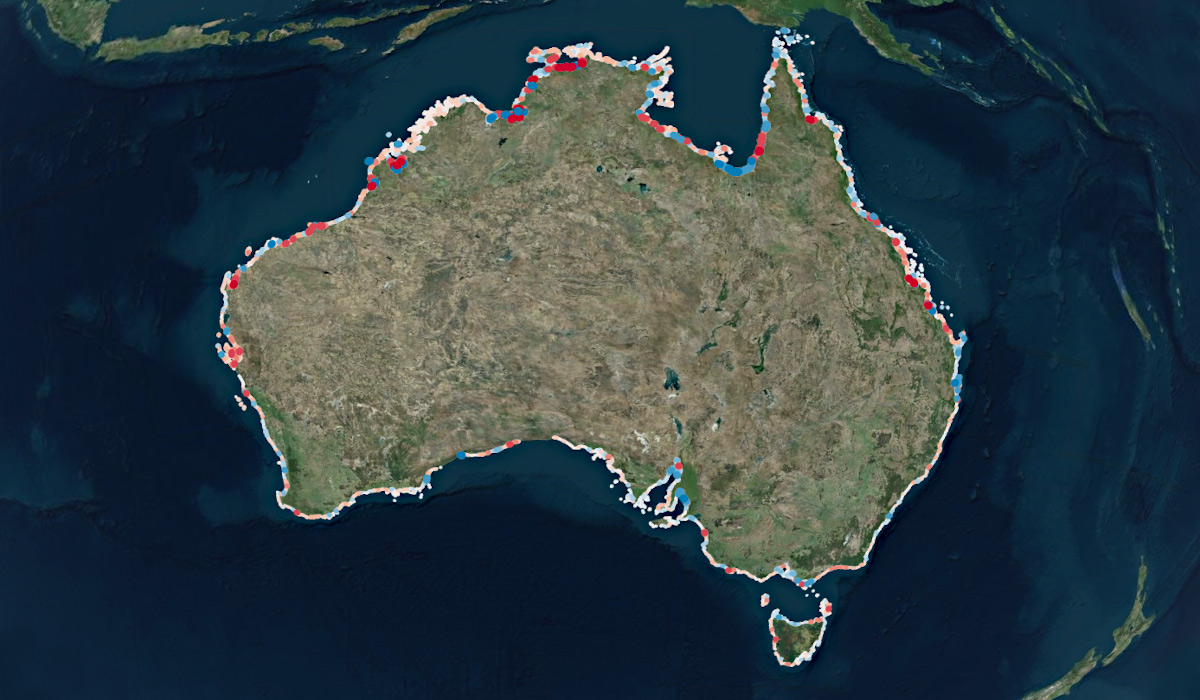
DEA Coastlines interactive map
Visit DEA Maps to get the full interactive map with DEA Coastlines and other DEA products.
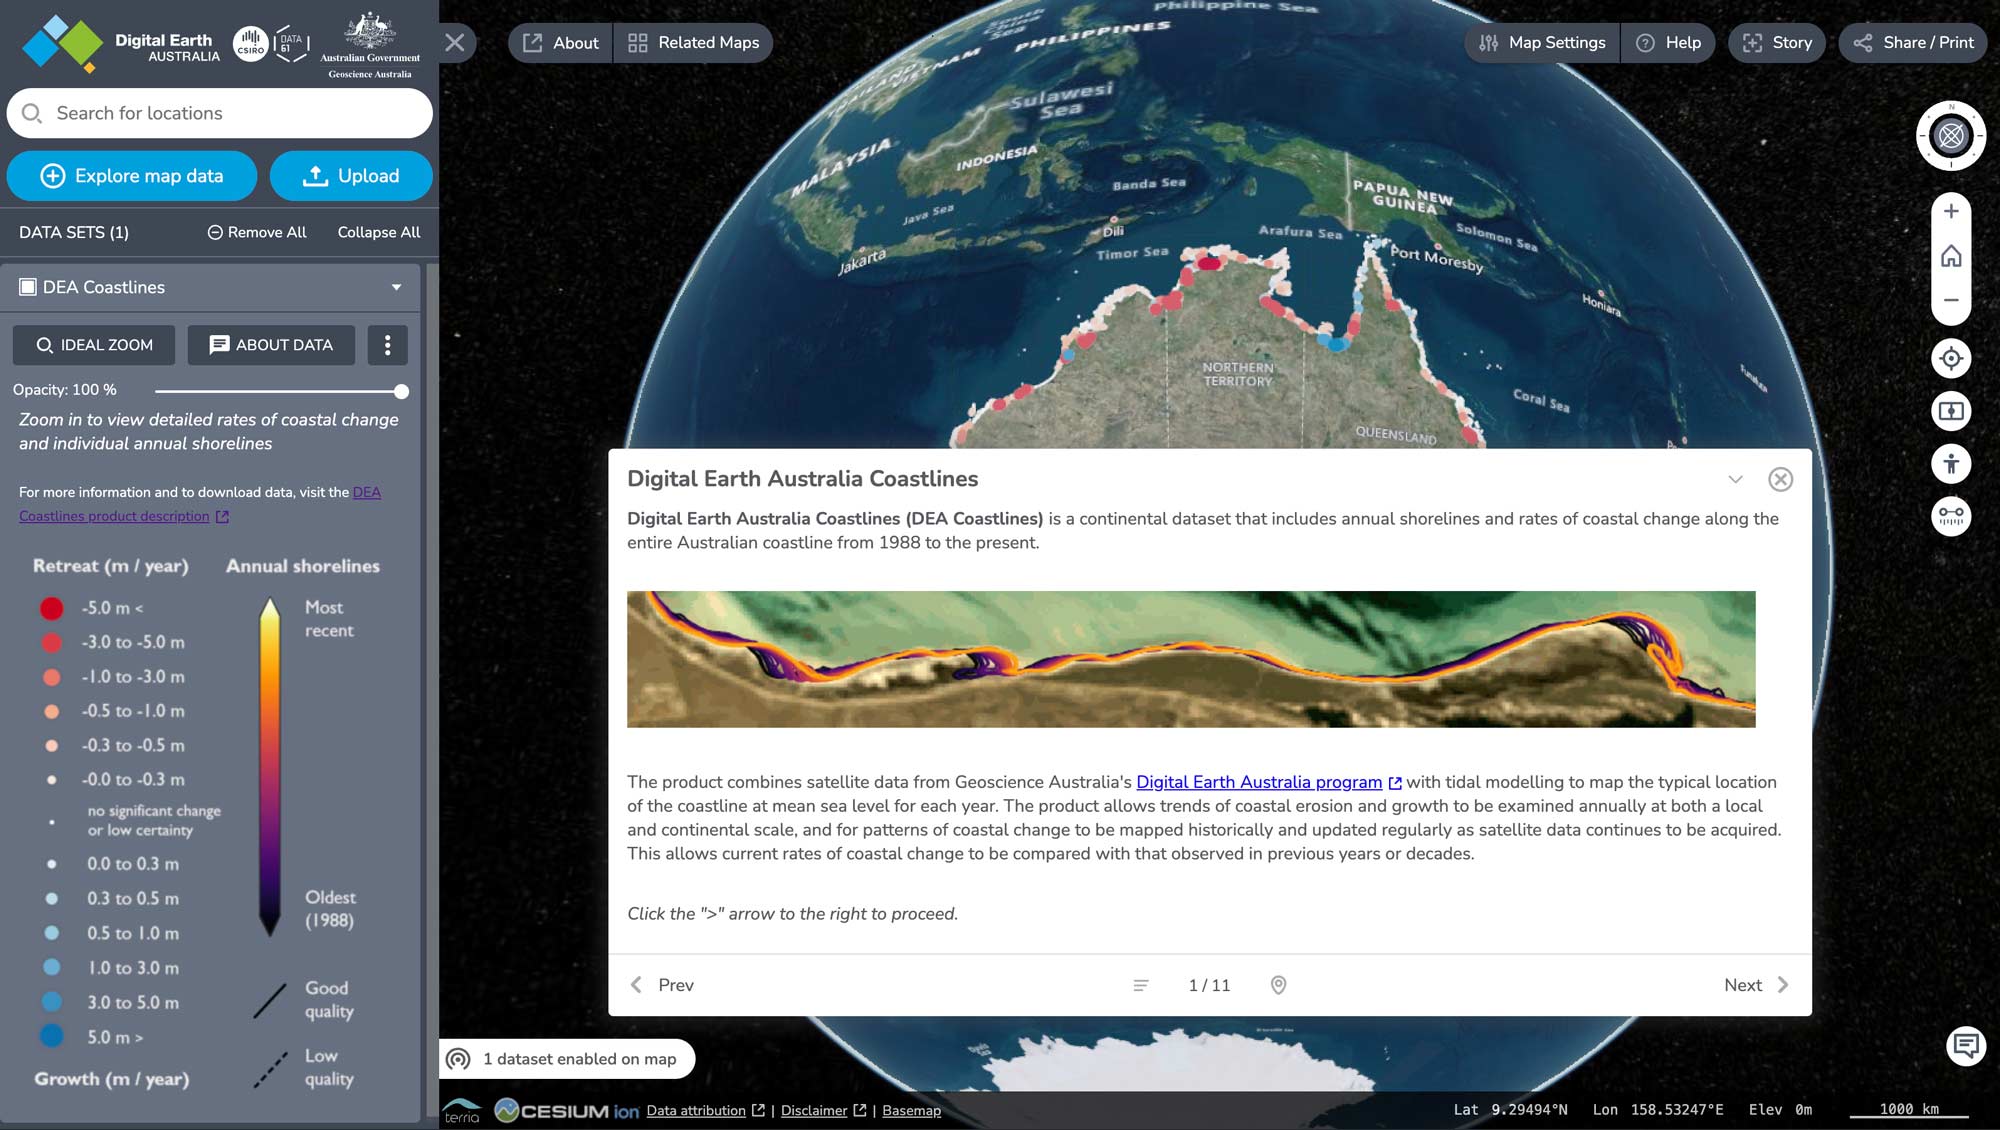
Screenshot of the DEA Coastlines interactive map.
Why track changing coastlines?
- Provide new insights to scientists, coastal managers, local communities and policymakers
- Model how coastlines respond to drivers of change, including extreme weather events, sea level rise and urban development
- Prioritise and evaluate impacts of local and regional coastal management decisions
- Support research into how and why coastlines have changed over time

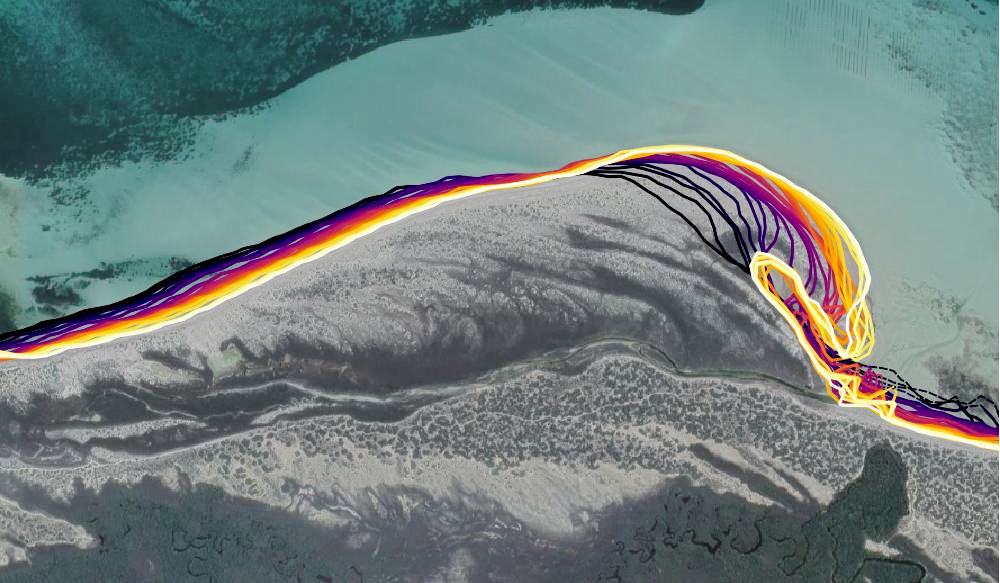
Imagery for impact The growing sands of Twilight Cove
Get a snapshot of the stories revealed by DEA Coastlines, including how one remote and spectacular Western Australian beach has grown by more than 500 m since 1988.
Related resources
DEA Coastlines FAQs
Frequently asked questions about Digital Earth Australia (DEA) Coastlines.

Seminar: Time and Tide
Meet Digital Earth Australia’s Dr Robbi Bishop-Taylor in this seminar on mapping Australia's coastal zone through time and space with DEA data.
Journal Article
Mapping Australia's dynamic coastline at mean sea level using three decades of Landsat imagery.