Creating annual Earth observation images of Australia with DEA GeoMAD
Page last updated:21 October 2024
The Digital Earth Australia Geometric Median and Median Absolute Deviation (DEA GeoMAD) products deliver insight into the median annual conditions of Australia’s landscape, plus insight into how much it has varied.
The Geometric Median (geomedian) part of the product is a pixel composite mosaic of a time series of Earth observations. Essentially the value of a pixel in a geomedian image is the statistical median of all observations for that pixel over a period of time. In the case of DEA GeoMAD , that period is a calendar year. The Median Absolute Deviation (MAD) part of the product provides measures of how much a pixel has varied through the same time period, and so provides insight into change in the landscape.
“DEA GeoMAD provides a largely cloud free composite of a calendar year,” said James Miller, a Technical Lead from Geoscience Australia’s Digital Earth Australia who helped develop the latest products.
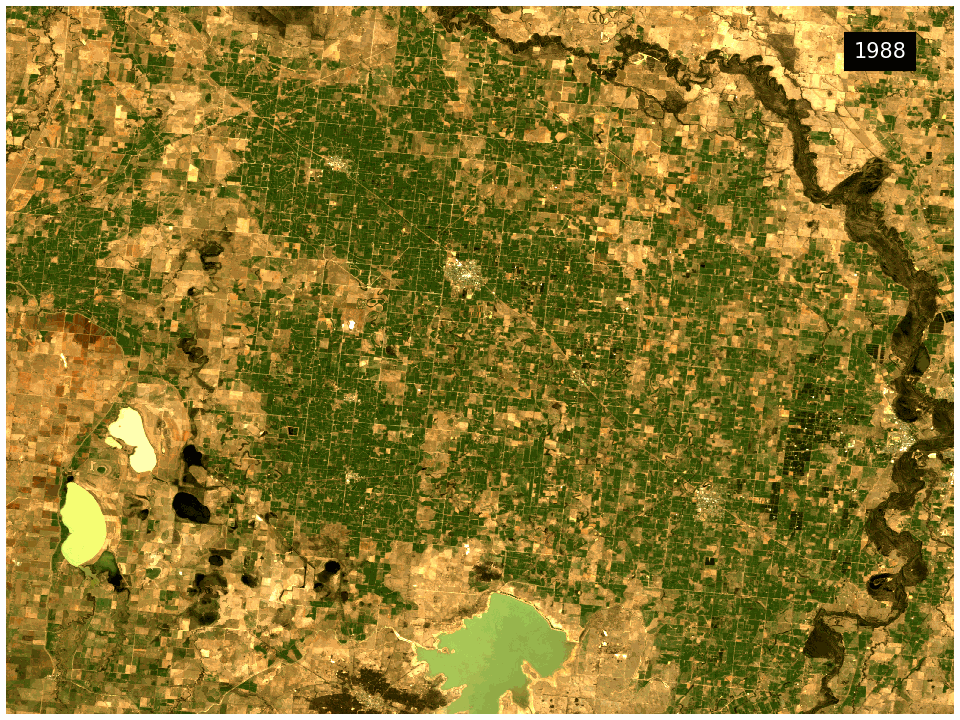
An animation of pastoral land variation near Shepparton, Victoria, showing the geometric median over 35 years, including periods of severe drought in the early 2000s and later 2010s.
The DEA GeoMAD products serve an important role underpinning our annual datasets and products. These datasets are useful for observing changes in our landscape and deliver vital information for agriculture, urban expansion and measuring bushfire burnt areas.
“We have compiled data collected from all the satellite flyovers from the year and compressed them into a single ‘average’ for each year. That gives us the annualised snapshot for the whole year for that pixel,” said James.
DEA Earth Observation Scientist Margaret Harrison said the release of DEA GeoMAD was a significant step in the development of DEA derived products that rely on the annualised geomedian.
“DEA GeoMAD covers more than 30 years of satellite data, distilling it into composite representative images for each year,” said Margaret.
“These snapshots are useful for DEA products and datasets that capture a year of variability in a single impression, which become foundational to annual products such as DEA Land Cover.”
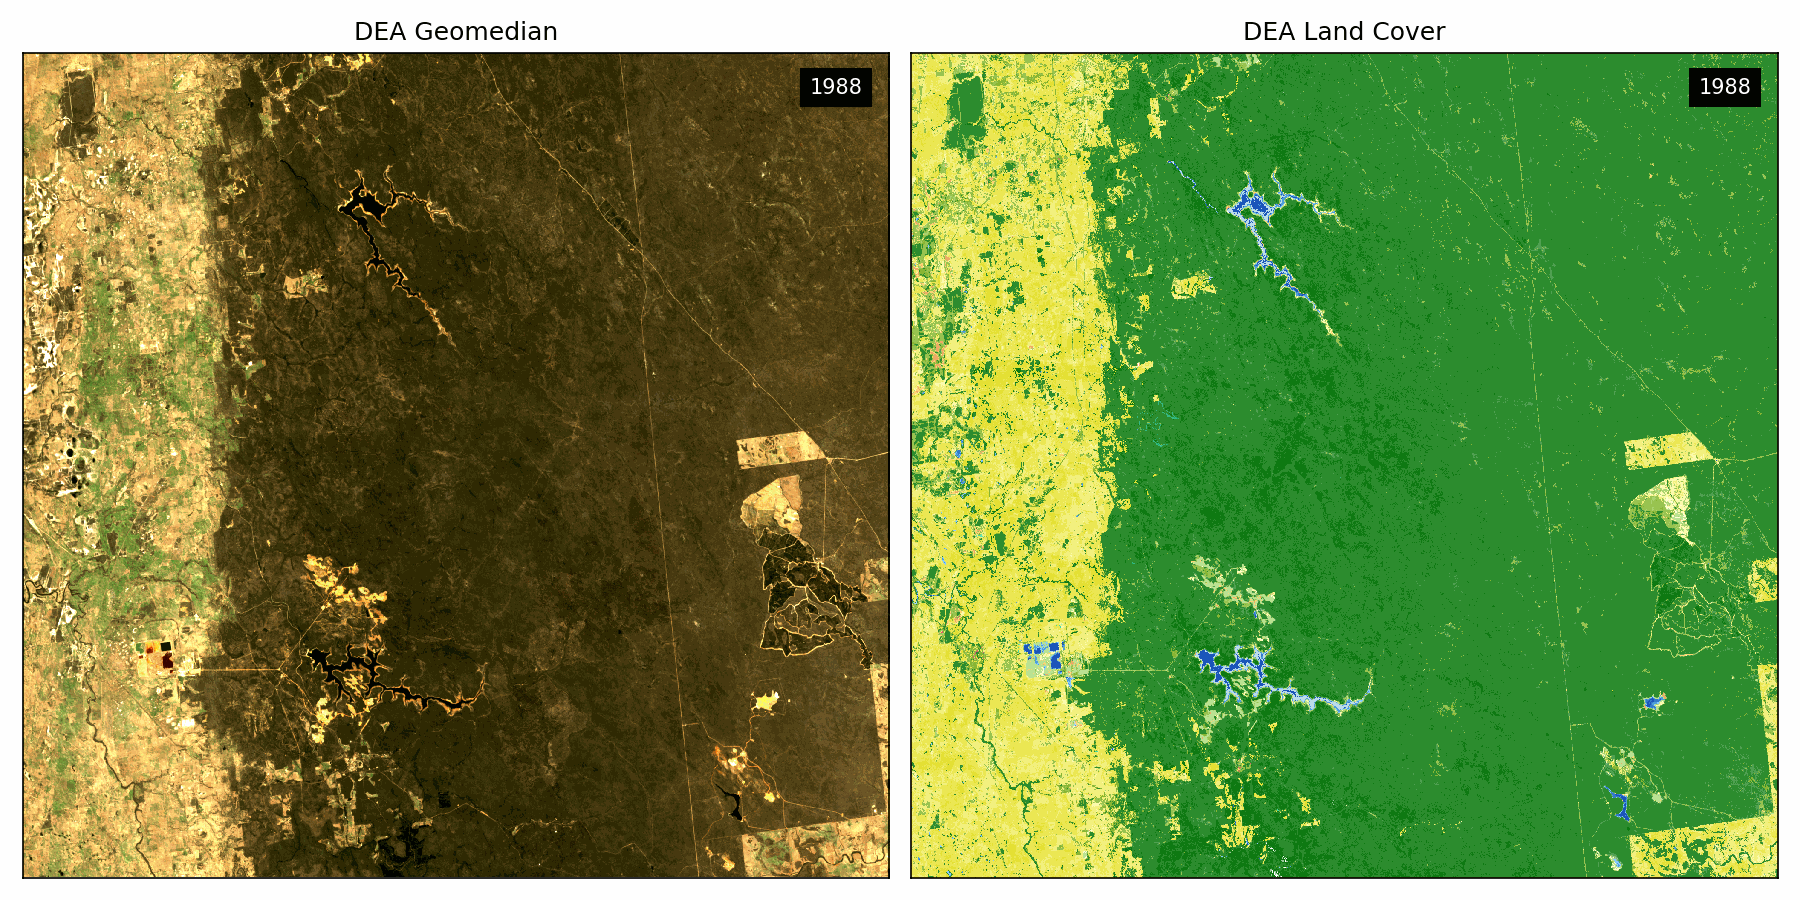
The geomedian data showing a bauxite mine’s spread in Western Australia from 1988 to 2020 (left) informs DEA Land Cover data, which measures vegetation returning to the landscape in the wake of rehabilitation (right).
DEA GeoMAD provides foundational data for change detection and classification, general variance and change. It can also be used in machine learning for change detection as well as environmental monitoring.
Some key changes in DEA GeoMAD 4.0:
- A single combined product for Landsat 8 and Landsat 9 is provided. It achieves better performance than the standalone Landsat 8 product due to using a larger number of available observations. A standalone Landsat 8 product will no longer be provided from calendar year 2022 onwards.
- An enhancement to cloud masking has reduced cloud and shadow noise. Cloud masks have been cleaned using a 3-pixel morphological opening on clouds and a 6-pixel dilation on cloud and shadow.
- The south-west origin point of the DEA Summary Product Grid has been shifted 18 tiles west and 15 tiles south. For more information see this recent DEA Tech Alert
- Band measurement names were updated for consistency with DEA’s ARD products by adding the ‘nbart’ prefix.