News Landsat at work during Black Summer
The partnership between Geoscience Australia and the USGS Landsat program meant satellite imagery was on-hand to assist responders during Australia’s 2019–20 bushfires.
Page last updated:18 June 2024
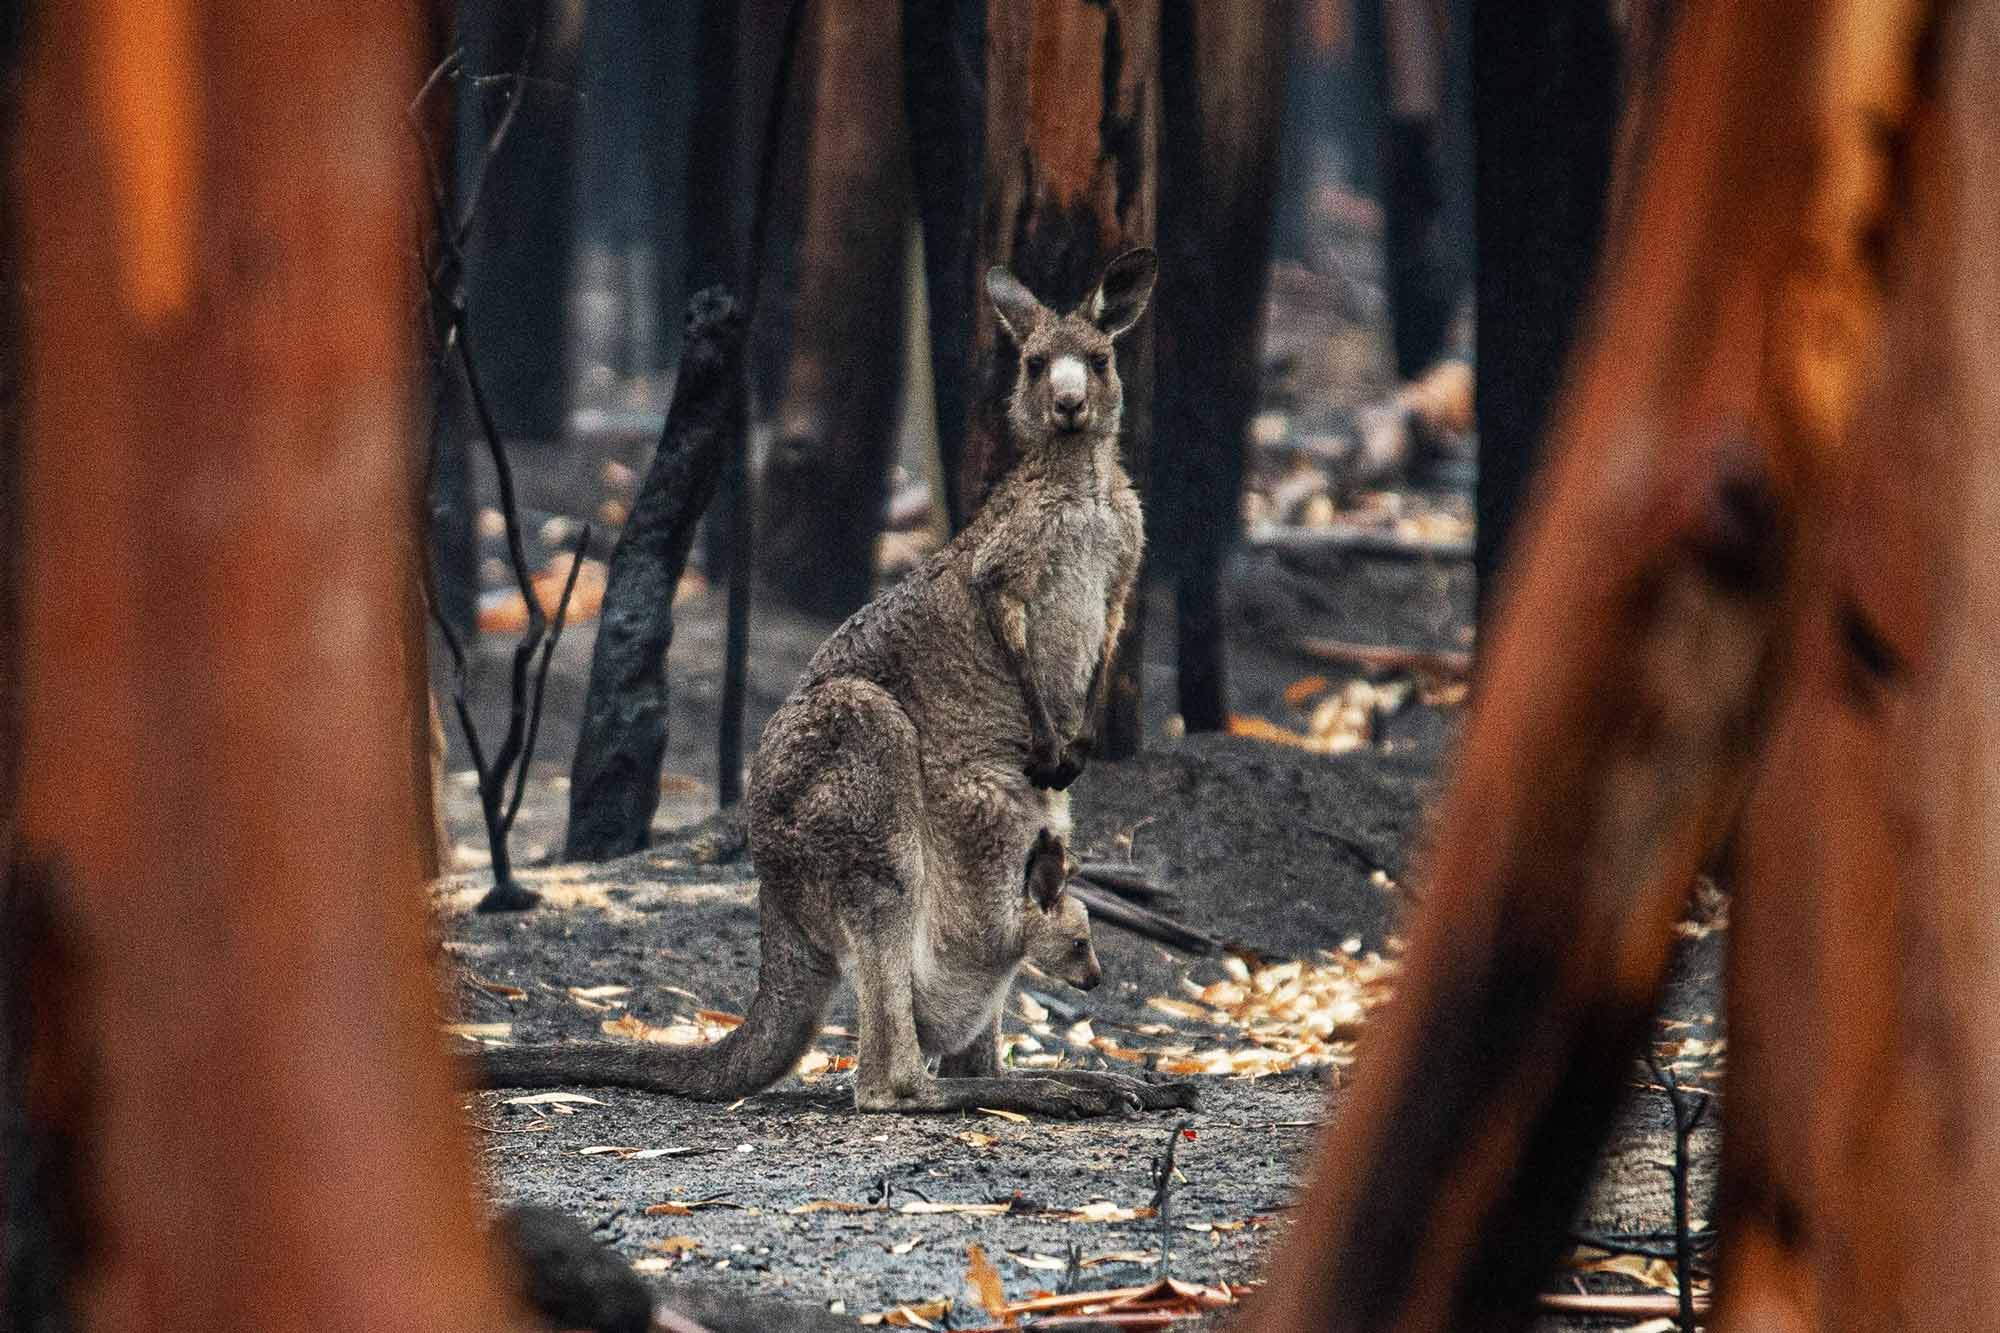
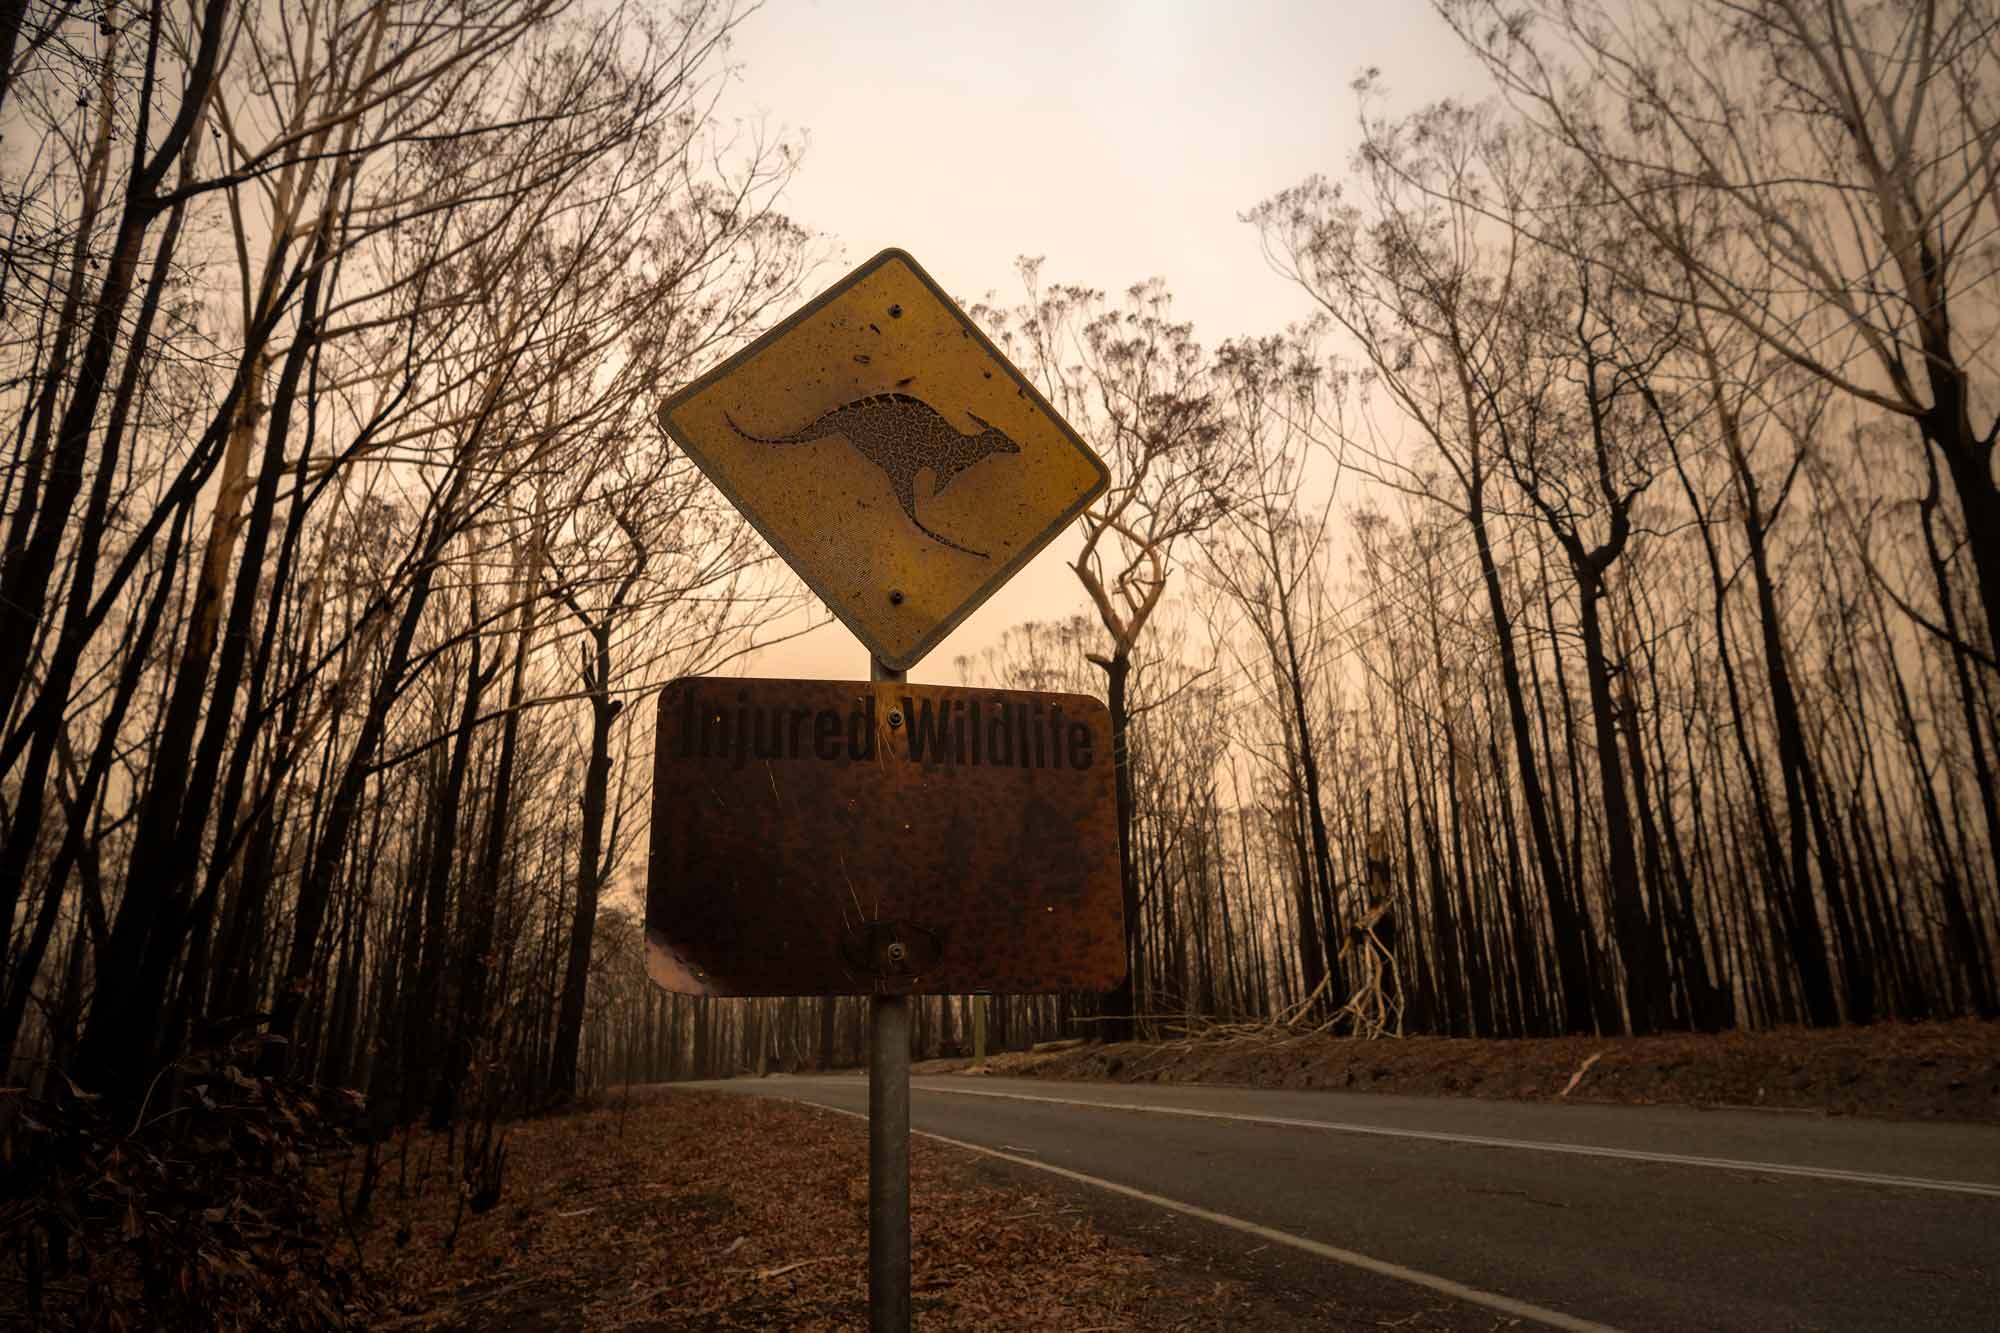
The 2019–20 bushfire season was the worst New South Wales has ever recorded. Over the course of a few months, 5.5 million hectares of land was burnt, claiming the lives of many people and upwards of a billion animals.
Simon Oliver, the National Earth and Marine Observations Director of Operations and Production for Geoscience Australia, recently spoke to the Eyes on Earth podcast crew at the USGS Earth Resources Observation and Science (EROS) Center about the devastating fires, and how remote-sensing capabilities like Landsat proved useful during and after the disaster.
Geoscience Australia has had a 40-plus-year partnership with the United States Geological Survey (USGS), providing vital ground-station services as part of the USGS' global Landsat International Cooperator Network, says Steve Labahn, the Landsat International Ground Station Network Manager for the USGS.
Geoscience Australia's Alice Springs satellite ground station forms part of the global Landsat satellite ground station network and has been in operation since 1979.
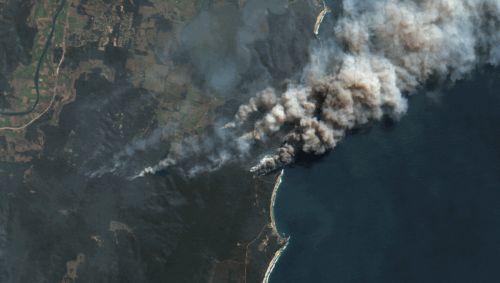
Geoscience Australia collects data from a number of Earth monitoring satellites from the Alice Springs ground station, including Landsat 7 and 8, which provides important information about changes or impacts to the landscape during bushfires and other hazard events.
Having the satellite ground station at Alice Springs, "enabled data acquisition and product generation in near-real-time over Australia, which greatly assisted in the response to disasters such as these fires," Labahn said.
The following are excerpts from Simon Oliver's podcast interview, reproduced with thanks to the USGS:
USGS: How were data from Landsat and other Earth-observing systems used in monitoring, measuring, and otherwise informing decision makers during the Black Summer fires?
Oliver: "In the lead-up to the fires, Earth observing system data, among other things, fed into modelling of fire risk by underpinning indicators such as fuel moisture. They contributed to weather observation and forecasts, into mapping of land use and cover, in assessing water quality and availability, as well as to inform on the location of infrastructure.
"During the emergency response phase, Earth observation data contributed to an understanding of where active fires were burning, and the weather forecast. And in the post-fire phase, towards assessing the impact of the fires through its role in enabling the mapping of burn extent, for which Landsat has been used to great effect in the past. Remotely-sensed data was used in assessing burn severity, and in monitoring the availability and quality of water, which can be impacted by ash and debris runoff into water reservoirs following a fire, for example, as well as in monitoring air quality and the environmental recovery more generally."
USGS: The data was useful during the active burning as well?
Oliver: "Geoscience Australia operates the Digital Earth Australia (DEA) Hotspots application, which provides timely information about hotspots to emergency service managers across Australia. The Hotspot system uses satellite sensor data that's collected by Australia's network of ground receiving stations, downlinking the majority of this data from US satellites, as well as other sources of data such as those provided by Japanese weather satellites. That data is used to detect areas producing high levels of infrared radiation ... and we call these Hotspots. This information then allows users to identify potential fire locations, which pose a possible risk to communities and property. The Hotspots information updates multiple times a day and is typically available to users within 30 minutes of the satellite overpass."
USGS: And was Landsat in particular helpful?
Oliver: "Geoscience Australia also has automated routines that pull down the Real Time Landsat data product from EROS and makes that available to emergency services. This helps complement other near-real-time products like Digital Earth Australia's Sentinel-2 analysis ready data, in which Geoscience Australia value-adds to the satellite data provided by Europe. We also feed that data into web map services that help provide some context to the information available in the Hotspots service."
USGS: How do satellites help to measure the tons of carbon dioxide that were emitted into the atmosphere during these most recent fires?
Oliver: "Australia uses satellite data for carbon accounting, using a quite advanced ecosystem model known as FullCAM, or the Full Carbon Accounting Model, which has been fully calibrated for Australian conditions. That model is capable of estimating greenhouse gas emissions from land use changes, in a spatially explicit manner. It's capable of modelling forest disturbance events such as harvesting, prescribed burning or wildfires. The model requires inputs from quite a few spatial datasets, but most important in this is the land cover change data derived from the Landsat time series data from 1972 onwards. Along with burnt area data derived from other satellites, and ground calibration data, this information informs the model to estimate greenhouse gas emissions from wildfires."
USGS: How will Landsat and other Earth-observing systems be used to help Australia recover from this disaster?
Oliver: "Landsat, in particular, is an invaluable resource to enable our understanding of vegetation dynamics and the environment in general in Australia, and we make use of the long-term archive to measure the current state, compare with earlier years, and then track recovery into the future. We use a number of products created by Australian universities in this way, especially to monitor changes in land cover and vegetation canopy cover. These will be essential going forward, to be able to understand the impact of the fires and then monitor the recovery of the environment."
Listen to the podcast and read the original article here. Republished with permission of the United States Geological Survey.


