Interferometric Synthetic Aperture Radar
Last updated:14 December 2017
Interferometric Synthetic Aperture Radar (InSAR) is a geodetic technique that can identify movements of the Earth's surface. Observations of surface movement made using InSAR can be used to detect, measure, and monitor crustal changes associated with geophysical processes such as tectonic activity and volcanic eruptions. Ground subsidence caused by anthropogenic influences such as groundwater or hydrocarbon extraction can also be identified with InSAR. When combined with ground-based geodetic monitoring, such as Global Navigation Satellite Systems, InSAR can identify surface movements of millimetre to centimetre scale with high spatial resolution.
InSAR can be used for a wide range of surface deformation studies, for example:
- Subsidence and uplift induced by anthropogenic activities such as groundwater or hydrocarbon extraction, or reinjection into reservoirs during carbon capture and storage
- coseismic deformation caused during an earthquake
- postseismic and interseismic deformation on crustal faults between earthquakes
- inflation/deflation of subsurface magma chambers preceding volcanic eruptions
- monitoring surface movements in urban environments.
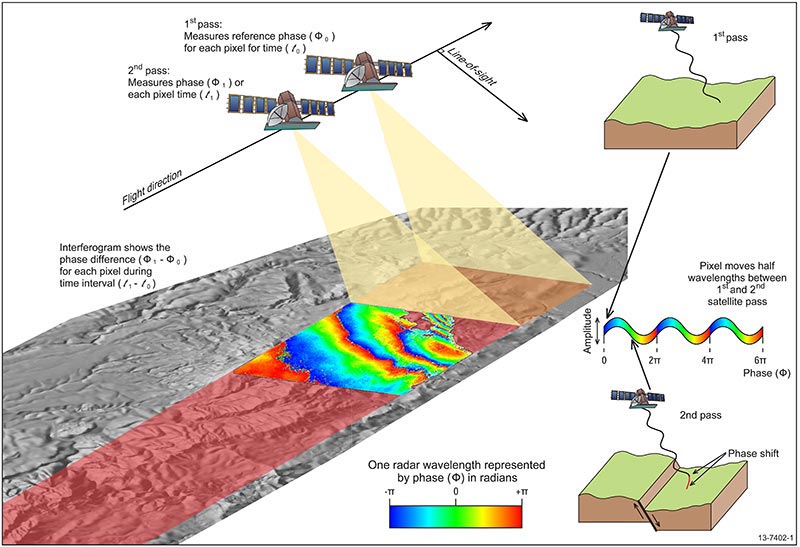
Figure 1: Two SAR images of the same area are acquired at different times. If the surface moves between the two acquisitions a phase shift is recorded. An interferogram maps this phase shift spatially.
How InSAR works
InSAR uses two or more Synthetic Aperture Radar (SAR) images of an area to identify surface movements through time. Remote sensing satellites that collect SAR imagery transmit pulses of microwave energy to the Earth's surface and record the amount of backscattered energy. The use of microwave energy provides an all-weather capability because of its low sensitivity to clouds and rain.
SAR images contain information on the Earth's surface in the form of the amplitude and phase components of the backscattered radar signal. The amplitude image records information on the terrain slope and surface roughness, while the phase image records information on the distance between the satellite and the Earth's surface.
Differential InSAR uses two SAR images of the same area acquired at different times. If the distance between the ground and satellite changes between the two acquisitions due to surface movement, a phase shift will occur (Figure 1).
When mapped spatially the phase shift is a 'wrapped' signal within a range of 2 radians that appears as a series of interference fringes in an interferogram (Figure 2A). When this interferogram is unwrapped, the number of fringes is summed to give a continuous field of relative phase change (Figure 2B). When first processed, the initial interferogram contains a number of signal components, such as residual signals due to the orbital geometry of the satellite and signals due to the different atmospheric conditions at the time of the two acquisitions. After processing a network of interferograms, the signal component originating from surface movement can be isolated.
Figure 2: A wrapped (A) and unwrapped (B) interferogram of an earthquake doublet that occurred in West Papua, Indonesia created using data from the Japanese ALOS satellite. The magnitude 7.6 and 7.4 earthquakes occurred on 03 January 2009 within 3 hours of each other and were caused by subduction on the offshore Manokwari Trench, which is located north of the coastline. Unwrapped phase in radians can be converted to 'range change' or displacement in millimetres with knowledge of the satellite radar wavelength.
InSAR products
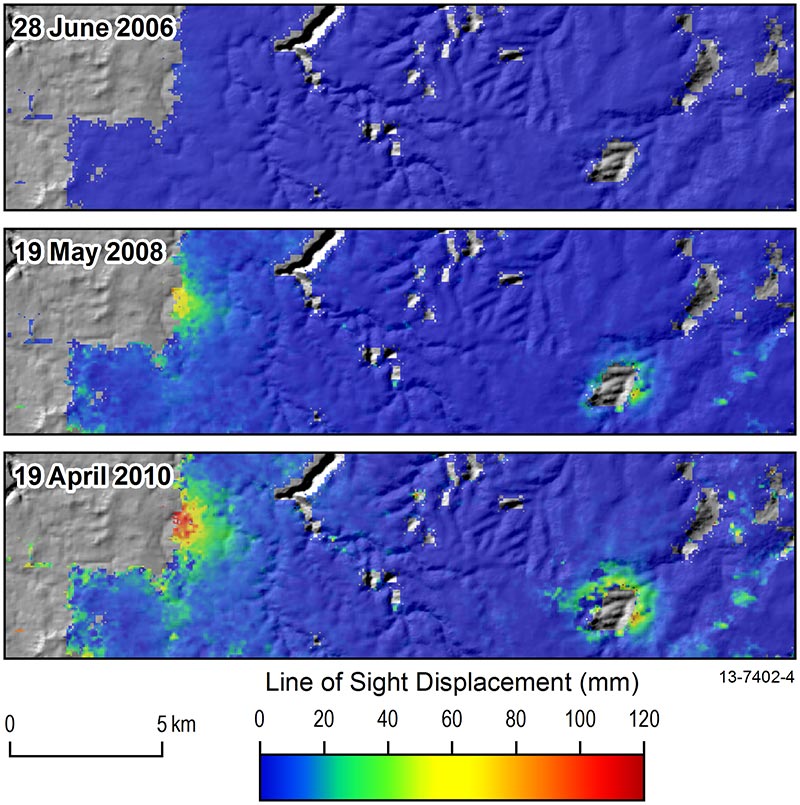
By combining a network of multiple interferograms over a region, velocity map and time-series products can be generated (Figure 3). A velocity map gives the surface movement for each image pixel averaged over the total observation period whereas the time-series product shows the history of surface positions for a pixel at each acquisition time. The former is useful for mapping geophysical processes that occur steadily through time, for example the build-up of strain at a locked crustal fault zone. The latter is useful for detecting geophysical processes that vary considerably through time and may cause fluctuations in the direction of surface movement, for example the inflation and deflation of a magma chamber beneath an active volcano.
Figure 3: InSAR time-series product showing cumulative surface displacement over time for a small region in the southern New South Wales coal fields. The 1-dimensional displacement observations are in the line-of-sight of the satellite; the slanted path between the ground and satellite position. The positive polarity of the signal at two anomalous zones indicates movement away from the satellite (i.e. subsidence).
Contact information
- Email: insar@ga.gov.au


